Introduction
The phase transitions among different high-pressure polymorphs of calcium carbonate (CaCO3) have been a topic of interest since the pioneering study made by Bridgman (Reference Bridgman1938). It is known broadly that with increasing pressure calcite undergoes a series of complex phase transitions, which is of great importance in our understanding of the transfer of carbonates through the subduction process (Litasov and Ohtani, Reference Litasov and Ohtani2009). To date, seven high-pressure polymorphs including calcite (commonly referred to as CaCO3-I), CaCO3-II, CaCO3-III, CaCO3-IIIb, CaCO3-VI, aragonite and post-aragonite, have been reported (Davis, Reference Davis1964; Fong and Nicol, Reference Fong and Nicol1971; Kondo et al., Reference Kondo, Suito and Matsushima1972; Merrill and Bassett, Reference Merrill and Bassett1975; Mirwald, Reference Mirwald1976; Liu and Mernagh, Reference Liu and Mernagh1990; Suito et al., Reference Suito, Namba, Horikawa, Taniguchi, Sakurai, Kobayashi, Onodera, Shimomura and Kikegawa2001; Ono et al., Reference Ono, Kikegawa, Ohishi and Tsuchiya2005; Oganov et al., Reference Oganov, Glass and Ono2006; Ono et al., Reference Ono, Kikegawa and Ohishi2007; Oganov et al., Reference Oganov, Ono, Ma, Glass and Garcia2008; Wang and Zheng, Reference Wang and Zheng2011; Merlini et al., Reference Merlini, Hanfland and Crichton2012, Reference Merlini, Crichton, Chantel, Guignard and Poli2014; Pippinger et al., Reference Pippinger, Miletich, Merlini, Lotti, Schouwink, Yagi, Crichton and Hanfland2015; Koch-Müller et al., Reference Koch-Müller, Jahn, Birkholz, Ritter and Schade2016). In particular, the two different structural polymorphs termed CaCO3-III and CaCO3-IIIb, characterised with different cell parameters and Raman vibrational modes, have been identified under similar P–T conditions (Liu and Mernagh, Reference Liu and Mernagh1990; Merlini et al., Reference Merlini, Hanfland and Crichton2012, Reference Merlini, Crichton, Chantel, Guignard and Poli2014). High-pressure experiments have been made investigating the crystal structures of these two high-pressure polymorphs and the transformation processes among CaCO3-III, CaCO3-IIIb and other CaCO3 high-pressure structures (e.g. CaCO3-II or aragonite). However, results from these investigations appeared contradictory: In the first experiment where two CaCO3-III structures were first identified (Liu and Mernagh, Reference Liu and Mernagh1990), both CaCO3-III and CaCO3-IIIb were observed in the 2.0–7.5 GPa pressure range, and coexistence of both structures was observed at 5.2 GPa. In more recent studies, Merlini et al. (Reference Merlini, Hanfland and Crichton2012, Reference Merlini, Crichton, Chantel, Guignard and Poli2014) also revealed the coexistence of CaCO3-III and CaCO3-IIIb structures at pressures above 2.5 GPa, and determined the crystal structures to be triclinic by using single-crystal synchrotron X-ray diffraction. However, according to the results from Pippinger et al. (Reference Pippinger, Miletich, Merlini, Lotti, Schouwink, Yagi, Crichton and Hanfland2015), CaCO3-IIIb and CaCO3-III were observed, respectively, in 2.14–3.14 GPa and 3.42–5.42 GPa pressure ranges under ambient temperature, whereas at 283 K (~10°C), the stability pressure ranges for CaCO3-III and CaCO3-IIIb were 2.20–3.71 GPa and 3.84–4.45 GPa, respectively.
In this paper, in order to investigate the phase relations among CaCO3-II, CaCO3-III and CaCO3-IIIb and the reasons for the discrepancies in the P–T stability areas of CaCO3-III and CaCO3-IIIb reported in the literature, a new high-pressure experiment was prepared by using a diamond anvil cell (DAC) and micro-Raman spectroscopy. The phase transitions from CaCO3-II to simultaneous CaCO3-III and CaCO3-IIIb were observed, the P–T point for the CaCO3-II to CaCO3-III/IIIb phase transition was determined precisely, and the difference between the transformation processes from CaCO3-II to CaCO3-III and CaCO3-IIIb is discussed, which should be of importance in developing a better understanding of the phase relations among CaCO3 high-pressure polymorphs.
Experimental methods
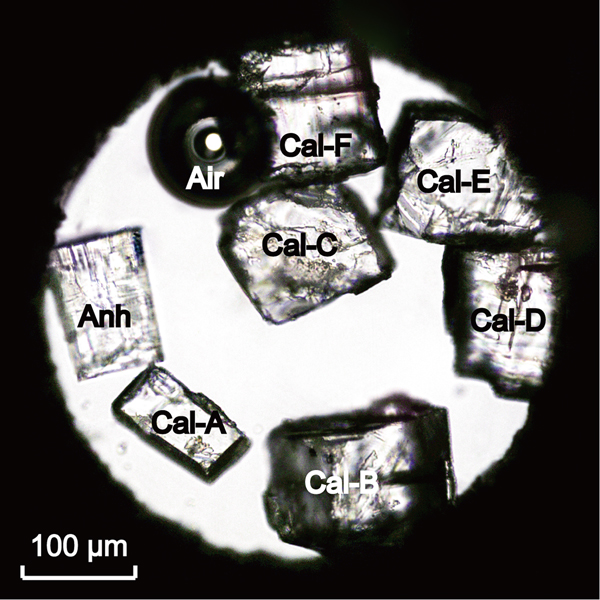
Our high-pressure experiment was accomplished by using a Bassett-type (Bassett et al., Reference Bassett, Shen, Bucknum and Chou1993) DAC. The sample chamber of the DAC consisted of an initial ~400 µm diameter hole in the centre a 125 µm thick rhenium gasket, which was held between the 800 µm diameter culets of two opposed type IIA low-fluorescence diamond anvils. Hydrostatic pressures within the sample chamber were achieved by using a conventional 4:1 methanol–ethanol fluid as a pressure-transmitting medium. Pressure calibration was udertaken by using the relative peak position shifts of the ν 1, 1016 Raman peak of anhydrite at pressures below 2.2 GPa (Yuan et al., Reference Yuan, Mayanovic and Zheng2016), and from the ν 1, 1103 Raman peak shift of CaCO3-IIIb (Pippinger et al., Reference Pippinger, Miletich, Merlini, Lotti, Schouwink, Yagi, Crichton and Hanfland2015) under higher pressures. In order to investigate the influence of calcite sample quality on the CaCO3 phase transition pressures, three natural calcite samples were crushed and six fragments (Cal-A–F), each measuring 50–100 µm in length and width and ~50 µm in thickness, were selected for this high-pressure experiment (Fig. 1). Samples Cal-A and Cal-C were from a pure and transparent Iceland spar, with Cal-C being relatively large and having some irregular plates on the surfaces; samples Cal-D and Cal-E were from a white and semitransparent calcite monocrystal, with some tiny cracks developed within the samples; and finally Cal-B and Cal-F were from a slight reddish calcite vein containing trace amounts of iron or manganese, and characterised with visible cracks through the samples. It is possible that the visible parallel lines in the last four samples could be due to forced twinning produced during crushing. By introducing a small air bubble into the sample chamber, the initial sealing pressure was controlled to be ~0 MPa. Thereafter by slightly advancing the DAC platen screws, pressure within the sample chamber was increased stepwise to 3.38 GPa. By using this process the phase transitions from calcite to CaCO3-II and from CaCO3-II to simultaneous CaCO3-III and CaCO3-IIIb were carefully observed and recorded.
A photomicrograph of the anhydrite (Anh) and calcite (Cal-A–F) samples loaded into the DAC sample chamber under ambient conditions.

The unpolarised Raman spectra of all samples were measured using a HORIBA JY confocal LabRAM HR Evolution system installed at the School of Earth and Space Sciences, Peking University. The Raman spectrometer was equipped with an Olympus SLMPlan N 20× long working distance objective (N.A. = 0.25), a 532 nm frequency doubled Nd:YAG green laser and a stigmatic 800 mm spectrometer with an 1800 groove/mm grating, providing a spectral resolution of ± 0.3 cm–1. The Raman spectra of anhydrite and calcite samples were measured by averaging five repeated collections, using an acquisition time of 10 s per collection, in a Raman shift range from 100 to 1200 cm−1. For precise determination of the Raman peak parameters, all observed symmetric and asymmetric Raman peaks were fitted with Gauss + Lorentz or Pearson type IV amplitude functions, respectively, by following the procedures outlined by Yuan and Mayanovic (Reference Yuan and Mayanovic2017).
Results
Raman vibrations of calcite and CaCO3-II under high pressures
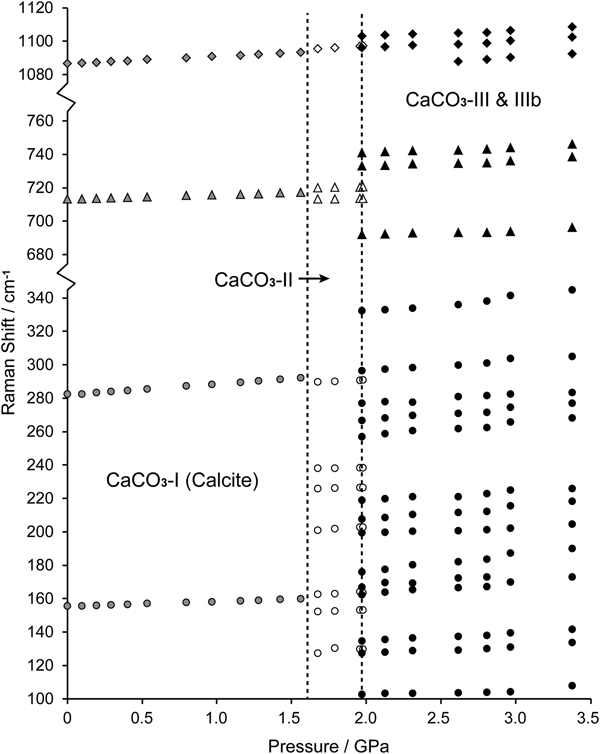
The Raman peaks of all calcite samples measured under ambient conditions were located at 155.84 ± 0.17, 282.68 ± 0.31, 713.21 ± 0.18 and 1087.07 ± 0.13 cm–1 for the two external (lattice) vibrations (T 1 and T 2), the C–O in-plane bending (ν 4), and symmetric stretching (ν 1) vibrations, respectively. With increasing pressure all observed Raman bands shifted to higher frequencies systematically, at ∂ν/∂p rates of 2.68 ± 0.07, 6.40 ± 0.07, 2.47 ± 0.05 and 4.36 ± 0.01 cm–1/GPa for the T 1, T 2, ν 1 and ν 4 Raman vibrations, respectively (Figs 2 and 3). The measured Raman peak positions and peak shifting rates with pressure in this study are in good agreement with the results from other research (Liu and Mernagh, Reference Liu and Mernagh1990; Buzgar and Apopei, Reference Buzgar and Apopei2009; Fu and Zheng, Reference Fu and Zheng2013; Yuan et al., Reference Yuan, Mayanovic and Zheng2016). The influence of pressure on the calcite lattice and C–O vibrations has been discussed in detail by Gillet et al. (Reference Gillet, Biellmann, Reynard and Mcmillan1993) and will not be repeated in this research.
Raman spectra of calcite, CaCO3-II and CaCO3-III and IIIb as measured with sample Cal-A from ambient pressure to 1.98 GPa. See text for description of the phase transitions from calcite to CaCO3-II and from CaCO3-II to CaCO3-III and IIIb.

Raman peak positions of calcite (filled grey), CaCO3-II (blank) and CaCO3-III and IIIb (filled black) measured with sample Cal-C in the 0.1 MPa to 3.38 GPa pressure range. Symbols: circle, triangle and diamond represent the CaCO3 lattice vibrations, C–O in-plane bending (ν 4) and symmetric stretching (ν 1) vibrations, respectively.

The phase transition from calcite to CaCO3-II was observed between 1.56 and 1.67 GPa for all samples, which was characterised by splitting of the ν 4 Raman band into two (713 and 720 cm–1), appearance of new lattice vibrations occurring at 130, 163, 202, 226 and 239 cm–1, and shifting of the T 1, T 2 and ν 1 bands from 160, 292 and 1093.6 cm–1 to 153, 290 and 1096.4 cm–1, respectively (Figs 2 and 3). The CaCO3-II structure was stabilised under pressures up to 1.97 GPa and therefore, in agreement with the CaCO3-II to CaCO3-III phase transition pressure of ~2 GPa (Merrill and Bassett, Reference Merrill and Bassett1975; Liu and Mernagh, Reference Liu and Mernagh1990; Hess et al., Reference Hess, Ghose and Exarhos1991; Suito et al., Reference Suito, Namba, Horikawa, Taniguchi, Sakurai, Kobayashi, Onodera, Shimomura and Kikegawa2001). Within the CaCO3-II stability pressure range, all observed Raman bands shifted to higher frequencies with increasing pressure (Fig. 3). The overall ∂ν/∂p rates of the seven lattice vibrations, two C–O in-plane bending and one symmetric stretching vibrations were 0.65–6.01, 0.96 and 1.92, and 5.98 cm–1/GPa, respectively. Note that for the C–O symmetric stretching vibration (ν 1), the greater ∂ν/∂p rate in CaCO3-II can be interpreted as because the CO32− groups in CaCO3-II are more compressible than those in calcite. This is consistent with the CaCO3-II bulk modulus being significantly lower than that of calcite, determined as 34 and 73 GPa, respectively (Aidun and Gupta, Reference Aidun and Gupta1995).
Raman vibrations of CaCO3-III and CaCO3-IIIb
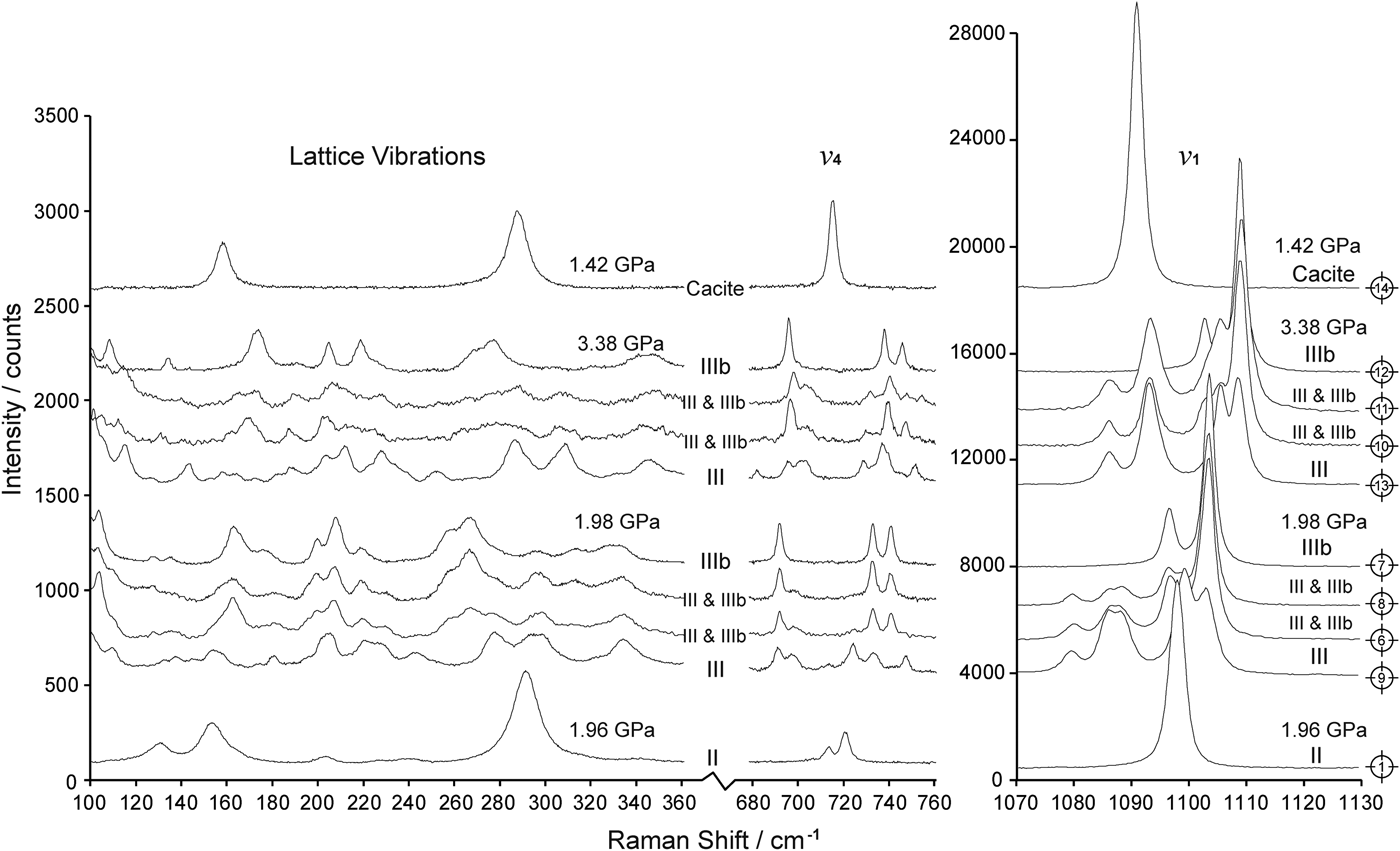
Along with the phase transition from CaCO3-II to CaCO3-III and CaCO3-IIIb, prominent changes in the measured Raman spectra can be recognised, including splitting of the internal C–O vibrations (ν 1 and ν 4) and the appearance of new external lattice vibrations (Figs 2, 5 and 6). The lattice vibrations in CaCO3-III and CaCO3-IIIb were similarly complicated and most Raman peaks were weak and poorly resolved. Nevertheless, it can be distinguished from the Raman spectra measured under 1.96–1.98 GPa, that the characteristic lattice vibration of CaCO3-III (marked by upward arrows in Fig. 5) contains more than 12 Raman peaks at 97.1, 109.3, 137.6, 155.1, 181.3, 201.4, 220.0, 229.3, 243.1, 278.5, 297.7 and 333.6 cm–1, whereas at least 14 bands at 96.9, 103.6, 127.5, 135.1, 162.7, 176.2, 199.6, 207.8, 219.1, 258.7, 266.2, 296.8, 313.2 and 333.0 cm–1, can be observed in the Raman spectra of CaCO3-IIIb (marked by downward arrows in Fig. 5). The lowest band located at ~97 cm–1 is from Pippinger et al. (Reference Pippinger, Miletich, Merlini, Lotti, Schouwink, Yagi, Crichton and Hanfland2015) and is not investigated in this study.
As for the internal vibrational modes of the CO32− groups, the C–O symmetric stretching vibration (ν 1) of CaCO3-III split into five bands occurring at 1079.4, 1085.6, 1088.2, 1098.4 and 1101.3 cm–1, whereas that of CaCO3-IIIb split into two at 1096.3 and 1103.3 cm–1 (Fig. 5). The relative intensity of the split Raman bands of CaCO3-III also varied, depending upon the crystallographic orientation of the CaCO3 samples relative to the incident laser (Fig. 5). It should be noted that the last four (1085.6, 1088.2, 1098.4 and 1101.3 cm–1) bands in the CaCO3-III symmetric stretching vibration were resolved for the first time. This is due to the spectral resolutions of the Raman spectrometers used in previous studies being generally 1.0–2.0 cm–1 (Fong and Nicol, Reference Fong and Nicol1971; Liu and Zheng, Reference Liu and Zheng2012; Pippinger et al., Reference Pippinger, Miletich, Merlini, Lotti, Schouwink, Yagi, Crichton and Hanfland2015; Liu et al., Reference Liu, Hai-Fei and Wang2017), which are significantly lower than that used in our experiment (0.3 cm–1). In addition, the C–O in-plane bending vibration (ν 4) of CaCO3-IIIb split into three sharp peaks, whereas at least five peaks can be recognised for the same vibration in CaCO3-III (Fig. 5). As distinguishable differences existed between the Raman vibrations of CaCO3-III and CaCO3-IIIb, convincing evidence for the presence of CaCO3-III or CaCO3-IIIb, or the coexistence of both crystal structures can be obtained from the Raman spectra measured.
Details in the transformation from CaCO3-II to CaCO3-III and CaCO3-IIIb
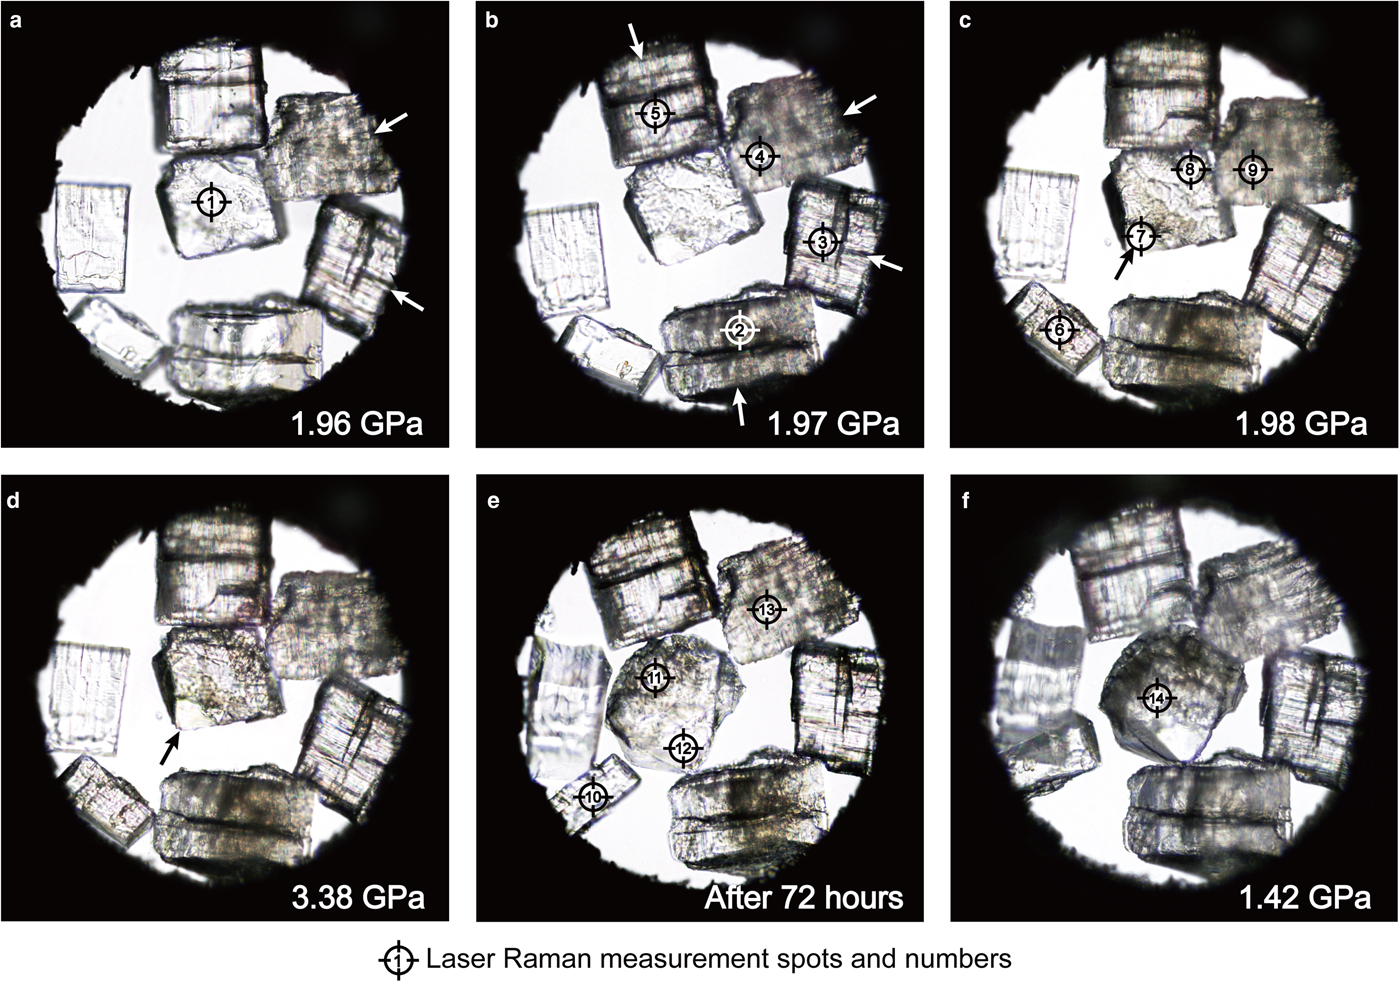
In situ photomicrographs of the phase transformation from CaCO3-II to CaCO3-III and CaCO3-IIIb are shown in Fig. 4. According to the pressure calibrated using the anhydrite Raman pressure sensor, the CaCO3-II to CaCO3-III phase transition was observed initially at 1.96 GPa, which was visually characterised by development of cracks or twinning in two CaCO3 samples (Cal-D and Cal-E, as marked by white arrows in Fig. 4a). The system was then kept for 10 min but no more changes in other CaCO3 samples were observed. Pressure in the sample chamber was then increased by slightly advancing the DAC platen screws, and another two CaCO3 samples (Cal-B and Cal-F) were seen to transform to CaCO3-III at 1.97 GPa, as marked with white arrows in Fig. 4b. After the system was kept for another 10 min, a phase transition of the last two CaCO3 samples (Cal-A and Cal-C) was observed at 1.98 GPa, after the system pressure was increased again (Fig. 4c).
One intriguing result in our present study is, as confirmed from the Raman spectra measured with all CaCO3 samples, that Cal-B, D and F transformed from CaCO3-II directly to CaCO3-III, whereas both CaCO3-III and CaCO3-IIIb crystal structures were observed to coexist in Cal-A, C and E but without visible phase boundaries (Figs 4–6). The characteristic Raman bands of CaCO3-IIIb were also observed in Cal-C while the incident laser was focused on a flawless corner, as marked by Raman measurement spots No. 7 and No. 12 in Fig. 4. Therefore, in contrast to the transformation from CaCO3-II to CaCO3-III, which can be recognised visually from development of massive cracks or twinning in the CaCO3 samples, the CaCO3-II to CaCO3-IIIb transformation occurred under the same conditions but without any perceptible changes in the sample appearance, as marked by black arrows in Figs 4c and 4d. Coexistence of CaCO3-III and CaCO3-IIIb was observed briefly in Cal-E at 1.97 GPa, before the sample transformed completely to CaCO3-III at 1.98 GPa (Fig. 5). However, in the other two samples (Cal-A and Cal-C), coexistence of CaCO3-III and CaCO3-IIIb was observed over a wide pressure range from 1.97 to 3.38 GPa (Fig. 4c and 4d). After the samples were preserved under 3.38 GPa for 72 h, sluggish transformation from CaCO3-IIIb to CaCO3-III can be recognised from the increase in the CaCO3-III volume proportion in Cal-C (Fig. 4e), and from the intensity ratios of the Raman bands of CaCO3-III (e.g. 1079.4, 1085.6 and 1088.2 cm–1 peaks) to those of CaCO3-IIIb (e.g. 1103.3 cm–1 peak) being nearly twice of the values under 1.98 GPa for both samples (Fig. 6). No significant changes were observed in the CaCO3-III samples (Cal-B, D and F) during the same period.
Photomicrographs of the phase transition from CaCO3-II to CaCO3-III and CaCO3-IIIb. (a–b) Two and four CaCO3 samples (marked with white arrows) transformed to CaCO3-III under 1.96 and 1.97 GPa, respectively. (c) Transformations of Cal-A and Cal-C from CaCO3-II to simultaneous CaCO3-III and CaCO3-IIIb structures under 1.98 GPa. (d–e) Coexistence of CaCO3-III and CaCO3-IIIb in samples Cal-A and Cal-C under 3.38 GPa, and slow transformation from CaCO3-IIIb to CaCO3-III can be recognised from the increase in the CaCO3-III volume proportion in Cal-C after 72 h. (f) All CaCO3-III and CaCO3-IIIb samples transformed directly to calcite after the pressure decreased to 1.42 GPa.

Raman spectra of CaCO3-III and CaCO3-IIIb as measured with samples Cal-A–F under 1.96–1.98 GPa. The Raman spectra were measured at the Raman measurement spots illustrated in Fig. 4. The representative Raman bands of CaCO3-III and CaCO3-IIIb were marked with upward and downward arrows, respectively. See text for detailed descriptions of the Raman vibrations of CaCO3-III and CaCO3-IIIb.

Raman spectra of CaCO3-II, CaCO3-IIIb and CaCO3-III as measured during the phase transition from CaCO3-II to CaCO3-IIIb and CaCO3-III. The Raman measurement spot for each spectrum is illustrated in Fig. 4.

Discussion
Constraining the CaCO3-II to CaCO3-III/IIIb phase transition pressure
The phase transition from CaCO3-II to CaCO3-III or CaCO3-III and IIIb is characterised by visible transformation of the CaCO3 samples from monocrystals to acicular or pectinate domains (Figs 4a–c). In addition, results from high-pressure X-ray diffraction experiments show that there are breaking and reforming of chemical bonds as well as discontinuities in density and cell parameters occurring along the transformation from CaCO3-II to CaCO3-III and CaCO3-IIIb (Merlini et al., Reference Merlini, Hanfland and Crichton2012; Pippinger et al., Reference Pippinger, Miletich, Merlini, Lotti, Schouwink, Yagi, Crichton and Hanfland2015). Therefore, it can be concluded that both CaCO3-II to CaCO3-III and CaCO3-II to CaCO3-IIIb phase transitions are reconstructive processes, which are controlled not only by pressure and temperature, but also by phase-transition kinetics and structural metastability (Toledano and Dmitriev, Reference Toledano, Dmitriev and Boulesteix1995) of the CaCO3 samples. Natural CaCO3 samples generally differ in impurities and crystal defects and hence, vary in structural metastability, leading to asynchronous transformation from CaCO3-II to CaCO3-III and/or CaCO3-IIIb being observed among different samples in our experiment (Figs 4a–c). Nevertheless, we believe the influence of trace impurities (e.g. trace iron or manganese in samples Cal-B and Cal-F) and crystal defects on the CaCO3-II to CaCO3-III/IIIb phase-transition pressure in the present study was insignificant, as transformations from CaCO3-II to CaCO3-III/IIIb for all samples were seen to occur within a small pressure range between 1.96 and 1.98 GPa. As for calcite samples containing greater amounts of impurities, such as marbles containing a certain amount of magnesium, their phase-transition pressures from CaCO3-II to CaCO3-III/IIIb high-pressure structures may be different from the results in this study.
However, in order to constrain the pressures of the phase transitions from CaCO3-II to CaCO3-III/IIIb as described above, apart from the variation in structural metastability among different CaCO3 samples, pressure changes within the DAC sample chamber along the phase transition is the other factor that must be taken into consideration. According to the results from Merlini et al. (Reference Merlini, Hanfland and Crichton2012), both CaCO3-III (ρ = 2.99 g/cm3 at 2.8 GPa) and CaCO3-IIIb (ρ = 2.96 g/cm3 at 3.1 GPa) are denser than CaCO3-II (ρ = 2.84 g/cm3 at 2.0 GPa), resulting in a volume decrease of ~4% during the phase transition from CaCO3-II to CaCO3-III/IIIb. As the CaCO3 sample volumes were relatively large in our experiment (each sample occupied ~3% of the DAC sample chamber volume), along with the transformation of one or two samples from CaCO3-II to CaCO3-III and/or CaCO3-IIIb, pressure within the sample chamber was estimated to decrease by several MPa to >10 MPa. As a result, pressure within the sample chamber was insufficient to activate the phase transition of the rest of the CaCO3-II samples. Given the structural metastability among different CaCO3 samples, the decrease in pressure during phase transition and the uncertainty in pressure calibration using the anhydrite Raman pressure sensor, the CaCO3-II to CaCO3-III and/or CaCO3-IIIb transformation pressure at ambient temperature is determined to be 1.97 ± 0.03 GPa in this study, which is consistent with, and more accurate than, the results from previous research (Bridgman, Reference Bridgman1938; Davis, Reference Davis1964; Fong and Nicol, Reference Fong and Nicol1971; Liu and Mernagh, Reference Liu and Mernagh1990; Suito et al., Reference Suito, Namba, Horikawa, Taniguchi, Sakurai, Kobayashi, Onodera, Shimomura and Kikegawa2001; Merlini et al., Reference Merlini, Crichton, Chantel, Guignard and Poli2014; Pippinger et al., Reference Pippinger, Miletich, Merlini, Lotti, Schouwink, Yagi, Crichton and Hanfland2015; Liu et al., Reference Liu, Hai-Fei and Wang2017).
Phase relations among CaCO3-II, CaCO3-III and CaCO3-IIIb
Among the many high-pressure experiments carried out investigating the phase relations among CaCO3 high-pressure polymorphs, CaCO3-III has been confirmed extensively to be the stable phase at pressures above 2 GPa under ambient temperature, whereas CaCO3-IIIb was reported to be a phase coexisting with CaCO3-III in only a few results in the literature (Davis, Reference Davis1964; Fong and Nicol, Reference Fong and Nicol1971; Liu and Mernagh, Reference Liu and Mernagh1990; Suito et al., Reference Suito, Namba, Horikawa, Taniguchi, Sakurai, Kobayashi, Onodera, Shimomura and Kikegawa2001; Catalli and Williams, Reference Catalli and Williams2005; Oganov et al., Reference Oganov, Glass and Ono2006; Wang and Zheng, Reference Wang and Zheng2011; Merlini et al., Reference Merlini, Crichton, Chantel, Guignard and Poli2014; Yuan et al., Reference Yuan, Mayanovic and Zheng2016; Liu et al., Reference Liu, Hai-Fei and Wang2017). This indicates that CaCO3-IIIb should be less stable than CaCO3-III under such conditions. Merlini et al. (Reference Merlini, Hanfland and Crichton2012) reported transformation from CaCO3-II to CaCO3-IIIb on low compression rates and determined the CaCO3-IIIb crystal structure to be triclinic but with monoclinic pseudo-symmetry. They considered CaCO3-IIIb to be a metastable or transient state, depending upon the experimental pressure-time pathway. Pippinger et al. (Reference Pippinger, Miletich, Merlini, Lotti, Schouwink, Yagi, Crichton and Hanfland2015) reported CaCO3-IIIb as an intermediate phase during the phase transition from CaCO3-II to CaCO3-III, and the stability pressure ranges for CaCO3-IIIb and CaCO3-III were 2.14–3.14 GPa and 3.42–5.42 GPa under ambient temperature, and 2.20–3.71 GPa and 3.84–4.45 GPa under 283 K, respectively.
In our experiment three CaCO3-II samples (Cal-B, D and F) were observed to transform to CaCO3-III and the other three (Cal-A, C and E) to simultaneous CaCO3-III and CaCO3-IIIb, indicating the stability areas for CaCO3-III and CaCO3-IIIb should at least overlap within the pressure range investigated in this study, which is contradictory to the results from Pippinger et al. (Reference Pippinger, Miletich, Merlini, Lotti, Schouwink, Yagi, Crichton and Hanfland2015) but in agreement with those from other researchers (Liu and Mernagh, Reference Liu and Mernagh1990; Merlini et al., Reference Merlini, Crichton, Chantel, Guignard and Poli2014). Fast and sluggish transformation from CaCO3-IIIb to CaCO3-III was observed in Cal-E under 1.98 GPa, and in Cal-A and C after the samples had been preserved under 3.38 GPa for 72 h, respectively, whereas all CaCO3-III samples remained unchanged. Therefore, it can be confirmed that CaCO3-IIIb is an intermediate metastable phase during the transformation from CaCO3-II to CaCO3-III. Development of massive cracks or forced twining can be recognised visually during the transformations from CaCO3-II or CaCO3-IIIb to CaCO3-III (Figs 4a–e) for all samples, which is contradictory to the transformations from CaCO3-II to CaCO3-IIIb and from CaCO3-IIIb back to calcite, where the CaCO3 sample remained as a monocrystal (Figs 4c–f). Moreover, transformations from CaCO3-II to simultaneous CaCO3-IIIb and CaCO3-III and IIIb occurred in the same sample, with CaCO3-IIIb being observed within the flawless corner and CaCO3-III and IIIb in the rest of the areas (Figs 4c–e). These results suggest that it is the crystal defects or micro-cracks within the CaCO3 samples, instead of the pressure-time pathway, that is the key factor controlling the transformation from CaCO3-II to CaCO3-III or to CaCO3-IIIb.
Implication for structure changes in CaCO3 phase transitions
For mineral samples, changes in the Raman vibrational modes are generally associated with transformation in the crystal structures. For instance, reduction in CaSO4 crystal symmetry during the phase transition from orthorhombic anhydrite to high-pressure monoclinic anhydrite results in appearance of new lattice vibrations and additional splitting of the S–O bending (ν 2 and ν 4) and asymmetric stretching (ν 3) vibrations (Ma et al., Reference Ma, Zhou, He, Li, Yang, Cui and Zou2007). Analogously, during the phase transition from calcite to CaCO3-II, splitting of the ν 4 Raman band into two (713 and 720 cm–1) and appearance of new lattice vibrations at 130, 163, 202, 226 and 239 cm–1 were observed (Figs 2 and 3), which corresponded to the reduction in the CaCO3 crystal symmetry from R  $\bar{3}$c to P21/m, as accomplished by rotations of the CO32− groups by 11° and displacements of the Ca2+ cations (Merrill and Bassett, Reference Merrill and Bassett1975).
For the transformation from CaCO3-II to CaCO3-III and CaCO3-IIIb, new lattice vibrations and splitting of the ν 1 and ν 4 vibrations were observed (Figs 2 and 5), indicating the CaCO3-III and CaCO3-IIIb crystal structures are more complicated and less symmetrical than the monoclinic structure of CaCO3-II. This is consistent with the latest results, where both structures were determined to be triclinic (P  $\bar{1}$) using high-resolution synchrotron single-crystal X-ray diffraction (Merlini et al., Reference Merlini, Hanfland and Crichton2012; Pippinger et al., Reference Pippinger, Miletich, Merlini, Lotti, Schouwink, Yagi, Crichton and Hanfland2015). Moreover, relative to the Raman bands of CaCO3-IIIb, additional split peaks were observed in the ν 1 and ν 4 vibrations of CaCO3-III, indicating the C–O vibrations in CaCO3-III were influenced from other nearby atoms. This is also consistent with the CaCO3-III and CaCO3-IIIb crystal structures having ten and four formula units in the primitive unit cell, respectively, with CaCO3-IIIb having a triclinic structure but a psedomonoclinic symmetry (Merlini et al., Reference Merlini, Hanfland and Crichton2012, Reference Merlini, Crichton, Chantel, Guignard and Poli2014; Pippinger et al., Reference Pippinger, Miletich, Merlini, Lotti, Schouwink, Yagi, Crichton and Hanfland2015).
Acknowledgments
This work is supported by National Natural Science Foundation of China (NSFC, No. 41702039). The authors are grateful to Dr. Ying Cui from the School of Earth and Space Sciences, Peking University for her technical support during the Raman spectroscopic measurement.