Implications
Production of entire male pigs corresponds well with the welfare principles of organic farming. Welfare of entire males might be influenced by management procedures in relation to grouping of animals, affecting the social organisation of pigs. The present study revealed no clear management recommendations on grouping strategy when rearing entire males in the organic farming system, as levels of skin lesions did not differ in different social mixing strategies and results showed inconsistent results on mounting behaviour across herds.
Introduction
Surgical castration of pigs is a routine procedure in many countries, not least in Denmark, where currently >10 million male pigs are surgically castrated each year. The castration procedure causes stress and pain (Prunier et al., Reference Prunier, Bonneau, von Borell, Cinotti, Gunn, Fredriksen, Giersing, Morton, Tuyttens and Velarde2006) with decreased animal welfare as a result. As regards the organic production system, castration further conflicts with the ethical values concerning animal integrity (Verhoog et al., Reference Verhoog, Lund and Alrøe2004). In Denmark, legislation on the castration procedure prescribes the use of an analgesic before the surgical intervention (since 2009). However, even with the use of analgesia, welfare issues related to the procedure are still present (Prunier et al., Reference Prunier, Bonneau, von Borell, Cinotti, Gunn, Fredriksen, Giersing, Morton, Tuyttens and Velarde2006; von Borell et al., Reference von Borell, Baumgartner, Giersing, Jäggin, Prunier, Tuyttens and Edwards2009). The castration procedure is also time consuming, not least within the organic farming system where sows farrow in outdoor paddocks. Based on these considerations, alternatives to surgical castration are needed. One alternative, which is in accordance with the values in organic farming, is production of entire male pigs. However, different welfare issues associated with this production method are reported, due to the behaviour of entire males caused by the hormonal changes during sexual maturation. The main effects reported are increased aggression of entire males compared with castrated males and females, as well as increased mounting behaviour (Rydhmer et al., Reference Rydhmer, Hansson, Lundström, Brunius and Andersson2006; Boyle and Björklund, Reference Boyle and Björklund2007; Fredriksen et al., Reference Fredriksen, Lium, Marka, Mosveen and Nafstad2008). Elevated aggression levels can adversely affect the welfare of the animals by generating negative feelings such as fear, exhaustion or pain. As regards mounting behaviour, frequent mounting is suggested to increase the risk of leg problems and skin lesions (Rydhmer et al., Reference Rydhmer, Hansson, Lundström, Brunius and Andersson2006). The behaviour induces high pitch vocalisations from the mounted pig (Hintze et al., Reference Hintze, Desiree, Turner and Meddle2013), indicative of feelings of discomfort. Furthermore, frequent mounting behaviour causes a high level of disturbance among all animals of a group (Rydhmer et al., Reference Rydhmer, Hansson, Lundström, Brunius and Andersson2006), possibly reducing animal welfare.
The growing/finishing stage of slaughter pigs is normally from 30 kg until slaughter at around 110 kg (in Denmark). A gradual development of adverse behaviours over this period is expected as more animals reach the time of puberty. In this regard it is hypothesised that the amount of mounting behaviour will increase with increased weight and age of the animals as maturation occurs. As regards skin lesions, the amount should be high in newly mixed animals when formation of a hierarchy is ongoing and should decrease as the social stability of the group is attained. A second increase in lesions can then arise when the pigs reach puberty (Fredriksen et al., Reference Fredriksen, Lium, Marka, Mosveen and Nafstad2008).
In order to be able to produce entire male pigs, without compromised animal welfare, changes in the production system and management strategies might be a necessity. The organic farming system offers more available space, access to rooting material and roughage as well as access to an outdoor run for pigs in the growing/finishing stage. This could contribute to a reduction of the unwanted behaviours of entire males. Still, the management procedures might be expected to have an impact. A normal management procedure within both conventional and organic pig production is regrouping, involving mixing of unfamiliar pigs, to optimise pen utilisation and minimise weight variation within groups. It is known from studies of conventionally raised pigs that mixing of unfamiliar pigs affects the social organisation of a group, causing increased aggression levels with detrimental effects on animal welfare (Giersing et al., Reference Giersing, Lundstrom and Andersson2000; Li and Wang, Reference Li and Wang2011). For entire male pigs, such a procedure could have an even greater impact due to their increased aggression level. Rydhmer et al. (Reference Rydhmer, Zamaratskaia, Andersson, Algers, Guillemet and Lundström2013) found that entire males reared in stable groups showed less aggression and had fewer lesions compared with unfamiliar pigs in mixed groups. This is in agreement with Fàbrega et al. (Reference Fàbrega, Puigvert, Soler, Tibau and Dalmau2013), who also found more skin lesions in mixed groups compared with stable wean-to-finish groups. In this study, all pigs had been able to socialise with other litters before weaning, which was also the case for the unmixed group in the study by Rydhmer et al. (Reference Rydhmer, Zamaratskaia, Andersson, Algers, Guillemet and Lundström2013).
In line with this, D’Eath (Reference D’Eath2005) reported that socialising piglets before weaning improved the social skills of the piglets with beneficial effects during future encounters with unfamiliar pigs, possibly lowering the amount of fighting. As regards mounting behaviour, Rydhmer et al. (Reference Rydhmer, Zamaratskaia, Andersson, Algers, Guillemet and Lundström2013) found more mounting in the intact groups at start and end of the study, whereas Fàbrega et al. (Reference Fàbrega, Puigvert, Soler, Tibau and Dalmau2013) found no effect on mounting behaviour in a stable wean-to-finish system compared with mixed groups.
It is hypothesised that regrouping of entire male pigs compared with simple relocation at transition into the finishing accommodation (approximately at 30 kg) will negatively affect animal welfare measured as skin lesions. Moreover, regrouping is hypothesised to increase the level of mounting behaviour, due to advanced sexual maturation in mixed groups of pigs, as suggested by Fredriksen et al. (Reference Fredriksen, Lium, Marka, Mosveen and Nafstad2008). Following formation of a new group, a dominance hierarchy is established to give social stability and minimise costly aggressive interactions (Turner and Edwards, Reference Turner, Farnworth, White, Brotherstone, Mendl, Knap, Penny and Lawrence2004). It is hypothesised that procedures that influence the social stability (e.g. regrouping) will have a larger negative effect in small groups compared with large groups (when comparing group sizes of 15 and 30 animals). The overall aim was to investigate management approaches in relation to welfare of organic entire male pigs, focussing on the effect of social mixing and group size on levels of mounting behaviour and skin lesions.
Material and methods
Animals
The target population, consisting of 1603 organic entire male pigs of the breed (Landrace×Yorkshire)×Duroc, constituted a hypothetical population representing entire males reared within the organic pig production system in DK. Entire male pigs are not produced on a regular basis within Danish organic pig production. The pigs were reared in parallel in five Danish commercial organic pig herds.
During the study, 248 pigs were excluded due to disease, death, deviations from study design, missing registrations and early slaughter.
Housing system
This study is part of a larger study on organic entire male pigs, with a thorough description of housing system and study design to be found in Thomsen et al. (Reference Thomsen, Edwards, Jensen, Rousing and Sørensen2014a and Reference Thomsen, Edwards, Jensen, Rousing and Sørensen2014b). The pigs were reared according to the standard Danish organic production system, with an indoor area consisting of an activity area with solid and partially slatted floors and a resting area with straw bedding. Partitioning walls in the indoor area were present in three herds. All pens had access to an outdoor run with concrete floor and sprinkling system, either separated from the indoor area by solid walls or with no separation. The fixed facilities in the pens included automatic feeders or feeding troughs (2 to 7.5 animals/feeding place) including access to water by individual water nipples/stations. Concentrate feed was provided ad libitum. Roughage (clover/grass silage) was provided daily in the resting area.
Space allowance in the pens varied slightly between herds, but the stocking density was similar between small and large group sizes, with ~1.2 m2/pig on the indoor area and ~1 m2/pig on the outdoor area.
Study design
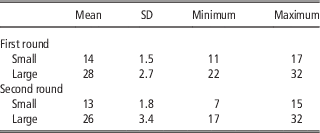
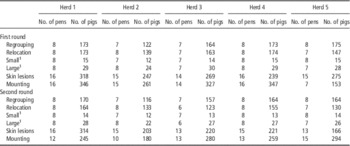
The experimental study was designed as a 2×2 factorial, stratified by social mixing (consisting of regrouping v. simply relocation) and group size (~15 v. 30 animals), with parallel groups between and within five organic herds. Each herd produced four batches, each consisting of four experimental pens of entire male pigs. The study encompassed a 2-year period from 2011 to 2013, with two batches in the winter season and two in the summer season. The winter season encompassed birth of piglets in July to September and slaughter in January to March and the summer season birth in January to March and slaughter in June to August. All male pigs were born outdoors, with the possibility to familiarise with other litters in neighbouring paddocks. At weaning all pigs were mixed with different litters and located in pens resembling the rearing system normally used in the respective herds (in pens mixed with female pigs (herd 1 (60 pigs/pen), herd 3 (one pen, 60 pigs/pen) and herd 5 (60 pigs/pen)) or in single-sex pens (herd 2 (25 pigs/pen), herd 3 (one pen, 60 pigs/pen) and herd 4 (30 pigs/pen)). At an average weight of 30 kg, ~5 weeks after weaning, the male pigs were allocated to the finishing pens according to the experimental design. The pigs stayed in the experimental pens until slaughter. The experimental design comprised two pens of regrouped pigs, with pigs being mixed from two different weaning pens, and two pens of relocated pigs, with pigs coming from only one weaning pen and simply being relocated into the experimental pens (social mixing treatment). Besides this, two different group sizes were applied, with each social mixing treatment having one pen of ~15 pigs and one pen of 30 pigs (group size treatment). Herd 2 had group sizes of 11/12 and 25 animals due to smaller pen sizes. Animals were removed from the pens in case of disease, death or early slaughter due to high weight, which gave smaller variations in the group sizes (Table 1). In addition, four pens were excluded, caused by deviations from the study design, for example, animals not grouped according to experimental plan (Table 2). All measures (mounting, skin lesions and other clinical assessments) were performed at two registration points during the experimental period. The first registration round was performed a week after insertion into experimental pens, and the second within a week before first slaughter occasion.
Mean, SD, minimum and maximum number of animals in the two group sizes ‘small’ and ‘large’ for each of the two registration rounds

Number of pens and number of pigs for each treatment (grouping strategy and group size) and each measurement (skin lesions and mounting) stratified for registration round 1 and 2 and each of five herds (herds 1 to 5)

1 Mean number of pigs for small and large group size.
Measurements
Mounting behaviour
Mounting events were registered at pen level, using continuous behaviour recording within a 4-h registration period (Martin and Bateson, Reference Martin and Bateson1993). Mounting behaviour was defined as a mounting pig jumping on the back or front of another pig with one front leg on either side of the other pigs’ back, with the recipient animal either standing or lying (definition after Cronin et al., Reference Cronin, Dunshea, Butler, McCauley, Barnett and Hemsworth2003). Separation of two successive mounting events was defined by the front legs of the mounting pig touching the ground for more than 2 s. Observations of mounting behaviour were made from simultaneous video recordings of each of the four pens in each batch in each of the five herds. Recordings only covered the indoor area of the pens. Registrations of behaviour were preferentially placed in a period covering the morning hours. Number of pens and pigs recorded for each registration round for each herd can be seen in Table 2. Pens not recorded were mainly due to problems with the video equipment (19 pens in total), and pens deviating from the study design (four pens in total). Observations from video recordings were performed by one observer. Intra-observer reliability was calculated by a weighted Cohen’s κ-coefficient (Cohen, Reference Cohen1960; Kundel and Polansky, Reference Jørgensen and Labouriau2003). To be able to perform a calculation of a κ-coefficient, data were reorganised. The 4-h registration period were divided into series of time intervals of 3 min and the number of mountings performed within each of these intervals was counted, based on the specific time point for execution of the mounting event which was registered. For calculation of the coefficient the number of mountings within each time interval constituted a created scale ranging from 0 to the maximum number of mountings observed, and based on this the number of agreements and disagreements between two repeated observations of the same time period were used for calculation of the weighted κ-coefficient for each of four pens. The calculated κ-coefficient showed a generally high agreement (ranging from 0.43 to 0.99 for four different pens) and should be seen in the context of the calculation method and a varying quality of the video recordings.
Skin lesions
Clinical assessments were performed by assessing each individual pig in each of the four pens per batch in each of the five herds. The assessments were performed by two observers. Skin lesions were assessed by direct observation of each animal. The animal was divided into five body areas (head including neck, shoulder including forelegs, back, abdomen and rear part including hind legs), and for both left and right side of the pig the number of lesions in each area was counted. A lesion was defined as being visible at a distance of 1 m, being either surface penetration of the epidermis or actual wounds with penetration of muscle tissue, and including cuts, scratches and abrasions, both fresh (red) and old (black). When animals were very dirty (skin covered in a dense layer of manure), no counting of lesions was registered at the specific body area and the observation was set as missing. This was the case for 712 out of 13 580 observations at first registration round and 1546 out of 13 400 observations at second registration round (for five body areas assessed on both left and right side), resulting in four pens with no lesion score in the second round. The number of pens and animals with a total lesions score for the whole body can be seen in Table 2. Inter-observer reliability for assessment of skin lesions was determined as a high (>0.6) agreement (range of 0.87 to 0.94 for the five body areas) based on weighted κ calculations (Cohen, Reference Cohen1960; Kundel and Polansky, Reference Jørgensen and Labouriau2003).
Lameness and general debility
Lameness was assessed by two observers by direct observation of each animal in each of the four pens per batch in each of the five herds. All animals were encouraged to walk around the pen and lying animals were forced to stand and walk. Degree of lameness was scored as follows: 0, normal gait; 1, impairment of walking, but still using all four legs, shortened stride; 2, severely lame, minimum or no weight-bearing on the affected limb; 3, not able to walk (modified after Welfare Quality® Consortium, 2009).
General debility was assessed by direct observation of each animal based on both the vitality of the animal being 1: unaffected, 2: depressed, apathetic, hesitant to rise up, 3: languishing/dying, and the body condition assigned a score 1 for normal body condition, 2 for thin (with spine and hip bone just visible and able to feel with palm of hand) and 3 for very thin (with prominent and clearly visible spine, hip and pin bone).
Statistical analysis
Statistical analyses were performed using the statistical software R (R Core Team, 2013). Specifically, the packages lme4 (implementing generalised linear mixed models) and multicomp (for performing inference with contrasts) were used. The number of mounts recorded per pen (in a 4 h period) was modelled by a Poisson mixed model with a random component representing the pens and a number of fixed effects representing the herd (1 to 5), group size (small/large), social mixing (regrouping/relocation), season (summer/winter), registration round (1 to 2) and in some models higher-order interactions. As the number of animals per pen was not constant (varying from 7 to 32), the models included an offset defined by the logarithm of the number of animals per pen (n) and a logarithmic link was used so the models were multiplicative. That is, the model stated that
 $${\rm log}\,\left( {E(M_{{hsgtapr}} )} \right){\equals}\,{\rm log}\,(N_{{hsgtapr}} ){\plus}X_{{hsgtapr}} \beta {\plus}e_{p} $$
where M hsgtapr is a random variable representing the number of mounts for a pen at the hth herd, under the grouping size s, subject to the gth grouping system, at the season t, at the registration round (corresponding age group) a. N hsgtapr represents the number of animals in the given pen. The fixed effects are represented by the vector of parameters β where X hsgtapr is the associated set of discrete explanatory variables and the Gaussian random component is denoted by e p . This model is mathematically equivalent to
 $$E\left( {M_{{hsgtapr}} \,/\,N_{{hsgtapr}} } \right)\,{\equals}\,{\rm exp}\left( {X_{{hsgtapr}} \beta {\plus}e_{p} } \right)$$
which is a multiplicative mixed model for the number of mounts per animal in each pen (i.e. M hsgtapr /N hsgtapr . The fixed effects (and interactions) were tested using likelihood ratio tests (LRT) applied to suitably defined nested models. The P-values of the LRT were obtained using parametric bootstrap with 1000 bootstrap simulations (see Jørgensen and Labouriau, Reference Kundel and Polansky2012).
The mean number of lesions (mean per pen) was analysed using Gaussian linear mixed models, where the response was the logarithmic transformed sum of the total number of lesions per animal and including the logarithm of the number of animals with a registered lesion score per pen as an offset, in such a way that the response was the mean number of lesions per animal with a registered lesion score. The model included a random component representing the pens and a number of fixed effects representing the herd, group size, social mixing, season and registration round, and in some models higher-order interactions. The fixed effects (and interactions) were tested using LRT applied to suitably defined nested models. The P-values of the LRT were obtained using parametric bootstrap with 1000 bootstrap simulations. The P-values reported are adjusted for multiple comparisons by the method of false discovery rates (see Benjamini and Yekutieli, Reference Benjamini and Yekutieli2001). Initially, a model containing the main effects of factors representing the herd, group size, social mixing, season, registration round and all the possible third-order interactions was adjusted and compared via LRT with an additive model containing only the main effects. This test yielded a P-value of 0.87. Subsequently, the removal of each of the fixed effects was tested. To analyse for association between skin lesions for each of the five body areas and amount of mounting per number of animals in each pen, Spearman’s correlation coefficients were calculated, with the statistical unit being the pen. These calculations were done separately for each of the two registration rounds.
Results
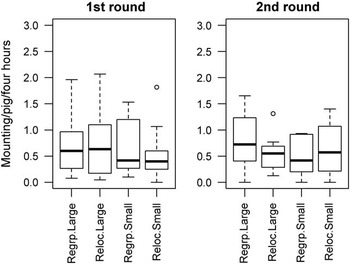
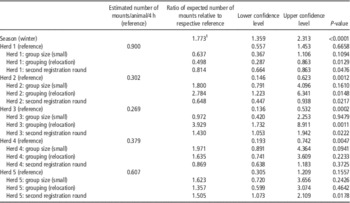
Average weight and age for each of the two registration rounds were as follows: first: 37.5±13 kg and 92±9 days, second: 94±19 kg and 150±8 days. Levels of mounting behaviour for the different treatments in the 2×2 factorial design can be seen in Figure 1. Analysis of mounting showed no interaction of social mixing and group size (the P-value for reduction of a model with all the second-order interactions to this model was 0.64) and in addition, no main effect of group size or regrouping was detected. The analysis, however, revealed the presence of significant interactions between herd and social mixing, herd and registration round, as well as a tendency for herd and group size, with no consistent pattern between herds (Table 3). In addition, a direct significant effect of season was found on level of mounting, with more mountings during winter. All significant effects in the model had P-values smaller than 0.001 (adjusted for multiple comparisons by the method of the false discovery rate).
Level of mounting per pig per 4 h for grouping strategy (regrouping, relocation)×group size (large, small) for each of two registration rounds. The length of the box represents the interquartile range, the horizontal line in the box interior represents the median and the vertical lines issuing from the box extend to the minimum and maximum values of the mounting variable on pen level. The small circles represent outliers (extreme values).

Estimated number of mounts per animal in each of five herds for the reference category summer period, group size large, regrouping and first registration round for significant variables and, in addition, ratio between the expected number of mounts in each category of the variables group size, grouping strategy and registration round, stratified for each herd

The lower and upper limits of an asymptotic confidence interval (with 95% coverage) and P-values of asymptotic Wald’s tests for equality of the respective variables are given.
1 Numbers below 1 indicate a higher level in the reference category (e.g. summer, group size large, regrouping and first registration round) and the opposite for numbers above 1.
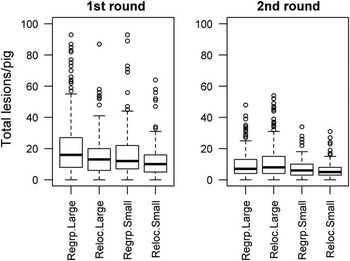
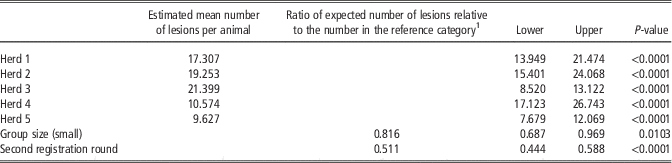
The total number of skin lesions (sum of all body parts) for the different treatments in the 2×2 factorial design can be seen in Figure 2. Neither the effects of an interaction of grouping and group size nor the main effects of social mixing and season on the mean number of lesions were found to be statistically significant. Group size significantly affected the mean number of lesions (P<0.036), with more lesions in large groups compared with small groups. In addition, the mean number of lesions significantly differed between registration rounds, with more lesions in the first registration round compared with second round (P<0.0001). Herd significantly affected the mean number of lesions (P<0.0001). Results are summarised in Table 4.
Total number of skin lesions per pig for grouping strategy (regrouping, relocation)×group size (large, small) for each of two registration rounds. The length of the box represents the interquartile range, the horizontal line in the box interior represents the median and the vertical lines issuing from the box extend to the minimum and maximum values of the skin lesion variable on pig level. The small circles represent outliers (extreme values).

Estimated mean number of lesions per animal in each herd for the reference category group size large and first registration round for tested variables and the ratio between the expected number of lesions relative to the number in the reference category for each significant variable in the log normal model

The lower and upper limits of an asymptotic confidence interval (with 95% coverage) and the P-values of asymptotic Wald’s tests for equality of the respective variables are given.
1 Numbers below 1 indicate a higher level in the reference category (e.g. group size large and first registration round).
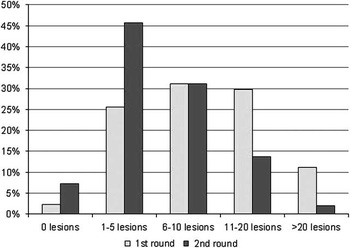
The distribution of animals according to number of lesions on the front area showed a different pattern between registration rounds, with more animals with zero lesions in the second round compared with the first round and most animals with at least 11 lesions in the first round compared with the second round. The majority of animals in the second round had 1 to 5 lesions, in contrast to a spread between 1 and 20 lesions for the first round (Figure 3). The number of skin lesions on the different body areas did not correlate with number of mountings performed in the pens in either of the two registration rounds.
Percentage of animals according to number of lesions on the front part of the body (head and shoulder) for first and second registration round. Number of lesions are divided into five categories; 0, 1 to 5, 6 to 10, 11 to 20, >20.

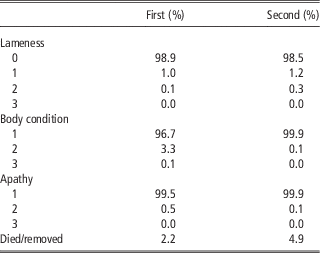
The number of animals being lame, having a low body condition or being apathetic was very low and statistical comparison between groups could not be performed. Descriptive analysis showed no major difference between herds or grouping treatments. Differences between registration rounds were only seen for body condition score, with more animals being thin (score 1) at first round compared with second round (Table 5). From the farmers own registrations only four animals were removed due to lameness and 31 animals were registered with too low a weight to be included in the planned slaughter rounds and were therefore excluded from the study.
Percentage of animals for each score of lameness, body condition, apathy and died/removed animals for each of two registration rounds (first and second)

Discussion
In the present study, two different social mixing strategies were investigated, regrouping and relocation, with the hypothesis that social mixing would have a different effect in small v. large group size. This was not confirmed, as an interaction of social mixing and group size did not show a significant effect on the mean number of lesions or on frequency of mountings within pens. In the present study, all pigs were mixed at weaning and, for the group exposed to regrouping, a second mixing was performed at insertion into the finishing accommodation. It was hypothesised that a second mixing, compared with being only relocated, would increase the mounting level. This could, however, only partly be confirmed, as no consistent effect of social mixing on mounting level were found, with more mounting in groups of relocation compared with regrouping in some herds and the opposite in other herds. In the present study, the level of skin lesions was assumed to reflect the aggression level among pigs, as described by Turner et al. (Reference Turner, Horgan and Edwards2006). It was hypothesised that mixing would affect the level of skin lesions 1 week after, but this was not confirmed, as the mean number of lesions surprisingly did not differ between the two social mixing strategies. Results from previous studies have also reported different effects of group management on behaviour and welfare of entire males. Fàbrega et al. (Reference Fàbrega, Puigvert, Soler, Tibau and Dalmau2013) found no significant effect of previous mixing on behaviour (both aggressive and mounting behaviour), but did find a difference in skin lesions between groups which were mixed at weaning and at insertion into fattening pens and groups being socialised before weaning and then reared without mixing from weaning to finish, when these were measured in the days just after mixing. Rydhmer et al. (Reference Rydhmer, Zamaratskaia, Andersson, Algers, Guillemet and Lundström2013) found that entire males reared in intact groups and being socialised before weaning showed less aggression, had fewer skin lesions, but higher levels of mounting (at start and end of the study) compared with unfamiliar pigs in groups mixed at insertion into fattening pens. Fredriksen et al. (Reference Fredriksen, Lium, Marka, Mosveen and Nafstad2008) found a difference in aggression level and skin lesion score between groups of entire males and female pigs submitted to one social mixing (mixed one time at ~25 kg at weaning) compared with those in farrow-to-finish pens. They found no effect on mounting behaviour. In the present study, all pigs were able to socialise with piglets from other litters in the period before weaning, which could account for the absence of effect of the different social mixing strategies on skin lesions. Socialising piglets has been found to modify the behavioural responses of piglets by improving their social skills with beneficial effects in later stages of the production as, for instance, during regrouping (D’Eath, Reference D’Eath2005). Weight variation between animals within a group has been found to decrease the aggression level post regrouping, probably due to an improved ability to assess the relative strength of opponent pigs (Andersen et al., Reference Andersen, Andenæs, Bøe, Jensen and Bakken2000). In the present study, there was a large variation in BW within pens that, on some occasions, spanned >20 kg difference. This could also have contributed to the absence of an effect of social mixing on mean number of skin lesions within pens. In addition, when removing animals from a group of pigs, as done in the relocation groups of the present study, the remaining animals may need to establish a new dominance hierarchy, which will increase the aggression level (Coutellier et al., Reference Coutellier, Arnould, Boissy, Orgeur, Prunier, Veissier and Meunier-Salaün2007), in the relocation groups equalising the effects of the social mixing strategy.
The overall mean level of lesions was higher in large groups compared with small groups, independent of the social mixing strategy. This is in accordance with findings by Spoolder et al. (Reference Spoolder, Edwards and Corning1999), who found more agonistic behaviour in large groups of entire male pigs. Contrary results have also been reported, with less aggression in large groups compared with small groups (Turner et al., Reference Turner and Edwards2001). An increased level of fighting could be assumed with more animals in a group, due to more relationships to be established (Spoolder et al., Reference Spoolder, Edwards and Corning1999) and with increasing number of unfamiliar pigs (Arey and Franklin, Reference Arey and Franklin1995). On the other hand, larger groups have a larger total area available, increasing the space for social interactions and avoidance of aggressors (Turner and Edwards, Reference Turner, Farnworth, White, Brotherstone, Mendl, Knap, Penny and Lawrence2004). In large groups (>50 animals) compared with smaller ones, it seems that the establishment of a new hierarchy depends less on aggression during the immediate post-mixing phase even though the reason for that phenomenon are not clear (Turner and Edwards, Reference Turner, Farnworth, White, Brotherstone, Mendl, Knap, Penny and Lawrence2004), and more lesions in a large group is not necessarily to be expected. A difference in social organisation might, however, require a larger group size than 30 animals, as this number still might enable the pigs to recognise each other, and to establish an ordinary dominance hierarchy in both group sizes. A confounding factor in the present study is a possible effect of number of feeding places, with this being equal between group sizes in four out of five herds, ranging from two to four pigs per feeder space in small groups and 4 to 7.5 in large groups. This could have caused more aggression in pens with more pigs sharing each feeding place, as was the case with the large size groups. Feed being a limited resource is often the cause of aggressive behaviour (Hagelsø Giersing and Studnitz, Reference Hagelsø Giersing and Studnitz1996), although with feed being available ad libitum in the present study, and with this number of feeding places not being considered inadequate (Spoolder et al., Reference Spoolder, Edwards and Corning1999), the effect of feeding places on mean number of skin lesions observed is likely to have been minimal.
Social mixing and group size affected mounting levels as an interaction effect with herd (group size only as a tendency), showing contradictory patterns for the different herds. The lack of unequivocal results on mounting could indicate that performance of this behaviour is rather sensitive to the environment in which the animals are held with different environmental factors on the different herds affecting the mounting level, for example, farm personnel entering the pens which increase the general activity of the animals and might affect the mounting level. Mounting behaviour has been suggested to cause skin lesions. The number of skin lesions on the different body areas did, however, not correlate with number of mountings performed in the pens. In agreement with this, Hintze et al. (Reference Hintze, Desiree, Turner and Meddle2013) did not find mounting to be associated with the occurrence of scratches. Rydhmer et al. (Reference Rydhmer, Hansson, Lundström, Brunius and Andersson2006) found no significant association between mounting and aggressive behaviour, but found a relationship between sexual behaviour and skin lesions, with mounting males having more scratches than pigs not involved in mounting. They even suggested that mounting rather than fighting caused the scratches observed, as no relationship was found between received aggression and frequency of scratches. However, the lack of correlation in the present study suggests that lesions cannot reliably be used as a proxy measure for the prevalence of mounting behaviour on a group level.
It was hypothesised that number of skin lesions would be high in newly mixed animals when formation of a hierarchy was ongoing and would then decrease as the social stability of the group was attained. This was confirmed, as the results showed more skin lesions in the first registration round compared with the second round. This was supported by results showing a higher percentage of animals with >11 lesions on the front part in the first round compared with the second round, where most animals had only 1 to 5 lesions. Formation of new groups (relocation and regrouping), and therefore the establishment of a dominance hierarchy, occurred shortly before the first registration round, resulting in increased levels of aggression and, in consequence, increased levels of skin lesions. The decreasing number of lesions with increasing age and weight in the present study could also be indicative of a general decrease in activity level with increasing age as found in other studies (Cronin et al., Reference Cronin, Dunshea, Butler, McCauley, Barnett and Hemsworth2003). It was hypothesised that the amount of mounting behaviour would increase with increased weight and age of the animals as maturation occurred. This could only partly be confirmed as the level of mounting differed between first and second registration round, however, with this being equivocal for different herds. This difference between herds could be attributed to a different time course of sexual maturation as discussed later.
Mean number of lesions did not differ between seasons. Prunier et al. (Reference Prunier, Brillouët, Merlot, Meunier-Salaün and Tallet2013) found fewer skin lesions in the spring than in autumn and attributed this to earlier puberty in the autumn. A seasonal effect was found on mounting level, with more mounting during the winter periods as compared with summer periods. This is in accordance with the study by Prunier et al. (Reference Prunier, Brillouët, Merlot, Meunier-Salaün and Tallet2013), who reported a tendency for more mountings during autumn compared with spring, in line with the suggested accelerated pubertal development of the animals during autumn. This effect may be caused by differences in photoperiod between seasons, which have been found to affect sexual maturation in this species that has evolved from a seasonal breeder (Andersson et al., Reference Andersson, Rydhmer, Lundstrom, Wallgren, Andersson and Forsberg1998).
A significant difference in mean number of lesions as well as mounting frequency was found between herds. This could be ascribed to differences in pen design as regards skin lesions. Partitioning walls have, in previous studies, been shown to reduce aggression levels (Barnett et al., Reference Barnett, Hemsworth, Cronin, Newman, McCallum and Chilton1992), as this provides an opportunity to escape an aggressor. Partitioning walls were present in herds 4 and 5, where the mean number of lesions was also smallest. Stocking density was adjusted to the different group sizes, and differences between herds were very small, leaving this as an unlikely cause of differences in skin lesions between herds. With mounting behaviour mostly being related to sexual behaviour, different rates of sexual maturation between animals in each herd could be postulated to affect the contradictory results between herds.
Conclusion
No interactive effects were found between social mixing and group size on either skin lesions or mounting frequency in entire male pigs produced under organic standards. Effects of social mixing and group size on mounting frequency were shown as interacting effects with herds, however, with no consistent pattern across all herds.
Whilst no effect of social mixing was found on mean number of skin lesions, this measure differed between group sizes, with more lesions in large groups. This could indicate that keeping entire male pigs in groups of 30 animals as compared with smaller groups of 15 may marginally decrease the welfare of these animals.
Herd differences were found for both mounting and skin lesions, suggesting effects of environmental factors on these behaviours. No association between skin lesions and mounting were revealed, showing that skin lesions cannot be reliably used as an indirect measure of riding behaviour.
Acknowledgements
The work was carried out under the project ‘Organic pig production without castration’, which is part of the Organic RDD programme. This is coordinated by International Centre for Research in Organic Food Systems and was funded by the Danish AgriFish Agency, Ministry of Food, Agriculture and Fisheries. The authors thank the participating farmers for their cooperation and technician Pia Haun Poulsen for help on data recording.