Introduction
Glucose is one of the main energy substrates for foetal metabolism (Battaglia and Meschia, Reference Battaglia and Meschia1978). The interaction between circulating maternal glucose concentration and glucose supply to the foetus(es) is an important factor regulating foetal growth and development. During late gestation, foetal nutrient supply usually becomes limited, as maternal feed intake often fails to meet the increasing energy requirements of the foetus(es). One of the main adaptive responses that occur during late gestation to meet this increased energy demand for glucose by the progeny is that the mother becomes progressively insulin resistant (Reynolds et al., Reference Reynolds, Ford and Ferrell1985). Hence, pregnancy can be considered to be a diabetogenic event (George et al., Reference George, England, Siers and Stanton1978), although it should be noted that the individual normally continues without apparent diabetes post partum (Kemp et al., Reference Kemp, Soede, Vesseur, Helmond, Spoorenberg and Frankena1996). Naturally occurring diabetes mellitus per se has not been recorded in the pig (George et al., Reference George, England, Siers and Stanton1978), yet there is considerable variation within sows in how individuals tolerate an intravenous load of glucose. Several porcine models of type 2 diabetes have been studied (Bellinger et al., Reference Bellinger, Merricks and Nichols2006); for example, two lines of Yucatan minipigs with altered glucose tolerance, one with impaired tolerance and the other with enhanced tolerance, have been described (Phillips et al., Reference Phillips, Panepinto, Spangler and Westmoreland1982; Phillips and Panepinto, Reference Phillips and Panepinto1986). Moreover, it has been proposed that poor glucose tolerance may be an under-researched contributory factor in the high (10% to 20%) pre-weaning mortality rate observed in pigs (Edwards, Reference Edwards2002).
Insulin resistance commences at around week 12 of 16.5 weeks of gestation in the sow (Pere et al., Reference Pere, Etienne and Dourmad2000), although there are conflicting reports in the literature about the extent to which insulin resistance is modulated by maternal diet. For example, it has been demonstrated that feeding a low plane of nutrition throughout pregnancy to sows results in an elevated maternal glucose concentration (basal and postprandial), yet total litter weight is reduced (Pere et al., Reference Pere, Etienne and Dourmad2000). In contrast, others have demonstrated that pregnant sows fed 100% of their maintenance requirements also exhibit reduced glucose tolerance but produce heavier litters (Anderson et al., Reference Anderson, Elsley, McDonald and MacPherson1971; George et al., Reference George, England, Siers and Stanton1978) with greater piglet mortality (Kemp et al., Reference Kemp, Soede, Vesseur, Helmond, Spoorenberg and Frankena1996).
Anderson et al. (Reference Anderson, Elsley, McDonald and MacPherson1971) reported a positive relationship between basal glucose and average piglet birth weight and gestational length. Others have shown a positive correlation between pig mortality and glucose curve characteristics following a glucose tolerance test (GTT), such as maximum increase in glucose, area under the curve (AUC) and glucose clearance kinetics (Kemp et al., Reference Kemp, Soede, Vesseur, Helmond, Spoorenberg and Frankena1996). These authors suggested that low basal glucose may be associated with poor glucose tolerance in sows during late gestation, increased gestational length and a heavier total litter weight.
The addition of fats to the maternal diet during pregnancy as a means of reducing piglet mortality continues to be investigated (Kasser et al., Reference Kasser, Coffery, Seerley and Martin1981; Pettigrew, Reference Pettigrew1981; Averette et al., Reference Averette, Odle, Monaco and Donovan1999; Laws, 2006). To date, little attention has been directed towards advancing our knowledge on the underlying maternal metabolic adaptations, particularly with respect to glucose metabolism of the sow, and the consequences for her developing offspring. Dietary fat has been shown to alter postprandial maternal glucose metabolism in the pregnant sow (Steele and McMurtry, Reference Steele and McMurtry1985; Kasser et al., Reference Kasser, Coffery, Seerley and Martin1981); but it remains to be established whether glucose tolerance is influenced by the type or timing of maternal dietary supplementation. The aim of the present study was to determine the effects of supplementing the maternal diet with dietary oils with different characteristic fatty acid compositions, either during the first half or the second half of pregnancy on the glucose tolerance of the sow, and the consequences for her offspring.
Material and methods
Animals and diet
All animals used in these studies were maintained at the Pig Research and Development Unit (Wye Campus), Imperial College, London. Experimental procedures were carried out according to the regulations of the Animals (Scientific Procedures) Act, 1986 and were licensed by the Home Office (UK). At all stages of life, animals were kept within the guidelines set out by the Department for Environment, Food and Rural Affairs (DEFRA, 2003).
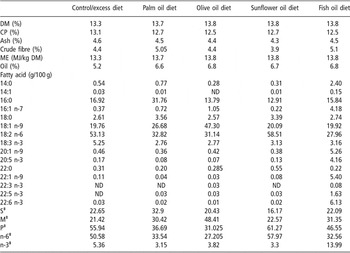
Eighty-eight commercial (meat-producing), hybrid sows (25% Meishan, 12.5% Duroc and 62.5% Large White × Landrace) were artificially inseminated with pooled Large White semen (P17 2006; JSR Genetics, Southburn, Driffield, East Yorkshire, UK). Treatment groups were matched for parity (3.5 ± 0.41) and weight (211 ± 7.6 kg). Sows were randomly selected to be fed the supplemented diet either during the first 60 days of pregnancy (G1: n = 40) or for 60 days prior to farrowing (G2: n = 40). Within each G1 and G2 group, the sows were further allocated to dietary treatment groups. A control (C: n = 5) group fed the standard pig pellets (ABN HE Sow Pellets, 13.1 MJ/kg; ABN, Peterborough, UK) was included. During the designated dietary experimental period, the remaining sows (n = 80) received standard pig pellets plus 10% energy derived from either (i) excess of the standard diet (E: n = 16); (ii) palm oil (P: n = 16); (iii) olive oil (O: n = 16); (iv) sunflower oil (S: n = 16); or (v) fish (salmon) oil (F: n = 16). All experimental diets were isocaloric and, during the non-experimental period, all sows received the standard diet only (Table 1). These oils were chosen due to differences in their composition of fatty acids. Palm oil is high in saturated fats, particularly palmitic (16:0) acid, and also contains a high percentage of oleic acid (18:1 n-9) and linoleic acid (19:2 n-6). Olive oil largely consists of monounsaturated fatty acids (e.g. oleic acid) whereas sunflower oil is high in polyunsaturated fatty acids (e.g. linoleic acid). Fish oil is rich in both mono-unsaturated and polyunsaturated fatty acids (e.g. oleic, palmitic, docosahexaenoic acid (22:6 n-3). Sows were allowed to give birth naturally at term. Litter size (live, dead and mummified) and individual piglet body weights were recorded.
Composition of diets†

Values presented are mean percentages from two determinations of total lipid fraction extracted from samples of diet.
†Abbreviations are: DM = dry matter; CP = crude protein; ME = metabolisable energy; ND = none detected. Values presented are mean percentages of total lipid fraction.
‡S = total saturated fatty acids; M = total monounsaturated fatty acids; P = total polyunsaturated fatty acids; n-6 = total n-6 polyunsaturated fatty acids; n-3 = total n-3 polyunsaturated fatty acids.
On days 0, 35, 56, 84 and 109 of gestation, sows were restrained in a weigh crate whilst their body weight and ultrasonic measurements of backfat thickness (Aloka-echo camera 550–500; Aloka Ltd, Osaka, Japan) were recorded. Backfat thickness was measured, level with the head of the last rib, at the P1 (45 mm from the midline) and P3 (80 mm from the midline) positions. The average of these two values was subsequently calculated to give the P2 value. Crown-to-rump length was also recorded on day 109 of gestation to allow the sows’ ponderal index to be calculated (kg/m3).
A GTT was performed on day 108.8 ± 0.5 of gestation. Animals were fed their usual dietary regime two hours prior to catheterisation. Throughout the test period the pigs had unlimited access to water. A catheter (Optiva 2; Johnson and Johnson, Ascot, Berkshire, UK) was placed into either the central ear vein or the lateral ear vein of both ears (Kingsbury, 1992), one of which was used for repeated blood sampling and the other for the infusion of glucose. The catheter was filled with sterile saline containing 0.2 mg/ml crystapen and 250 IU/ml heparin, which was reduced to 50 IU/ml during the sampling period. Care was taken not to inject heparinised saline into the animal. Once the catheter was inserted the animal was rested for a minimum period of 2 h.
After this rest period, a basal blood sample (−10 min) was collected from the catheter and a drop of blood was placed on a test sensor for blood glucose evaluation using a portable glucometer Esprit (Bayer, Newbury, Berkshire, UK). The remainder of the sample was transferred into an EDTA (ethylenediaminetetraacetic acid) tube and placed in iced water. Samples were centrifuged at 1600 × g for 15 min at 4°C and the plasma was stored at −20°C until subsequent analyses. A further basal sample was taken 5 min later (i.e. −5 min); glucose was administered only if both the samples were within the reference range (3 to 6 mM). This ensured that the animal’s blood glucose was stable prior to the procedure. Once the basal glucose concentration was established, a bolus injection of 0.5 g/kg body weight glucose (40% Dextrose; Arnolds, Shrewsbury, Shropshire, UK) was slowly administered to each sow via the second catheter within a 5-min period (Guan et al., Reference Guan, Matte, Ku, Snow and Burton2000). The actual time taken to administer the glucose bolus was recorded (312 ± 36 s). Further samples were collected 5, 10, 15, 20, 25, 30, 40, 50, 60, 75 and 90 min post administration and processed as described above. Of the 88 sows that were included in the study, 71 successfully completed the GTT (C, n = 5: For G1: E, n = 4; P, n = 7; O, n = 7; S, n = 8; F, n = 6: For G2: E, n = 6; P, n = 7; O, n = 5; S, n = 8; F, n = 8). It was not possible to complete a GTT on the remaining seventeen sows due to either a failure to maintain the catheter in situ or patency, and so data from these animals have been excluded from all statistical analyses.
Laboratory analysis
Plasma insulin concentrations were analysed using a radioimmunoassy (ICN 07-260102; MP Biomedicals, High Wycombe, Buckinghamshire, UK) as previously described by Mostyn et al. (Reference Mostyn, Litten, Perkins, Euden, Corson, Symonds and Clarke2004). The standard curve was linear within the range of standards provided, and the inter- and intra-assay coefficients of variation were 4.3% and 5.8%, respectively.
Statistical analysis
The trapezoidal method was used to calculate the area under the glucose curve (AUC: EasyPlot for Windows, Version 4.0.4, Spiral Software). ‘Glucose curve’ characteristics were defined by the following parameters. Peak glucose was described as the highest concentration of blood glucose recorded. Maximum increase in blood glucose was calculated by subtracting basal blood glucose concentration from peak glucose. The adjusted AUC (AAUC) was calculated after pre-test blood glucose concentrations were subtracted from the subsequent blood glucose concentrations. Glucose clearance rate (K) was determined using the following equation: K = (((ln SG1 − ln SG2)/time2 − time1) × 100); where SG1 and SG2 represent peak blood glucose concentration at time2 and basal blood glucose concentration at time1, respectively.
Statistical differences were assessed by the general linear model, by analysis of variance (ANOVA) with the main effects of dietary treatment and by time of treatment (Minitab version 13; Minitab Inc., State College, PA, USA). Parity, maternal body weight and backfat thickness at the start of the study were used as covariates in the model. The above model was used for maternal and backfat thickness measurements, with the addition of time and animal identification to correct for repeated measurements. Tukey simultaneous tests were used to make pairwise comparisons within the model. Unless otherwise stated, values are presented as least squares means ± s.e. Relationships between glucose curve characteristics and litter performance were assessed to determine whether glucose curve characteristics in late gestation were a reliable indicator of litter outcome. A three-step model building strategy described by Kemp et al. (Reference Kemp, Soede, Vesseur, Helmond, Spoorenberg and Frankena1996) was applied to our dataset. Initially, a simple linear regression was used to evaluate the relationship between glucose curve characteristics and litter performance. Predictors where P < 0.15 were chosen to decrease the likelihood of excluding variables that are each weakly associated with the outcome but may become an important predictor of the outcome when taken together in one model. In step 2, a multiple linear regression was applied with all predictors remaining from step 1 (P < 0.15) and in step 3 a stepwise multiple linear regression was applied to reduce the model (backward selection). Only those correlations where P < 0.05 have been discussed below.
Results
Sow performance
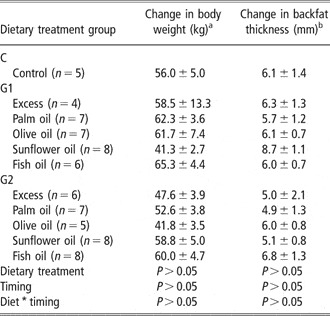
Parity (2.9 ± 0.3) and length of gestation (116 ± 0.5 days) were similar between treatment groups. As expected, there was an increase (P < 0.001) in maternal body weight and backfat thickness (data not shown) from conception to late gestation followed by a decrease (P < 0.001) in these parameters after the piglets were born. Although there was considerable variation in the changes in body weight and backfat thickness observed over the perinatal period, they did not appear to be influenced by the type or timing of diet (Table 2); however, it was of interest to note that the changes in body weight were influenced by the parity of the sow (P < 0.001).
Effect of supplementing the maternal diet with 10% extra energy derived from either excess of the standard diet or different dietary oils during either the first half (G1) or the second half (G2) of gestation on the change in body weight and backfat throughout gestation and the lactation

Values are presented mean ± s.e.
C = control (i.e. no dietary supplementation).
aChange in body weight from the beginning of pregnancy until day 110 of gestation.
bChange in backfat from the beginning of pregnancy until day 110 of gestation.
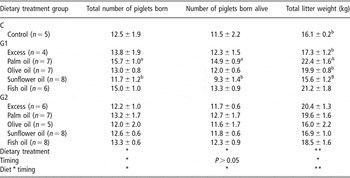
The timing of maternal dietary treatment had a significant influence (P < 0.05) on the total number of piglets born (i.e. litter size), with this dietary treatment effect being most prominent in G1 (Table 3). Supplementing the sow diet with palm oil during G1 appeared to result in larger litters (P < 0.05) and greater litter weight (P < 0.01), whereas litter size (P < 0.05) and consequently litter weight (P < 0.01) were reduced in the sunflower oil group. The differences in litter size can be attributed to variations in the number of piglets born alive (P = 0.089) rather than to mummified or stillborn animals, which were similar between the groups (data not shown). Neither the timing and type of dietary treatment nor the timing and diet interaction influenced the percentage of piglets born alive, dead or mummified (data not shown).
Effect of supplementing the maternal diet with 10% extra energy derived from either excess of the standard diet or different dietary oils during either during the first half (G1) or the second half (G2) of gestation on total number of piglets born, number born alive, dead and mummified

Values are presented as mean ± s.e.
C = control (i.e. no dietary supplementation).
Values within each column differ significantly abP < 0.05, ABP < 0.01.
Significant differences between dietary treatment and timing *P < 0.05 and **P < 0.01.
Maternal glucose tolerance
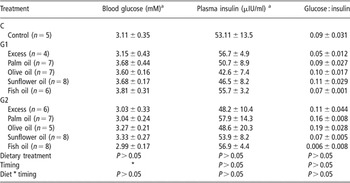
The type of dietary treatment per se had little influence on basal (i.e. pigs deprived of food for a minimum of 4 h) blood glucose and plasma insulin concentrations (Table 4), and hence on the glucose : insulin ratio. However, the timing of dietary supplementation had a pronounced effect on basal blood glucose concentration (P < 0.05). Basal blood glucose concentration was lower (P < 0.05) in the G2 groups compared to that seen in the G1 sows.
Effect of type and timing of maternal dietary supplementation with 10% extra energy derived from either excess of the control diet or different dietary oils during the first half (G1) or the second half (G2) of gestation on concentrations of basal blood glucose, basal plasma insulin and glucose : insulin following an i.v. glucose tolerance test (0.5 mg/kg body weight)

Values are presented as mean ± s.e.
C = Control (i.e. no dietary supplementation).
Significant differences between timing of dietary treatment *P < 0.05.
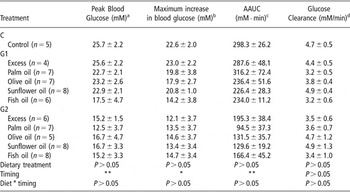
Following an i.v. glucose infusion (0.5 mg/kg), peak blood glucose, maximum increase in blood glucose, AUC (data not shown), AAUC and glucose clearance were similar between dietary treatment groups (Table 5). In contrast, the timing of dietary treatment appeared to have a pronounced influence (P < 0.01) on all of the aforementioned parameters except for glucose clearance. There was no correlation between basal glucose and either peak glucose, maximum increase in blood glucose, AUC, AAUC and glucose clearance.
Effect of type and timing of maternal dietary supplementation with 10% extra energy derived either from excess of the control diet or different dietary oils during either the first half (G1) or second half (G2) of gestation on peak blood glucose, maximum increase in glucose, adjusted area under the curve (AAUC) and glucose clearance following an i.v. glucose tolerance test (0.5 mg/ kg body weight)

Values are presented as mean ± s.e.
C = Control (i.e. no dietary supplementation).
aThe highest concentration of blood glucose.
bPeak glucose concentration minus the pretest basal glucose.
C Adjusted AUC (AAUC) were calculated after pretest values were subtracted.
dGlucose clearance rate (K) can be determined using the following equation where SG1 and SG2 = peak blood glucose at time2 and basal blood glucose at time1, respectively: K = (((ln SG1 − ln SG2)/time2 − time1) × 100).
Significant differences between timing of dietary treatment *P < 0.05 and **P < 0.01.
Correlations between maternal performance and glucose tolerance
As the results shown above indicate that the timing of dietary intervention has a greater influence on both maternal performance and glucose curve characteristics following a GGT, the correlations between these indices have been independently assessed.
Control group
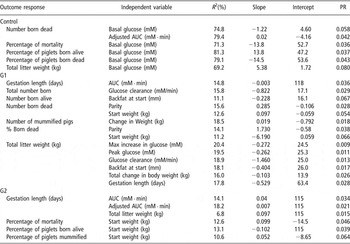
Basal glucose was positively associated (P < 0.05) with total litter weight and the percentage of piglets born alive but was negatively related to percentage of piglet mortality, percentage of born dead and the total number of piglets born dead (Table 6). A further correlation observed for the control group was between AAUC and the total number of piglets born dead (P < 0.05).
Correlations between litter outcome and maternal, and glucose curve characteristics following an i.v. glucose tolerance test (0.5 mg/kg body weight) in the control group and in those sows receiving 10% extra energy during the first (G1) or second (G2) half of gestation using one-way regression analyses

NS = non-significant (i.e. P > 0.15). AUC = area under the 90 min curve and AAUC = Adjusted area under the 90 min curve were calculated after pretest values were subtracted. PR = P value for regression. Glucose clearance rate (K) can be determined using the following equation where SG1 and SG2 = peak blood glucose at time2 and basal blood glucose at time1, respectively: K = (((ln SG1 − ln SG2)/time2 − time1) × 100).
G1 group
A negative relationship between the length of gestation and AUC (P < 0.05) was seen in the sows that were supplemented in G1 (Table 6). There was also a negative association between the total numbers of piglets born and glucose clearance (P < 0.05). It was of interest to note that the number of piglets born alive was negatively correlated with maternal backfat at the start of the study but not to any of the ‘glucose curve’ characteristics. Similarly, the total number of piglets born dead also appeared to be positively related to maternal parameters such as parity (P < 0.05) and weight at the start of pregnancy (P < 0.05), and these correlations remained when the data were expressed as a percentage of piglets born dead (P < 0.05). The total number of mummified piglets was positively associated with change in maternal body weight over the gestation period (P < 0.05). Total litter weight was related to both physical maternal factors, such as backfat at the start of pregnancy (P < 0.05) and the total change in maternal body weight in pregnancy (P < 0.05), and glucose curve characteristics including maximum increase in glucose concentration following an i.v. glucose infusion (P < 0.01), peak glucose (P < 0.05) and glucose clearance (P < 0.01). The final models to predict litter outcome in G1 are as follows:
(i) Total litter weight = 16.0−(1.07 × glucose clearance (mM/min)) + (1.02 × basal glucose (mM)) + (0.0128 × basal insulin (μIU/ml) − (20.8 × glucose : insulin ratio), where R 2 = 47.1% and P < 0.05.
(ii) Total litter weight = 28.4 − (1.19 × glucose clearance (mM/min)) + (0.22 × peak glucose (mM)) − (0.50 × max increase in glucose (mM)), where R 2 = 38.6% and P < 0.01.
(iii) Total litter weight = 21.3 + (0.0834 × change in maternal weight over gestation (kg)) − (0.416 × backfat measurement at the start of gestation (mm)), R 2 = 27.7% and P < 0.05.
(iv) Percentage born alive = 109 − (0.0706 × maternal weight at GTT (kg)) + (0.7038 × change in backfat over gestation (mm)), R 2 = 20.2% and P < 0.05.
(v) Percentage of piglet mortality = 3.26 − (1.28 × glucose clearance (mM/min)) + (2.40 × basal glucose (mM)), R 2 = 15.7% and P < 0.05.
Total litter weight could be predicted using several different equations combining both glucose curve and maternal physical characteristics. In contrast, the equations to estimate the percentage born alive and the percentage of piglet mortality included either physical or glucose curve characteristic but not both.
G2
As in the G1 groups, length of gestation in the G2 animals was related to the glucose AUC (P < 0.05) but no other relationships between litter outcome and glucose curve characteristics were observed (Table 6). Length of gestation was also associated with AAUC (P < 0.05) and total litter weight (P < 0.01). The percentage of mortality, percentage of piglets born alive and percentage of mummified piglets were all related to the start weight of the mother (P < 0.05). In the final model the following equations were constructed:
(i) The number of piglets born dead = 13.6 − (0.184 × gestational length (days)) + (0.0280 × maternal backfat at the start of gestation (mm)) − (0.0193 × maternal weight at the start of gestation (kg)), where R 2 = 51% and P < 0.005.
(ii) The percentage of piglets born alive = −138 + (2.05 × gestational length (days)) − (0.371 × backfat at the start of gestation (mm)) + (0.038 × maternal weight at the start of gestation (kg)), where R 2 = 35.8% and P < 0.05.
(iii) The percentage of piglets born dead = 93.2 − (1.25 × gestational length (days)) + (0.248 × maternal backfat at the start of gestation (mm)) − (0.11 × maternal weight at the start of gestation (kg)) + (20.2 × CRL at GTT (m)), where R 2 = 44.1% and P < 0.01.
Discussion
It has long puzzled animal scientists as to why sows of a similar genetic background receiving identical nutrition within the same management system produce piglets of differing birth weights both within the same litter and between litters. During gestation, the foetus is entirely dependent on the transfer of nutrients across the placenta, which will therefore influence their growth and development. An increased nutrient supply is likely to improve placental development during the early stages of pregnancy, and benefit foetal growth and development in the last half of pregnancy (Elsley et al., Reference Elsley, Bathurst, Bracewell, Cunningham, Dent, Dodsworth, MacPherson and Walker1971; Jean and Chiang, Reference Jean and Chiang1999).
Numerous physiological and metabolic adaptations of the mother take place throughout gestation, which alter nutrient partitioning to meet the increasing energy demands of the foetus(es), particularly during the latter stages of gestation. These adaptations can be further modified by maternal diet (Steele et al., Reference Steele, McMurtry and Rosebrough1985; Pere et al., Reference Pere, Etienne and Dourmad2000). The present study examined the effects of timing and type of maternal dietary supplementation, in particular with respect to dietary lipids, on maternal glucose tolerance in late gestation and neonatal outcome at birth. The principal findings are that the timing rather than type of dietary supplement has a more pronounced impact on maternal glucose tolerance and on neonatal outcome. In the interpretation of results, care must be taken as the dietary treatments used in the study can be prone to confounding of factors. Firstly, by adding oil to the diet, not only is the time of increased energy intake itself is a factor that influences glucose metabolism, but also the evolution of energy balance throughout gestation can be of major importance (e.g. modulation of leptin as an important trigger of insulin resistance). Secondly, the ‘excess’ treatment augments not only energy but also all other nutrients that are in the standard diet; adding oil not only increases the energy content but also changes the fatty acid profiles and energy source ratios. Finally, the commercial hybrid used in the current study was specifically developed by Cotswold Pig Development Company (Rothwell, Market Rasen, UK), and differs significantly from many of the commercial genotypes used throughout Europe and worldwide, and thus the results obtained may be unique to this specific hybrid.
Maternal diet and glucose tolerance
The data showed that sows had marked variation in glucose curve characteristics and is in accordance with the findings of other authors (Bunding et al., Reference Bunding, Davenport and Schooley1956; Kemp et al., Reference Kemp, Soede, Vesseur, Helmond, Spoorenberg and Frankena1996). This study also confirmed that pregnancy in sows has diabetogenic effects as shown by George et al. (Reference George, England, Siers and Stanton1978) and Schaefer et al. (Reference Schaefer, Tong, Sather, Beltranena, Pharazyn and Aherne1991). Pregnant sows have elevated basal glucose concentration, greater peak glucose concentration and return to basal concentration after the challenge at a much slower rate (Schaefer et al., Reference Schaefer, Tong, Sather, Beltranena, Pharazyn and Aherne1991) compared to non-pregnant animals. However, the opposite situation occurs when the pregnant sow is undernourished (Bouillon-Hausman et al., Reference Bouillon-Hausman, Kasser, Seerley and Martin1986). In the present study, the timing of dietary supplementation had important consequences for glucose curve characteristics and is discussed in detail below. Maternal characteristics such as parity, body weight and backfat thickness at the start of the study and changes in these parameters over the course of the study had little influence on the glucose curve characteristics but did influence litter outcome.
The beneficial effects of lipids in the diet of the periparturient sow have, in part, been attributed to alterations in maternal glucose metabolism, and hence glucose supply to the developing foetus (Steele et al., Reference Steele, McMurtry and Rosebrough1985). Increasing the amount of lipid in the diet will allow the sow to use fat as a source of energy and therefore less glucose is required, which stays in the bloodstream and raises blood glucose concentrations. It has been speculated by Steele et al. (Reference Steele, McMurtry and Rosebrough1985) that the underlying mechanism responsible for the changes in glucose metabolism is due to growth hormone (GH) secretion, which influences lipolysis and insulin secretion. In this study, basal glucose was higher in G1 compared to the control and G2 groups but did not appear to be influenced by the type of dietary supplementation. One possible explanation for this may be the increased deposition of body fat during the first half of pregnancy in the G1 group and the subsequent mobilisation of body reserves in the second half of pregnancy to meet the metabolic demands of the placenta and the growing foetus(es). It is likely that an increase in GH may be partly responsible for the increased lipolysis (as indicated by the mobilisation of body reserves) observed in the G1 group. This, in turn, should theoretically reduce insulin secretion and increase glucose availability to the growing foetus(es), which would consequently explain the higher litter weights seen in G1 sows. However, in the present experiment, basal insulin concentration remained similar between treatment groups as did the glucose : insulin ratio and so this theory could not be confirmed. These findings are not totally unsurprising as the diet–dose-related changes in glucose tolerance have been attributed to differences in the concentration of serum NEFA rather than to changes in circulating serum insulin, glucagon and GH (Kasser et al., Reference Kasser, Coffery, Seerley and Martin1981).
The concentration of fat in the diet of the pregnant sow has been shown to be inversely related to glucose clearance time (Kasser et al., Reference Kasser, Coffery, Seerley and Martin1981). As a consequence of inducing glucose tolerance via lipid supplementation, maternal insulin concentration is also reduced (Kasser et al., Reference Kasser, Coffery, Seerley and Martin1981). This would act to enhance the amount of glucose available to the foetus(es), which may ultimately have beneficial consequences for foetal growth, energy deposition and survival (Ezekwe and Martin, Reference Ezekwe and Martin1978). On the other hand, dietary lipid may just exaggerate the normal glucose intolerance seen in the pregnant sow (Anderson et al., Reference Anderson, Elsley, McDonald and MacPherson1971). Either way, whether it is a direct or synergistic mechanism, the end result would create an advantageous placental and uterine nutritional environment for foetal growth and energy deposition. However, it should be noted that excessive glucose overload, as seen in gestational diabetes mellitus and when sows are fed ad libitum, could be detrimental to development and health (Bouillon-Hausman et al., Reference Bouillon-Hausman, Kasser, Seerley and Martin1986).
The fatty acid profile of the diet appeared to influence litter outcome in G1 but not in G2. For example, sunflower oil, which is high in polyunsaturated fatty acids, induced a lower number of piglets born alive, whereas supplementation with palm oil (high in saturated fats) seemed beneficial in this respect. An explanation for these differences may be that the medium-chain fatty acids present in palm oil are more easily combusted, thus providing a readily available source of energy. In contrast, diets containing sunflower oil, which is rich in polyunsaturated fatty acids (e.g. n-6 fatty acids), tend to promote pro-inflammatory responses, which can have deleterious effects on piglet survival.
Although the relationship between the concentration of dietary fat and glucose curve characteristics was not directly examined, the addition of olive, sunflower or fish oil to the maternal diet in G1 reduced the AAUC compared to the control and excess groups, which is similar to the findings of Kasser et al. (Reference Kasser, Coffery, Seerley and Martin1981). In contrast, palm oil offered in G1 increased the AAUC, which may, in part, be due to the fact that they were supporting the growth and development of more foetuses. Generally, AAUC was 30% to 40% lower in the G2 groups compared to that observed in the G1 animals. The differences in AAUC between supplementing with palm oil in G1 and G2 were double that observed in the other groups (i.e. ∼70%). These alterations in the ability to handle glucose in late gestation may, in part, explain some of the differences in litter performance between the G1 and G2 groups.
Models to predict neonatal outcome
Kemp et al. (Reference Kemp, Soede, Vesseur, Helmond, Spoorenberg and Frankena1996) demonstrated that the pre-test glucose concentrations were correlated negatively with the maximum increase in glucose and AUC. They suggested that low basal glucose may be associated with poor glucose tolerance in sows during late gestation, increased gestational length and a heavier total litter weight. A similar relationship was observed between basal glucose concentration and gestational length. However, basal glucose in our control group was only correlated with total litter weight in the control group but not average piglet birth weight as reported by Anderson et al. (Reference Anderson, Elsley, McDonald and MacPherson1971). Previous authors have shown a positive correlation between pig mortality and glucose curve characteristics, such as maximum increase in glucose and AUC (Kemp et al., Reference Kemp, Soede, Vesseur, Helmond, Spoorenberg and Frankena1996), but our results do not confirm these findings. Data in the present study indicate that basal glucose is a strong indicator of percentage mortality in the control, whereas after dietary supplementation the maternal physical characteristics become more reliable indicators of mortality rates. Explanations for discrepancies between the studies are numerous but are mainly associated with differences in management practices, experimental design and GTT protocols. In particular, we infused the glucose intravenously whereas Kemp et al. (Reference Kemp, Soede, Vesseur, Helmond, Spoorenberg and Frankena1996) administered the glucose orally, and so passage time through the digestive system may have confounded the results.
Our study revealed that there were numerous maternal production and glucose curve characteristics that could be used as markers to predict litter performance. Dietary manipulation during pregnancy resulted in extensive, complex relationships to describe neonatal outcome compared to the control group. This supports the multifaceted interactions between maternal nutrition, body composition and endocrine status that transfer nutrient across the placenta to the developing foetus(es), which in turn influence the foetal milieu, and consequently growth and development.
Conclusions
Maternal dietary supplementation during gestation has an impact on foetal growth and development. The degree of insulin sensitivity can be altered by both the period during which maternal nutritional supplementation is offered and the fatty acid profile of the diet. Glucose curve characteristics in conjunction with maternal body weight and conformation can, to some extent, be used to predict total litter performance; however, such relationships appear to be more complex following dietary supplementation in G1.
Acknowledgements
The authors acknowledge the financial support of the Commission of the European Communities (QLK1-2001-00138), PeriLip. This work does not necessarily reflect the views of the Commission and in no way anticipates its future policy in this area. The authors thank United Fish Industries for providing the salmon oil, the staff at The Pig Research and Development Unit for their care of animals throughout the study, and Alison Cordrey and Katharine Perkins for their technical assistance.