Implications
Positive relationships between CP and fatty acids (FAs) in herbage have been shown, and in an attempt to utilise this relationship timothy was fertilised with three different N-fertilisation regimes (30, 90 and 120 kg N/ha). The study was conducted under typical production conditions, that is, with the same types and rates of concentrate as on a commercial farm. The achieved differences in FA composition among silages did not affect the milk, which shows that increasing N fertilisation, or inclusion of red clover, does not necessarily lead to higher concentrations of polyunsaturated FAs in milk when the concentrate is used at Swedish standard rates.
Introduction
There is growing awareness among consumers of the link between diet and health. Further, the public often associates dairy products with coronary heart disease, as most of the fatty acids (FA) in milk are saturated (Bauman et al., Reference Bauman, Mather, Wall and Lock2006). Therefore, it would be desirable to improve the FA profile of milk, which might be achieved by using appropriate feeding regimes. In this context, there has been growing interest in the concentrations and composition of unsaturated FAs in forage, particularly the polyunsaturated FAs (PUFAs) such as linoleic acid (18:2n-6) and α-linolenic acid (18:3n-3) and the ratio of the two. These FAs are considered to be beneficial constituents of the human diet (e.g. Leaf and Weber, Reference Leaf and Weber1988; Banni and Martin, Reference Banni and Martin1998) and may have positive effects on disease prevention (e.g. Simopoulos, Reference Simopoulos2001). Milk also contains conjugated linoleic acids (CLA), the major isomer being cis-9, trans-11 CLA, which reportedly has a range of health-promoting properties (Parodi, Reference Parodi2002).
Compared with grass silage, red clover silage has a lower NDF concentration and a higher rumen passage rate (Vanhatalo et al., Reference Vanhatalo, Kuoppala, Toivonen and Shingfield2007). Further, red clover has been shown to have lower lipolytic activities, or to protect the FA against lipolysis through encapsulation in protein–phenol complexes (Van Ranst et al., Reference Van Ranst, Lee and Fievez2011). Hence, significantly higher concentrations of 18:2n-6 and 18:3n-3 have been found in milk from cows fed red clover silage than in milk from cows fed ryegrass silage (Dewhurst et al., Reference Dewhurst, Fisher, Tweed and Wilkins2003a; Al-Mabruk et al., Reference Al-Mabruk, Beck and Dewhurst2004). In the cited studies, apparent recoveries of 18:3n-3 from feed to milk ranged from 8% to 10% and 4% to 5% for red clover silage and grass silage, respectively.
Several studies have also found positive relationships between CP and FA concentrations in forage plants, especially for 18:3n-3 (e.g. Boufaïed et al., Reference Boufaïed, Chouinard, Tremblay, Petit, Michaud and Bélanger2003a; Elgersma et al., Reference Elgersma, Maudet, Witkowska and Wever2005; Witkowska et al., Reference Witkowska, Wever, Gort and Elgersma2008). The majority of the FAs are found in the chloroplasts and a positive correlation has been reported between concentrations of chloroplast lipids and chlorophyll in plants (Hawke, Reference Hawke1973). Further, Gaborcik and Paulik (Reference Gaborcik and Paulik2002) reported a positive relationship between chlorophyll and CP concentrations. Thus, these findings indicate that there is a relationship between CP and FA contents, as both are correlated with chlorophyll concentrations. Smit et al. (Reference Smit, Malda, Dijkstra and Elgersma2007) have studied the effects of N fertilisation on FA concentrations of fresh perennial ryegrass and cis-9, trans-11 CLA in milk. However, to our knowledge, no previous studies have examined whether the relationship persists after ensiling and (if so) whether there are any effects on the milk FAs when silage is fed to cattle. Hence, the aim of this experiment was to evaluate the effects of grass silages subjected to different N-fertilisation regimes fed to dairy cows on the FA composition of their milk, and to compare the grass silages in this respect with red clover-dominated silage. We investigated the different silages under typical production conditions, using commercial concentrates and a forage : concentrate ratio commonly used to mimic the situation on a commercial farm in Sweden.
Material and methods
Experimental silages
In 2006, three different grass silages and a clover–grass silage were produced at Röbäcksdalen Research Centre, Swedish University of Agricultural Sciences, Umeå, Sweden (63°45′N; 20°17′E). On 26 May, a 3-year-old grass ley was fertilised with three different rates of N, 30, 90 and 120 kg N/ha, to produce three different grass silages (designated G-30, G-90 and G-120, respectively). The grass crop consisted mainly (>0.95) of timothy (Phleum pratense L., cv Grindstad) and was grown on a silt loam (15% to 25% clay). The clover–grass crop (RC–G) consisted of red clover (Trifolium pratense L., cv. Betty) and timothy (cv Grindstad; 60 : 40 on dry matter (DM) basis) that received 27 kg N/ha, also on 26 May. The grass–clover crop was grown on a silt soil (2% to 5% clay). The grass was cut on 26 and 27 June and the grass–clover crop on 28 June, when the tip of the inflorescence of timothy was just below the leaf blade base of the flag leaf (stage 49, according to Gustavsson, Reference Gustavsson2011). All forages were cut with a mower conditioner (Kverneland, Kverneland Group, Kverneland, Norway) and a precision chop forage wagon (ES Protec, JF-Stoll, Sønderborg, Denmark) was used for pick up. The forages were field wilted overnight to a DM concentration of about 300 g/kg. Proens® (formic acid and propionic acid, 60 to 66 g/100 g and 25 to 30 g/100 g, respectively, from Perstorp AB, Perstorp, Sweden) was added to all silages at a rate of 3.5 l/t fresh matter. The silages were then stored in bunker silos.
Animals and experimental design
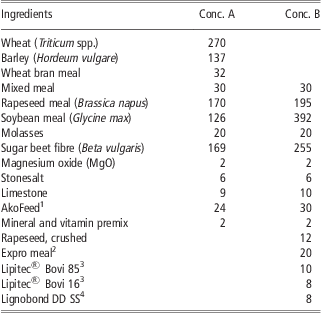
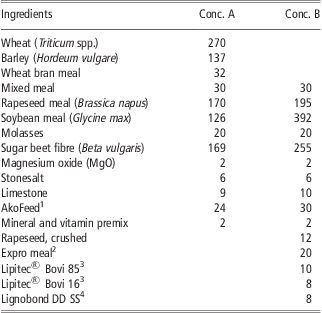
The experiment was conducted as a change-over design according to design No. 4 by Patterson and Lucas (Reference Patterson and Lucas1962). The design included three experimental periods, each 4 weeks long, and four dietary treatments. A total of 24 dairy cows (196 ± 72.6 days in milk at the start of the experiment) of the Swedish Red breed were divided into four blocks of six cows each, taking into account their lactation stage and balancing for equal numbers of primiparous and multiparous cows. Each cow was assigned to three of the four diets according to the scheme provided by Patterson and Lucas (Reference Patterson and Lucas1962). The cows were offered 11 kg DM of silage and 7 kg in total of two commonly used standard commercial concentrates (5 kg of A and 2 kg of B, fresh weight; Tables 1–2). The diets were balanced to cover the protein requirements (Spörndly, Reference Spörndly2003) of cows eating the G-30 diet, that is, the silage with the lowest CP level (Table 2). The silage and concentrate levels were chosen to represent concentrates used commercially in the area.
Ingredient composition of concentrates used (g/kg fresh weight)
1Rumen-protected fat (AarhusKarlshamn AB, Karlshamn, Sweden).
2Protein feed (heat-treated rape seed meal; AarhusKarlshamn AB, Karlshamn, Sweden).
3Rumen-protected fat (NLM Vantinge ApS, Ringe, Denmark).
4Pelleting aid (Borregaard LignoTech, Arpsborg, Norway).
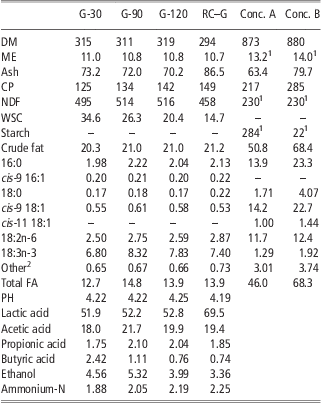
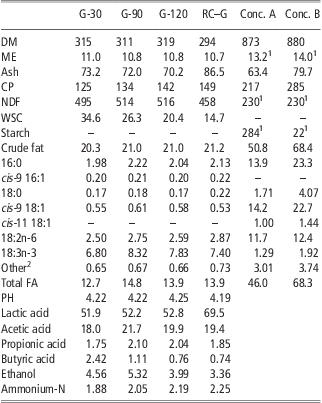
DM concentration (g/kg), energy concentration (MJ/kg DM), chemical composition, individual FAs and fermentation characteristics (g/kg DM) of the experimental feeds (n = 6 for silages, n = 3 for concentrates)
DM = dry matter; ME = metabolisable energy; WSC = water-soluble carbohydrates; FA = fatty acid.
1Values given by the manufacturer.
2Other identified FAs in the silages: 12:0, 14:0, 15:0, 17:0, 20:0, 22:0, trans 16:1, cis-9 17:1, cis-11 18:1, cis-9 20:1, 20:2n-6, 22:5n-3, each in concentrations <0.15 g/kg DM; in the concentrates: 10:0, 12:0, 14:0, 15:0, 17:0, 20:0, 22:0, 24:0, cis-9 14:1, trans 16:1, cis-9 16:1, cis-9 17:1, cis-9 20:1, cis-9 22:1, cis-9 24:1, 20:2n-6, 22:4n-6, 22:5n-3, each in concentrations <1 g/kg DM.
The cows were kept in a loose-housing barn. Roughage and concentrate were fed separately, silage in intake control feeders and concentrate in feeding stations (both from Insentec B.V., Marknesse, the Netherlands). The cows were milked twice daily at 0600 and 1600 h and the yield of each cow was automatically measured at every milking. The cows were weighed (in a scale from Insentec B.V., Marknesse, the Netherlands) automatically in connection with each milking.
Sampling and analyses
Feeds
Throughout the experiment, silage samples were collected daily and stored at −20°C until analysis. Before analysis, samples were pooled to obtain representative samples for 2 consecutive weeks. Samples of concentrate were sampled once a week and stored at −20°C. Before analysis, samples were pooled to obtain representative samples for consecutive 4-week periods, that is, each experimental period.
All silages were analysed for pH, lactic acid, acetic acid, propionic acid, butyric acid, ethanol and ammonium-N. The pH of the silages was determined with a pH electrode (654 pH-meter Methrom AG, Herisau, Switzerland). Organic acids and ethanol were determined by HPLC analysis of silage liquor (Andersson and Hedlund, Reference Andersson and Hedlund1983). To determine ammonium-N, an increase of pH with MgO was followed by direct distillation and titration using a Kjeltec 2100 (FOSS Analytical A/S, Hillerød, Denmark).
Lipids of feed samples were extracted using the method described by Raes et al. (Reference Raes, De Smet and Demeyer2001). Briefly, 5 g portions of freeze-dried samples (Hecto CD 8 system, Heto Lab Equipment, A/S Allerød, Denmark) were weighed into an extraction tube and homogenised (Ultra-Turrax T25, IKA-Labortechnik, Belgium) with chloroform : methanol (2 : 1, v : v) and 10 mg of internal standard (19 : 0, added as free FA, Sigma, Bornem, Belgium) and then extracted overnight. After extraction, samples were methylated with NaOH/MeOH followed by HCl/MeOH and FA methyl esters (FAME) were quantified by gas chromatography as described previously (Raes et al., Reference Raes, De Smet and Demeyer2001).
Samples for chemical analysis of feeds were dried in an air-forced oven at 60°C and ground in a hammer mill (Slagy 200, Kamas Kvarnmaskiner AB, Malmö, Sweden) to pass through a 1 mm screen. DM was determined after drying at 103°C for 16 h and corrected for losses of volatile FAs, alcohols and volatile N. Ash content was determined by combustion at 550°C for 3 h. NDF was determined using an undiluted ND solution according to Chai and Udén (Reference Chai and Udén1998), but without amylase or sulphite. Water-soluble carbohydrates (WSC) and starch were determined enzymatically (Larsson and Bengtsson, Reference Larsson and Bengtsson1983). Kjeldahl-N was analysed (according to the Nordic Committee on Food Analysis, 1976) using a 2020 Digestor and a 2400 Kjeltec Analyser Unit (FOSS Analytical A/S, Hillerød, Denmark). Crude fat was determined by hydrolysis with 3 mol/l HCl followed by extraction with petroleum ether (Official Journal of the European Communities (OJEC), 1984). Metabolisable energy (ME) content was determined by incubation in rumen fluid and buffer for 96 h (Lindgren, Reference Lindgren1979) and calculating the ME concentration using the in vitro disappearance of rumen organic matter according to Lindgren (Reference Lindgren1983).
Milk
Samples for determining fat, protein, lactose and urea in the cows’ milk were taken every week on 2 consecutive days (morning and evening). At the same time, samples for determining FA concentration were taken during the 2 last weeks of each period. The milk samples for determining FA concentrations were frozen at −20°C. Fat, protein, lactose and urea were analysed using a Foss 4000 Milkoscan infrared analyzer (Foss Analytical A/S, Hillerød, Denmark).
For determining FA concentrations, milk samples were thawed and extracted according to the Röse–Gottlieb procedure (ISO-3889; ISO, 2006). Homogenised samples of 10 g were weighed into Mojonnier-type fat-extraction flasks and mixed with 2 ml of ammonium hydroxide solution. The extraction was carried out in three steps. First, 10 ml of ethanol, 25 ml of diethyl ether and 25 ml of petroleum ether were added and mixed gently. In the second step, 5 ml of ethanol, 15 ml of diethyl ether and 15 ml of petroleum ether were used. The final extraction step was performed with diethyl and petroleum ether (both 15 ml). After each extraction step, the supernatant was transferred to fat-collecting vessels after phase separation (30 min). The solvent was evaporated using a rotary evaporator at room temperature and the extracted lipids were resolved in 20 ml of diethyl : petroleum ether (1 : 1, v : v). As internal standards 13 : 0 and 19 : 0 (Sigma, Bornem, Belgium) were used (added as non-esterified FAs in a chloroform solution, which was evaporated before methylation). For methylation, 0.5 ml of the extracts was used and to this 0.5 mg of the internal standards were added. The methylated FAs were analysed by gas chromatography, using a Hawlett-Packard 6890 chromatograph (Hawlett-Packard Co., Brussels, Belgium) with a CP-Sil88 column for FAME (100 m × 0.25 mm × 0.2 μm; Chrompack Inc., Middelburg, the Netherlands). The following temperature programme was used: 70°C for 4 min, followed by an increase at 10°C/min to 150°C, then increased at 1°C/min to 165°C, held at 165°C for 20 min, increased at 2°C/min to 170°C, held at 170°C for 10 min, increased at 4°C/min to 215°C and held at 215°C for 20 min.
Statistical analysis
Data were collected on each cow using a change-over design with repeated measures (Patterson and Lucas, Reference Patterson and Lucas1962). As suggested by Jones and Kenward (Reference Jones and Kenward1989) and Fitzmaurice et al. (Reference Fitzmaurice, Laird and Ware2004), mixed linear models were used for the analyses. In addition to the treatment and block effects, the models included period effects, carry-over effects and sequence effects. An unstructured covariance matrix was fitted for the repeated measures part of the model. The Mixed procedure of the SAS (2004) package was used for the analyses. Different models were tested and the decision to include a factor in the model was based on the Akaike Information Criterion (AIC), with the side condition that the same model should be used for all response variables. The final model was

where Yijk is the observation, μ the general mean, Pi the effect of period, Bj the effect of block, Sk the effect of silage, PSik the interaction between period and silage and eijk the residual error.
Carry-over effects and sequence effects were not significant (P > 0.10) and/or resulted in a higher AIC value and were therefore excluded from the presented results. The treatment effect was divided into the following orthogonal comparisons: (1) red clover containing silage v. N-fertilised grass silages, (2) linear and (3) quadratic effects of increasing N fertilisation. Differences were considered significant if P < 0.05.
Results
Chemical composition, FA profiles and intake of the diets
As shown in Table 2, the silages were well preserved and had similar DM and ME concentrations. Increasing N fertilisation resulted in increased CP concentrations and a slight increase in NDF concentration among the grass silages. Further, the RC–G silage had a lower NDF concentration compared with the grass silages (Table 2).
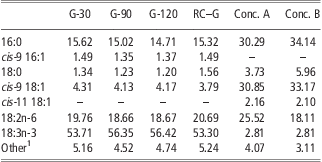
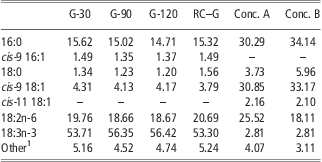
There were differences among the grass silages in terms of 16:0, cis-9 18:1, 18:2n-6, 18:3n-3 and total FA concentrations (Table 2). The G-90 silage had the highest concentration of all above-mentioned FAs, G-30 had the lowest and G-120 had intermediate concentrations. RC–G had a higher concentration of 18:0 and 18:2n-6 than the grass silages. When it comes to proportions of FAs, differences could be seen for all six FAs presented in Table 3. G-30 had higher proportions of 16:0, cis-9 16:1, 18:0, cis-9 18:1 and 18:2n-6 and lower proportion of 18:3n-3 than G-90 and G-120. RC–G contrasted to the grass silages in terms of higher proportions of 18:0 and 18:2n-6 and a lower proportion of cis-9 18:1. It should be noted that dietary 18:3n-3 mainly was supplied by the silages, whereas a larger proportion of cis-9 18:1 and 18:2n-6 originate from the concentrates.
FA proportions (g/100 g FA) in the experimental feeds (n = 6 for silages, n = 3 for concentrates)
FA = fatty acid.
1Other identified FAs: 12:0, 14:0, 15:0, 17:0, 20:0, 22:0, trans 16:1, cis-9 16:1, cis-9 17:1, cis-11 18:1, cis-9 20:1, 20:2n-6, 22:5n-3, each in concentrations <1 g/100 g FA.
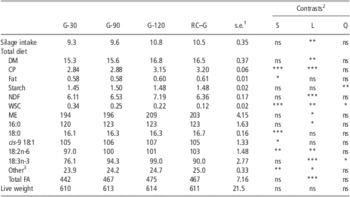
The DM intakes of the different silages showed a linear increase with increasing N fertilisation (Table 4). The slightly higher intake of the G-120, combined with the differences in chemical composition (Table 2), resulted in differences in intake of CP and NDF between the three grass silages (Table 4). The intake of 18:2n-6, 18:3n-3, other FAs and total fatty acids (TFA) also showed a linear increase among the grass silages The RC–G silage resulted in a higher CP intake and a somewhat higher crude fat intake compared with the grass silages. Compared with the grass silages, the RC–G silage also resulted in higher intakes of 18:0, cis-9 18:1, 18:2n-6 and other FAs (Table 4).
Daily feed intake (kg/day), energy intake (MJ/day), FA intake (g/day) and live weight (kg)

FA = fatty acid; DM = dry matter; WSC = water-soluble carbohydrates; ME = metabolisable energy.
1Standard error of mean.
2S, clover–grass silage v. grass silages; L, linear effect of N fertilisation; Q, quadratic effect of N fertilisation; ns, non-significant; *P < 0.05; **P < 0.01; ***P < 0.001.
3Other identified FAs: as in Table 2.
Milk production and FA composition
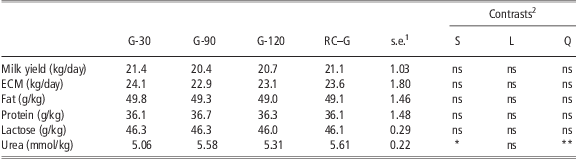
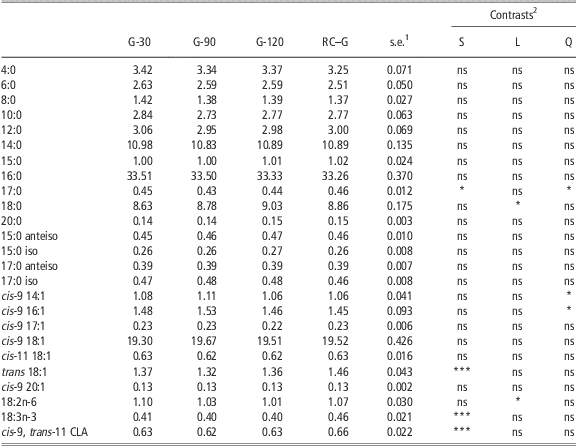
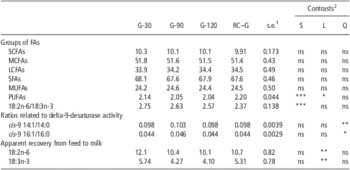
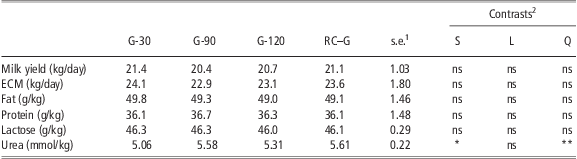
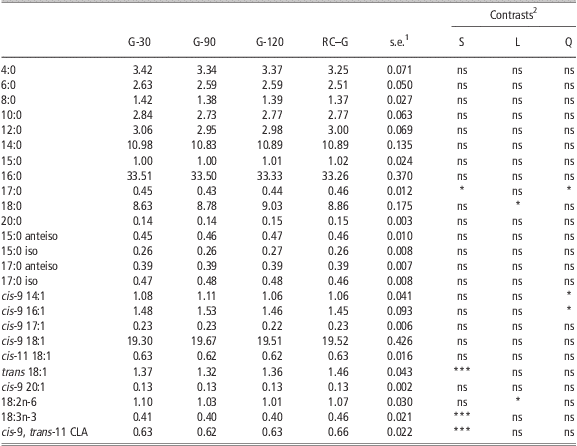
The daily milk production was the same over treatments and there were no major differences in composition except a somewhat higher concentration of urea in milk from cows given the RC–G diet and a quadratic effect among the cows fed grass silages, with G-90 resulting in a higher urea concentration than the other two (Table 5). There were, however, some differences in FA composition in the milk, depending on treatment (Table 6). Feeding RC–G silage resulted in higher concentrations of 17:0 and the unsaturated trans 18:1, 18:3n-3 and cis-9, trans-11 CLA in milk than when fed grass silages. As a consequence, the 18:2n-6/18:3n-3 ratio was significantly lower in milk from cows fed the RC–G silage compared with the other three silages (Table 7). Linear effects were found on 18:0 and 18:2n-6 with increasing concentration of 18:0 and decreasing concentration of 18:2n-6 in the milk with increasing N fertilisation of the grass silages. There were also quadratic effects in terms of 17:0, cis-9 14:1 and cis-9 16:1 with G-90, resulting in lower concentration of 17:0 and higher concentrations of cis-9 14:1 and cis-9 16:1 compared with the other two grass silages (Table 6).
Effect of diets on daily milk production and composition
ECM = energy corrected milk.
1Standard error of mean.
2S, clover–grass silage v. grass silages; L, linear effect of N fertilisation; Q, quadratic effect of N fertilisation; ns, non-significant; *P < 0.05; **P < 0.01; ***P < 0.001.
Effect of diets on milk FA concentrations (g/100 g FA)
FA = fatty acid; CLA = conjugated linoleic acids.
1Standard error of mean
2S, clover–grass silage v. grass silages; L, linear effect of N fertilisation; Q, quadratic effect of N fertilisation; ns, non-significant; *P < 0.05; **P < 0.01; ***P < 0.001.
Concentrations of groups of FAs (g/100 g FA) in milk, ratios related to delta-9-desaturase activity and apparent recoveries of dietary 18:2n-6 and 18:3n-3 (%)

FA = fatty acid; SCFAs = short chain fatty acids (C4-C10); MCFAs = medium chain fatty acids (C12-C16); LCFAs = long chain fatty acids (C17-C22); SFAs = saturated fatty acids; MUFAs = monounsaturated fatty acids; PUFAs = polyunsaturated fatty acids.
1Standard error of mean.
2 S, clover–grass silage v. grass silages; L, linear effect of N fertilisation; Q, quadratic effect of N fertilisation; ns, non-significant; *P < 0.05; **P < 0.01; ***P < 0.001.
No significant differences could be seen between the silages in the concentrations of short, medium or long chain FAs (SCFAs, MCFAs and LCFAs, respectively) in the milk (Table 7). The RC–G silage resulted in higher concentrations of PUFAs in the milk compared with the grass silages (Table 7). A linear effect could also be noted for the PUFA concentration in milk, with G-30 resulting in the highest concentration.
Although the intake of 18:2n-6 and 18:3n-3 was lower from G-30 than G-90 and G-120 (Table 6), there was a higher 18:2n-6 and no differences in 18:3n-3 concentrations in the milk when feeding G-30, which resulted in a higher recovery of dietary 18:2n-6 and 18:3n-3 in the milk from G-30 (Table 7).
Discussion
As hypothesised, there was an increase of most individual and total FAs when increasing the N fertilisation, but only from 30 to 90 kg N/ha and no further increase when fertilising with 120 kg N/ha (Table 2). This is partly in agreement with findings from earlier studies (Boufaïed et al., Reference Boufaïed, Chouinard, Tremblay, Petit, Michaud and Bélanger2003b; Elgersma et al., Reference Elgersma, Maudet, Witkowska and Wever2005; Witkowska et al., Reference Witkowska, Wever, Gort and Elgersma2008). Boufaïed et al. (Reference Boufaïed, Chouinard, Tremblay, Petit, Michaud and Bélanger2003a) found positive linear relationships between the N concentration and 16:0, 18:2n-6, 18:3n-3 and total FA in timothy. In addition, Elgersma et al. (Reference Elgersma, Maudet, Witkowska and Wever2005) found strong linear relationships between CP and concentrations of 18:3n-3 and TFA in perennial ryegrass. In addition, when it comes to proportions of FAs in the silages, there were some differences (Table 3). The higher N-fertilisation rates gave a higher proportion of 18:3n-3, whereas G-30 showed a higher proportion of 18:2n-6. The RC–G was rather similar to G-30 in proportions of the FAs presented in Table 3. Previous reports of FA concentrations in grass and red clover silages differed between experiments, for example, Vanhatalo et al. (Reference Vanhatalo, Kuoppala, Toivonen and Shingfield2007) reported concentrations of 18:2n-6 and 18:3n-3 to be 4.4 and 11.6 g/kg DM in grass silage and 5.7 and 14.2 g/kg DM in red clover silage, respectively, whereas Dewhurst et al. (Reference Dewhurst, Fisher, Tweed and Wilkins2003a, experiment 1) found them to be 2.4, 7.7, 3.7 and 6.2 g/kg DM for 18:2n-6 and 18:3n-3 in grass silage and red clover silage, respectively. In the latter study, in a mix of grass and red clover (50 : 50 on DM basis), the concentrations were 2.9 and 7.0 g/kg DM for 18:2n-6 and 18:3n-3, respectively. In the current study, the FA concentrations in silages were comparable with those from the study by Dewhurst et al. (Reference Dewhurst, Fisher, Tweed and Wilkins2003a), whereas the concentrations in grass silages were approximately half of the concentrations found by Vanhatalo et al. (Reference Vanhatalo, Kuoppala, Toivonen and Shingfield2007). The differences could partly be because of oxidative losses of FAs during wilting, as the material was wilted overnight in the current study compared with the relatively short wilt (3 h for grass) by Vanhatalo et al. (Reference Vanhatalo, Kuoppala, Toivonen and Shingfield2007). However, Arvidsson et al. (Reference Arvidsson, Gustavsson and Martinsson2009) studied the effect of ensiling and found that a wilting process shorter than 24 h did not have any substantive effect on FA composition. However, different species and even different cultivars of the same species may respond differently to different treatments. For instance, results from a study by Chow et al. (Reference Chow, Fievez, Ensberg, Elgersma and De Smet2004) indicated that susceptibility to oxidation during field wilting is cultivar dependent. The cited authors compared three cultivars of perennial ryegrass and found that wilting had no significant effect on the proportions of 18:3n-3 in one cultivar, whereas it reduced the proportion in the other two. Moreover, Vanhatalo et al. (Reference Vanhatalo, Kuoppala, Toivonen and Shingfield2007) harvested the silages earlier in the season, which indicates that grass was in an earlier developmental stage than in the current study.
The higher concentration of 18:2n-6 and the same concentration of 18:3n-3 in milk from cows given the G-30 silage compared with cows offered the other grass silages (Table 6) arose, despite lower intake levels of these FAs (Table 4). Boufaïed et al. (Reference Boufaïed, Chouinard, Tremblay, Petit, Michaud and Bélanger2003a) found that a higher amount of 18:3n-3 bypassed ruminal biohydrogenation when timothy was fertilised with 120 kg N/ha compared with 0 kg N/ha. This finding would rather lead to a potentially higher recovery of PUFA from feed to milk from the G-90 and G-120 silages, as larger amount of FAs would be available for absorption in the intestine. In a study by Smit et al. (Reference Smit, Malda, Dijkstra and Elgersma2007), there were no significant overall differences in milk from cows eating grass treated with high or low N (73 v. 37 kg N/ha); however, on one occasion, a higher concentration of cis-9, trans-11 CLA was found in the milk from cows receiving grass from the low N treatment. The cited authors suggested that the lower NDF concentration could have induced a higher intake of the grass from the low N treatment, and thus a higher intake of FAs. In addition, in the current study, there was a lower NDF concentration in G-30 compared with the other grass silages; however, in contrast to the results of Smit et al. (Reference Smit, Malda, Dijkstra and Elgersma2007), the lowest DM and PUFA intakes were recorded for G-30. However, a higher NDF concentration in the diet stimulates fibrolytic bacteria, which enhance the conversion of 18:1 to 18:0 in the rumen (Dewhurst et al., Reference Dewhurst, Scollan, Lee, Ougham and Humphreys2003b). This could explain the linear increase in 18:0 concentrations in milk with increasing N fertilisation. Further, the WSC concentration was inversely correlated with the CP concentration in the grass silages, with G-30 resulting in significantly higher WSC intake than the other silages (Table 2 and 4), which is in accordance with Elgersma et al. (Reference Elgersma, Maudet, Witkowska and Wever2005) who found the same trend in perennial ryegrass. Lee et al. (Reference Lee, Merry, Davies, Moorby, Humphreys, Theodrou, MacRae and Scollan2003) found in an in vitro experiment that a high inclusion of WSC in the diet induced a shift towards fermentation of WSC rather than fibre digestion, which suggests a shift away from fibrolytic bacteria. In contrast, there was no effect on C18 biohydrogenation when feeding high-sugar grass silage compared with a control silage (Lee et al., Reference Lee, Connelly, Tweed, Dewhurst, Merry and Scollan2006).
The higher concentration of 18:3n-3 in milk from cows offered the RC–G silage compared with the grass silages is in accordance with earlier studies. Dewhurst et al. (Reference Dewhurst, Fisher, Tweed and Wilkins2003a) and Al-Mabruk et al. (Reference Al-Mabruk, Beck and Dewhurst2004) reported higher concentrations of 18:3n-3 in milk from cows offered red clover silages, despite the lower concentration of this FA in the clover silages compared with grass silages. Higher concentrations of PUFAs in milk from cows offered red clover silage have been associated with the polyphenol oxidase (PPO) activity in red clover (Lee et al., Reference Lee, Winters, Scollan, Dewhurst, Theodorou and Minchin2004). The binding of proteins to phenols, which results from PPO activity, lead to inhibition of lipolysis in the silage and as lipolysis is a prerequisite for biohydrogenation of PUFAs in the rumen, the extent of biohydrogenation is decreased. However, Van Ranst et al. (Reference Van Ranst, Lee and Fievez2011) concluded that the importance of this inhibition of lipolysis in the silage is questionable. The PPO-mediated inhibition of lipolysis failed to protect lipids against microbial lipases, which become important during later stages of ensiling and in the rumen. Instead, Van Ranst et al. (Reference Van Ranst, Lee and Fievez2011) postulated that PUFA could be protected against metabolism through encapsulation in protein–phenol complexes. In the current paper, there were, however, no significant effects on apparent recoveries of PUFA from RC–G compared with the grass silages. This is because of the high recoveries of 18:2n-6 and 18:3n-3 from G-30 (Table 7), which probably is an effect of the relatively higher concentrate ratio in this diet. In the study by Dewhurst et al. (Reference Dewhurst, Fisher, Tweed and Wilkins2003a, experiment 1), the apparent recoveries of 18:2n-6 were 11.7 and 10.9 and for 18:3n-3 3.8 and 4.3 for a grass silage and a red clover–grass silage (50 : 50, DM basis), respectively. The values for 18:2n-6 are comparable, but our recoveries for 18:3n-3 were a bit higher than the values reported by Dewhurst et al. (Reference Dewhurst, Fisher, Tweed and Wilkins2003a). However, the recoveries, especially for 18:2n-6, were low in both studies, which probably is an effect of the rather high supplementation of 18:2n-6 from the concentrate.
The higher concentrations of biohydrogenation intermediates (total trans 18:1 and cis-9, trans-11 CLA) found in milk from cows eating RC–G compared with the grass silages is in contrast with results from Al-Mabruk et al. (Reference Al-Mabruk, Beck and Dewhurst2004), who found lower concentrations of both these FAs in milk from cows offered red clover silage, whereas van Dorland et al. (Reference van Dorland, Kreuzer, Leuenberger and Wettstein2008) found a reduced concentration of cis-9, trans-11 CLA but a similar concentration of trans 18:1 FAs.
The CLA isomer cis-9, trans-11 CLA is mainly produced in the mammary gland from trans-11–18:1, through the action of delta-9-desaturase. The ratios cis-9 14:1/14:0, cis-9 16:1/16:0 and cis-9, trans-11 CLA/trans-11 18:1 can be used to estimate the activity of delta-9-desaturase. Of these, the ratio cis-9 14:1/14:0 is considered to give the best estimate of delta-9-desaturase activity, as all of the 14:0 in milk fat is produced via de novo synthesis in the mammary gland and desaturation is the only source of cis-9 14:1 (Corl et al., Reference Corl, Baumgard, Bauman and Griinari2000). The quadratic effects that could be seen for the cis-9 14:1/14:0 and cis-9 16:1/16:0 ratios showed higher values in milk produced from the G-90 diet but the differences were small and there were no differences in SCFA and MCFA concentrations in milk among diets (Table 7). Further, Lourenço et al. (Reference Lourenço, Vlaeminck, Bruinenberg, Demeyer and Fievez2005) showed a similar amount of trans-11 18:1 to be converted to cis-9, trans-11 CLA among diets, despite differences in the ratio cis-9 14:1/14:0. This indicated that effects of diet on milk FAs were predominantly affected by differences in the rumen (microbial activity/fermentation) or from differences in passage rate. However, the small differences found in this study show that increasing N fertilisation, or inclusion of red clover in the diet, does not necessarily lead to a higher concentration of unsaturated FAs in milk.
Conclusions
Increasing levels of N fertilisation in grass led to increasing concentrations of CP in silage. The increasing N fertilisation also led to higher concentrations of 18:2n-6 and 18:3n-3 in the G-90 and G-120 silages compared with G-30 silage. However, with the rates and types of concentrates used in this study, the achieved differences in FA composition among the silages were not large enough to have any major effect on the milk FA composition. This shows that increasing N fertilisation to reach a higher PUFA concentration, or inclusion of red clover in the diet, does not necessarily lead to a higher concentration of PUFA in the milk when concentrates are used at standard rates in Swedish systems.
Acknowledgement
The authors thank the staff of the Röbäcksdalen Research Centre's dairy farm, Swedish University of Agricultural Sciences, for their care of the experimental animals and help during the experiment. We also thank Börje Ericsson and the staff at the Laboratory at Kungsängens Research Centre, Swedish University of Agricultural Sciences, and the staff at Laboratory for Animal Nutrition and Animal Product Quality, Ghent University, for their technical support with the analyses. The work was founded by the Regional Foundation of Agricultural Research in Northern Sweden (RJN) and the Swedish Farmers’ Foundation for Agricultural Research (SLF).