I. INTRODUCTION
Photoelectrochemical (PEC) water splitting to produce hydrogen and oxygen has attracted intense research interests since the pioneering work of Fujishima and Honda in the early 1970s. Reference Fujishima and Honda1 In the ideal case, to drive the hydrogen evolution reaction (HER) and oxygen evolution reaction (OER) using electrons/holes generated under illumination, a single semiconductor material must have the band energy (E g) large enough to split water, the conduction band-edge energy (E cb) and valence band-edge energy (E vb) that straddles the electrochemical potentials E o (H+/H2) and E o (O2/H2O), respectively. In addition to exhibiting an optimal band gap for solar absorption, semiconductor photoelectrodes must exhibit excellent oxidative/reductive stability in contact with aqueous electrolyte solutions. Reference Walter, Warren, McKone, Boettcher, Mi, Santori and Lewis2 However, most semiconductors including CdS, WO3, TiO2, ZnO, etc., are either unstable in aqueous solution or with unsuitable band position or too large band gap to absorb visible light effectively. Reference Maedaa3 A heterojunction structure, which can combine merits of each component to show synergistic effects, generally offers more advantages. Among the wide varieties of heterojunction systems, tungsten trioxide/bismuth vanadate (WO3/BiVO4) has been one of the most studied systems. BiVO4 (BVO) can increase the visible light absorption ability of the heterojunction system due to its lower band gap than that of WO3 (WO). Meanwhile, the E cb of WO3 is at a potential of ∼0.42 V versus the reversible hydrogen electrode (RHE), more positive than that of BiVO4 (0.02 V versus RHE). Reference Chatten, Chadwick, Rougier and Lindan4,Reference Cooper, Gul, Toma, Chen, Glans, Guo, Ager, Yano and Sharp5 When combined into WO3/BiVO4 heterojunction, photo-induced electrons from conduction band (CB) of BiVO4 can be injected into the CB of WO3 rapidly, Reference Hong, Lee, Jang and Lee6–Reference Su, Guo, Bao and Grimes8 accelerating the separation of photo generated carriers at the interface of BiVO4 and WO3. Thus much higher incident photon to current conversion efficiency (IPCE) can be achieved. Reference Park, McDonald and Choi9
In the WO3/BiVO4 heterojunction system, BiVO4 exhibits a short carrier diffusion length (L d) of around 70 nm. Reference Abdi, Savenije, May, Dam and van de Krol10 So currently most of WO3/BiVO4 heterojunctions were made as extremely thin absorber (ETA) heterojunction structures to compensate for the short L d, such as BiVO4-capped WO3 nanorod, Reference Pihosh, Turkevych, Mawatari, Asai, Hisatomi, Uemura, Tosa, Shimamura, Kubota, Domen and Kitamori11 WO3/W:BiVO4 core/shell nanowire, Reference Rao, Cai, Liu, Cho, Lee, Weisse, Yang and Zheng12 WO3/BiVO4 helical nanostructure, Reference Shi, Choi, Zhang, Kwon, Kim, Lee, Oh, Kim and Park13 and WO3/BiVO4 core/shell nanorod. Reference Pihosh, Turkevych, Mawatari, Uemura, Kazoe, Kosar, Makita, Sugaya, Matsui, Fujita, Tosa, Kondo and Kitamori14 In these core–shell nanostructures, the BiVO4 layers are very thin, so the WO3 nanorods have to be long enough to gain the optical thickness. However, the photocurrent will be decreased due to the increased resistivity of the long nanorods. Furthermore, these heterostructures made by chemical process or Glancing Angle Deposition (GLAD) are not dense enough. There are still some interspaces among the WO3 nanorods, which may have negative effects on the charge separation and transportation. Therefore, self-assembled vertical heteroepitaxial nanostructures (VHN) of WO3–BiVO4, which show high density and interface/volume ratio, are more promising for device applications. Reference Van, Do, Chen, Tzeng, Tsai, Song, Liu, Lin, Chen, Wu, Luo, Chou, Huang, Hsu and Chu15
The VHN was firstly reported in the (La0.67Ca0.33MnO3)1−x –(MgO) x composite system on a (100)-oriented MgO substrate by metal organic aerosol deposition method. Reference Lebedev, Verbeeck, Van Tendeloo, Shapoval, Belenchuk, Moshnyaga, Damashcke and Samwer16 Later it was extended to other two-phase oxide systems such as perovskite with spinel, rock salt, and wurzite structures because of its advantages to tune the microstructures and achieve better physical properties. Reference Zheng, Wang, Lofland, Ma, Mohaddes-Ardabili, Zhao, Salamanca-Riba, Shinde, Ogale, Bai, Viehland, Jia, Schlom, Wuttig, Roytburd and Ramesh17–Reference MacManus-Driscoll21 According to the Winter-bottom construction, Reference Winterbottom22 the material with higher wetting ability prefers to grow into matrix (layer-by-layer growth mode) and the other in less contact with the substrate forms nanopillars (island growth mode) embedded in the matrix, which was revealed in BiFeO3–CoFe2O4 VHN grown on SrTiO3 substrate with different orientations. Reference Zheng, Straub, Zhan, Yang, Hsieh, Zavaliche, Chu, Dahmen and Ramesh23
However, unlike the conventional cube-on-cube orientation relationship between the constituent phases and the substrate,
Reference Zheng, Wang, Lofland, Ma, Mohaddes-Ardabili, Zhao, Salamanca-Riba, Shinde, Ogale, Bai, Viehland, Jia, Schlom, Wuttig, Roytburd and Ramesh17,Reference Chen, Bi, Jia, MacManus-Driscoll and Wang20,Reference Zheng, Straub, Zhan, Yang, Hsieh, Zavaliche, Chu, Dahmen and Ramesh23–Reference Zhang, Chen, Bi, Jia, MacManus-Driscoll and Wang25
the WO3–BiVO4VHN system grown on the yttria-stabilized zirconia (YSZ) substrate is very complicated because WO3 has a orthorhombic structure (Pmnb: a = 7.341 Å, b = 7.570 Å, c = 7.754 Å), BiVO4 has a monoclinic structure (C2/c: a = 5.1956 Å, b = 5.0935 Å, c = 11.7044 Å, β = 90.383°), and YSZ has a cubic structure (
 $Fm\bar 3m$
: a = 5.155 Å). Therefore, the microstructure evolution and the growth mechanism of the WO3–BiVO4 VHN are prerequisite for the optimization of water splitting properties of this novel VHN system. In this study, a series of WO3–BiVO4 VHN thin films with different molar fractions of WO3 as 17, 25, 50, 67, and 100% (abbreviated as 17WB, 25WB, 50WB, 67WB, and 100W, respectively) were grown on YSZ (001) substrate by pulsed laser deposition (PLD) method and their microstructures were investigated in detail by a combination of various microscopy techniques, such as scanning electron microscopy (SEM), high resolution transmission electron microscopy (HRTEM) and X-ray energy dispersive spectroscopy (EDS).
II. EXPERIMENT SECTION
A. Samples preparation
Epitaxial nanocomposite WO3–BiVO4 (17, 25, 50, 67, and 100 mol% WO3) films were grown on (001) oriented YSZ substrate by PLD using a KrF (λ = 248 nm) excimer laser with a laser density of 1 J/cm2. Dual-target systems of bulk WO3 ceramic and BiVO4 ceramic were used to fabricate epitaxial WO3–BiVO4 self-assembled nanostructures, the ratio of WO3 pulse and BiVO4 pulse was altered during the deposition process to control the molar fraction of WO3. In addition, a pure BiVO4 film was grown on YSZ substrate as a reference for X-ray diffraction (XRD) analyses. All the samples were deposited at the substrate temperature of 600 °C under oxygen pressure of 150 mtorr. Reference Van, Do, Chen, Tzeng, Tsai, Song, Liu, Lin, Chen, Wu, Luo, Chou, Huang, Hsu and Chu15
B. Microstructure characterization and analysis
The as-prepared nanostructure thin films were characterized by XRD and scanning electron microscopy (SEM; S-4800, Hitachi Corp., Tokyo, Japan). Cross-sectional TEM specimens were prepared by a standard procedure which included mechanical grinding, polishing, precision dimpling and ion milling. To minimize damage, samples were cooled with liquid nitrogen during ion milling. TEM observations were carried out using a JEM-2100F (JEOL Ltd., Tokyo, Japan) operating at 200 kV equipped with an SDD EDS detector (X-Max 80T, Oxford Instruments, Oxford, UK) for chemical composition analyses.
III. RESULTS AND DISCUSSION
A. General microstructures and morphologies
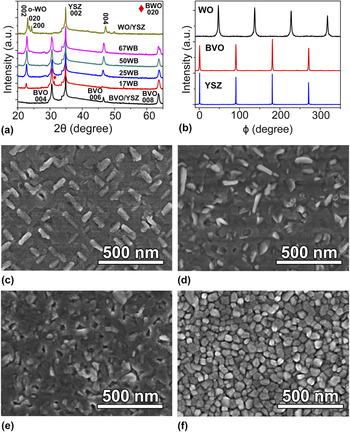
Figure 1(a) shows the θ–2θ X-ray diffraction (XRD) of a series of WO–BVO VHN thin films grown on (001) oriented YSZ substrate. Distinct diffraction peaks originated from BVO (00l) series and WO (00l) series in addition to the YSZ (002) peak indicated that all the WO–BVO VHN films have clear phase separation feature and both BVO and WO exhibit preferential growth orientation along the [001] c direction of the YSZ substrate. From the XRD observation, BVO possesses the monoclinic structure in either the single film or the composite films. Interestingly, WO exhibits orthorhombic structure (o-WO) with polycrystalline feature in the single film, and it maintains orthorhombic structure with specific epitaxial relationship while being placed in BVO matrix. In addition, a small peak marked with a rhombus was found in the XRD spectrum of the 17WB sample, as shown in Fig. 1(a), which corresponds to the (020) peak of orthorhombic Bi2WO6 (BWO). To further reveal the in-plane orientation relationship between WO, BVO, and YSZ in advance, the ϕ scan of XRD was carried out for the 50WB sample, as shown in Fig. 1(b). In the sample, four peaks of YSZ in the azimuthal scan along the {022} plane indicated a 4-fold rotation symmetry, confirming its cubic structure. Similarly, monoclinic BVO also shows four peaks along its {013} plane at the positions with the same angles as those of YSZ. Theoretically, this plane only has 2-fold rotation symmetry, and therefore the presence of four peaks implies that two sets of BVO structural domains must be formed while being growing on the YSZ substrate. Similarly, four peaks along the WO {022} plane were observed but the angle positions of these peaks shift with 45° respect to those of YSZ, as shown in Fig. 1(b), which implies that two sets of WO structural domains are formed on the YSZ substrate with a 45° in-plane rotation.
(a) The θ–2θ XRD patterns of WO–BVO VHN films. (b) ϕ scans of WO, BVO, and YSZ in 50WB sample showing the in-plane symmetries and orientation relationships. (c)–(f) Typical SEM images of 17WB, 25WB, 50WB, and 100W samples.

To reveal the surface morphology, the VHN thin films with different WO molar fractions were observed using SEM. Figure 1(c) shows the typical microstructure of 17WB. It can be clearly seen that many rectangular shaped grains with brighter image contrast embedded into a relatively flat matrix film. These grains bulged on the BVO surface and are parallel or perpendicular to each other regularly, revealing two kinds of domains. Figure 1(d) shows that the shape and azimuth of WO grains in 25WB sample are very different from that of 17WB. The WO grains became elongated and irregular shapes with random distributions, indicating that the growth mode and the crystalline phases of the VHN film might be changed. Furthermore, for 50WB sample, the obvious features of WO grains disappeared. The thin film became smooth and both WO and BVO grains cannot be distinguished simply through the image contrast or grain shape [Fig. 1(e)]. The 67WB sample exhibits similar surface morphology as that of 50WB (not shown here). For the pure WO film (100W), the sizes of the WO grains are much smaller than that of the WO grains in other samples and the grains are equiaxed and very uniform. The drastic variations of the surface morphologies among these samples indicate that the microstructures of the VHN thin films strongly depend on the content of WO, which needs further investigation by TEM.
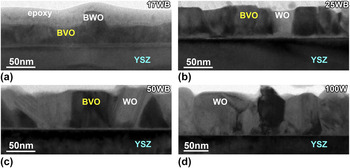
Figures 2(a)–2(d) show the low magnification cross-sectional TEM images of WO–BVO VHN films with different WO molar fractions. It can be seen that all the three samples with BVO show the mixture of two phases, where the WO nanopillars are embedded into the BVO matrix. The contents of the observed WO grains increased with the increasing of WO molar fraction. For the 17WB sample shown in Fig. 2(a), the thickness of the film is about 40 nm, in which the nanopillars of BWO with inverted cone shape are clearly observed in the BVO matrix. The identification of the BWO phase was described later. In 25WB sample, the WO nanopillars grew perpendicularly to the substrate, as shown in Fig. 2(b). The interface between WO nanopillars and the BVO matrix is perpendicular to the substrate. As WO molar fraction increased, the shapes of WO nanopillars in the 50WB and 67WB samples (not shown here) became irregular, indicating a random growth orientation of WO, as shown in Fig. 2(c). Furthermore, in 100W sample shown in Fig. 2(d), the WO thin film became polycrystalline. In addition, the interfaces between the film and YSZ substrate became thinner and sharper with the increase of WO in the samples.
Cross-sectional TEM images of WO–BVO VHN films (a) 17WB; (b) 25WB; (c) 50WB, and (d) 100W.

B. Crystalline phases and the interface structures
Because all the samples were composed of more than three crystalline phases and orientation relationships, it is difficult to identify the possible crystal phases and reveal the epitaxial relationship between the thin film and YSZ substrate by selected area electron diffraction (SAED) technique. Alternatively, detailed HRTEM observations were carried out on these samples. Figure 3(a) shows a typical HRTEM image of the YSZ substrate in 17WB sample along the [100] zone axis, which is the same for all the samples. The substrate surface of the (001) plane is horizontal. To reveal the epitaxial relationships between the thin film and the YSZ substrate, all the other HRTEM images were taken along the same direction. Figure 3(b) shows a typical HRTEM image and its corresponding Fast Fourier Transaction (FFT) pattern of the bulgy pillars in 17WB sample. It cannot be indexed as orthorhombic or any other WO crystal phases. Instead, it matched very well with the orthorhombic BWO phase. The quantification of EDS spectrum from this grain revealed that the Bi:W ratio is about 2:1, further confirmed the phase identification of BWO. Thus, the orthorhombic BWO phase was identified in the 17WB sample with an orientation relationship of (020)BWO//(002)YSZ and [100]BWO//[100]YSZ, consistent with the presence of orthorhombic BWO (020) peak in the XRD result. It indicates that the interdiffussion between the BVO and WO occurred in high BVO content and formed the BWO phase. The BVO in all the samples were epitaxially grown on the YSZ substrate. Figures 3(c) and 3(d) show the typical HRTEM images and their corresponding FFT patterns of the BVO in 67WB, which were indexed as the [100] and [010] zone axes of the monoclinic phase, respectively, consistent with the XRD analyses. Therefore, the orientation relationships between the BVO and YSZ substrate are (001)BVO//(001)YSZ and [100]BVO//[100]YSZ or [010]BVO//[100]YSZ, which indicates a 90° in-plane rotation of the BVO domains. And this orientation relationship is kept for all the samples, as shown in Fig. 1(a).
Typical HRTEM images and their corresponding FFT patterns (inset) of (a) YSZ substrate along the [100] zone axis in 17WB sample; (b) orthorhombic BWO along the [100] zone axis in 17WB sample; (c) monoclinic BVO along the [100] zone axis in 67WB sample; (d) monoclinic BVO along the [010] zone axis in 67WB sample; (e) hexagonal WO along the
 $\left[ {1\bar 21\bar 6} \right]$
zone axis in 25WB sample; (f) hexagonal WO with the
 $\left( {10\bar 10} \right)$
plane in 25WB sample; (g) orthorhombic WO along the
 $\left[ {1\bar 10} \right]$
zone axis in the pure WO thin film; (h) orthorhombic WO with the (010) plane in the pure WO thin film.

Concerning the WO phase, the situation is more complicated. In 25WB, 50WB, 50WB, and 67WB samples, small amounts of hexagonal WO (h-WO) phases formed with different grain orientations, which were not detected by XRD. Figure 3(e) shows a typical HRTEM image of h-WO (S.G.: p63mc, a = 7.298 Å and c = 3.899 Å) grain in 25WB sample along the
 $\left[ {1\bar 21\bar 6} \right]$
h-WO zone axis, which has the orientation relationship of
 $\left( {10\bar 10} \right)$
h-WO//(001)YSZ and
 $\left[ {1\bar 21\bar 6} \right]$
h-WO//[100]YSZ. Figure 3(f) shows a typical HRTEM image of h-WO grain in 25WB sample. No clear orientation relationship was formed. The main crystalline WO phase was identified as orthorhombic WO, like in the pure WO thin film (100W), as shown in Figs. 3(g) and 3(h). Only small amounts of WO grains among them were epitaxially grown on the YSZ substrate with (001)o-WO//(001)YSZ and
 $\left[ {\bar 110} \right]$
o-WO//[100]YSZ, as shown in Fig. 3(g). Most of the WO grains were randomly distributed, demonstrating polycrystalline features.
Figure 4(a) shows a typical HRTEM of WO grain from the 25WB sample. A crystal plane with a lattice space of 0.385 nm is parallel to the substrate surface. This structure was also observed in 50WB and 67WB samples. However, this plane can be indexed as the (002) of o-WO or (0001) of h-WO. To discriminate these two phases, many WO grains with this feature were tilted to another zone axis for HRTEM observations. We found that some of these grains in the 50WB sample obtained the typical HRTEM image shown in Fig. 4(b) after tilting 15° in-plane away from the [100]YSZ direction, which was indexed as the [010] zone axis of the o-WO phase. In contrast, other WO grains in the 50WB sample obtained the typical HRTEM image shown in Fig. 4(c), which was indexed as the
 $\left[ {\bar 12\bar 10} \right]$
zone axis of the h-WO phase. The similar results were also observed for other samples, indicating that the o-WO and the h-WO coexisted in 25WB, 50WB, 50WB, and 67WB samples.
(a) Typical HRTEM image of WO grains in 25WB sample; (b) Typical HRTEM image and the corresponding FFT pattern (inset) of some WO grains in 50WB sample shown in (a) after tilting 15° can be indexed as the [010] zone axis of the orthorhombic WO; (c) Typical HRTEM image and the corresponding FFT pattern (inset) of some WO grains in 50WB sample shown in (a) after tilting 15° can be indexed as the
 $\left[ {\bar 12\bar 10} \right]$
zone axis of the hexagonal WO.

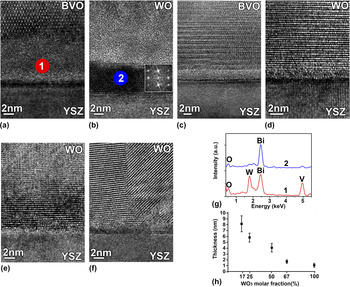
Besides the identification of the crystalline phases in the samples, the interface structures were characterized by HRTEM. A relatively thick amorphous layer was observed between BVO and YSZ in 17WB sample, as shown in Fig. 5(a). However, an intermittent crystalline layer was found in-between the amorphous layer and YSZ substrate in case of the WO/YSZ interface in 17WB sample. The HRTEM image of the interface layer in Fig. 5 (b) can be identified as γ-Bi2O3 (S.G.: I23, a = 10.268 Å). Reference Shuk, Wiemhofer, Guth, Gopel and Greenblatt26,Reference Drache, Roussel and Wignacour27 With the decrease of the BVO in the samples, the thickness of the amorphous layer reduced and the Bi2O3 phase did not form, as shown in Figs. 5(c) and 5(d). In 100W sample, the interface layer became very thin and even disappeared, as shown in Figs. 5(e) and 5(f). To reveal the composition of the interface layer, EDS point analyses were performed from area 1 in Fig. 5(a) and area 2 in Fig. 5(b). The results were given in Fig. 5(g). It can be clearly seen that the amorphous interface layer (area 1) is composed of Bi, V, and W, in contrast the crystalline interface phase (area 2) is mainly Bi element, consistent with the Bi2O3 phase by HRTEM observation. The averaged thicknesses of the amorphous interface layers in different samples were plotted in Fig. 5(h). The thickness decreased from ∼8 nm in 17WB to ∼1 nm in 100W. Such amorphous layers might play an important role to release the mismatch strain between the VHN film and the YSZ substrate. All the information including crystalline phases and epitaxial relationships were summarized in Table I.
Typical HRTEM images of the interface region between the VHN film and substrate. The BVO/YSZ (a) and WO/YSZ (b) interfaces in 17WB sample; The BVO/YSZ (c) and WO/YSZ (d) interfaces in 67WB sample; The WO/YSZ interfaces (e) and (f) in 100W sample; (g) EDS spectra obtained from the area 1 in (a) and area 2 in (b). (h) The averaged thickness of the amorphous layers in all the observed samples.

Summary of the crystalline phases and orientation relationships in all the WO–BVO VHN thin films.

C. Role of interdiffusion and mismatch strain between WO and BVO
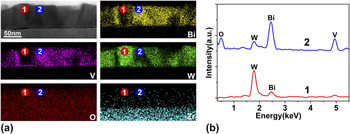
Figure 6(a) shows the EDS maps of the 50WB sample. From the W and V maps, it can be clearly seen that the strong W areas correspond to the weak V areas, indicating that the WO nanopillars were embedded into the BVO matrix. However, in some areas both W and V have similar contrasts, which is a result of WO and BVO overlapping along the electron beam direction. Interestingly, there is discernible contrast in the pure WO area in the Bi map. It suggests that Bi may diffuse into the WO grains, which was confirmed by EDS analyses [Fig. 6(b)] from the WO (point 1) and BVO (point 2) in the EDS maps. It shows strong Bi and V peaks with a small W peak in the BVO spectrum. Here the W may came from the solid solution in BVO as reported in the literature. Reference Berglund, Rettie, Hoang and Mullins28,Reference Luo, Wang, Zhao, Zhao, Li and Zou29 However, the EDS spectrum from the WO exhibits a high W peak with an obvious Bi peak. No clear V peak can be detected, indicating that the Bi signal in the pure WO originated from solid solution rather than overlap of BVO and WO. These results mean that the Bi in BVO is easy to diffuse into the WO and Bi has a relatively high solid solution level in the WO phase. In extreme case, the BWO phase could be formed, for example in 17WB sample.
EDS analyses of the VHN thin films. (a) EDS maps of the 50WB sample; (b) Typical EDS spectra acquired from the WO nanopillar (point 1) and BVO matrix (point 2) in (a).

During the growth of the VHN thin films, the crystal symmetry of each component as well as the mismatch strain among them determines its microstructures. In the case of WO–BVO VHN thin films grown on the YSZ substrate, the situation is much more complicated than the traditional cubic/cubic VHN thin films. Reference Zheng, Wang, Lofland, Ma, Mohaddes-Ardabili, Zhao, Salamanca-Riba, Shinde, Ogale, Bai, Viehland, Jia, Schlom, Wuttig, Roytburd and Ramesh17–Reference Chen, Bi, Jia, MacManus-Driscoll and Wang20,Reference Zheng, Straub, Zhan, Yang, Hsieh, Zavaliche, Chu, Dahmen and Ramesh23,Reference Liu, Liang, Chu, Zheng and Ramesh24 When the monoclinic BVO (001) grown on the YSZ (001) substrate, the in-plane lattice mismatch is about 0.79%, much smaller than 5.33% of orthorhombic WO and YSZ. As a result, BVO is preferential to grow on the YSZ substrate to form the matrix. In addition, the amorphous Bi–V–W mixture prefers to wet the YSZ surface to further decrease the interface energy at the initial stage of the deposition, as revealed in Fig. 5. Such amorphous layers released the mismatch strain between the thin films and the substrate. On the other hand, the mismatch strain at the WO/BVO interface is about −1.6% with respect to the BVO (001). It means that the WO is subject to the tensile strain perpendicular to the substrate surface. Meanwhile, the volume change of WO from the deposition temperature of 600 °C to the room temperature is about −2.14%, whereas it is only −1.78% for the BVO. Reference Rosen, Banks and Post30,Reference Waskowska, Pietraszko and Lukaszewicz31 Thus, when the WO–BVO VHN thin films cooled down from the high deposition temperature to the room temperature, the WO pillars shrank faster than the BVO matrix. Then the WO nanopillars were subjected to the in-plane tensile strain, hence a hydrostatic tensile strain state. Such a strain state plays an important role on the crystalline phases and microstructures.
Furthermore, the BVO and WO targets were sputtered by the pulsed laser beam alternately, these two components mixed and interdiffused during the deposition. Especially, the Bi element is easy to dissolve into the WO, as revealed by the previous EDS analyses. In the BVO dominated VHN thin film (17WB sample), the WO as minor phase even reacted with Bi and formed the BWO phase, as shown in Fig. 3(b). The diffusion depth and content of Bi in WO grains depend on the molar ratio of WO:BVO. In WO-riched samples, only small amount of Bi can diffuse into the surface region of the WO grains. In contrast, for the BVO-riched samples, large amount of Bi diffuse into the whole WO grains, even form the BWO phase.
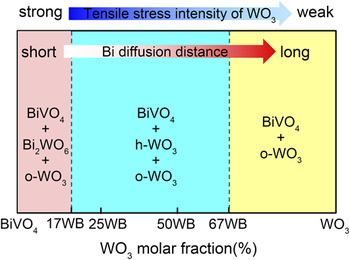
The crystalline phases of WO were investigated extensively. Reference Zheng, Ou, Strano, Kaner, Mitchell and Kalantar-zadeh32–Reference Kalhori, Porter, Esmaeily, Coey, Ranjbar and Salamati35 It is well known that the orthorhombic WO is the stable phase during 330–740 °C. The hexagonal WO phase, as a metastable phase, can only be stabilized at 500 °C and higher. Reference Ramana, Utsunomiya, Ewing, Julien and Becker36 However, the h-WO was found to be existed in our WO–BVO VHN thin films. It means that the h-WO phase formed at the deposition temperature (600 °C) was stabilized during the cooling process. Actually, the density of h-WO is 6.424 g/cm3, much smaller than 7.149 g/cm3 of o-WO. Under the hydrostatic tensile strain state, the low density h-WO phase is favorable energetically. In addition, the radius of Bi3+ is 103 pm, much larger than 62 pm of the W6+. When the Bi3+ dissolved into the WO, the volume of the crystal structure is expanded. Thus, h-WO is stabilized by the Bi doping effect, as pointed out in the literature Reference Szilágyi, Madarász, Pokol, Király, Tárkányi, Saukko, Mizsei, Tóth, Szabó and Varga-Josepovits37 that some ions or molecules are needed in the hexagonal channels to maintain a hexagonal tungsten oxide structure. The combination of these two factors made the metastable h-WO stabilized at the room temperature. With the increase of the WO in the samples, the diffusion distances of Bi ions into the WO grains were increased while the tensile strain was decreased. As a result, the h-WO and o-WO can coexist and further pure o-WO was formed. The evolution of the crystalline phases and microstructures was schematically summarized into a pseudobinary phase diagram, as shown in Fig. 7, specifically for the WO–BVO VHN thin films on the YSZ substrate.
Schematic of the pseudobinary phase diagram of WO–BVO VHN system on YSZ (001) substrate.

In the WO–BVO VHN thin films, both components have a good match of the band gap and band energy for PEC water splitting. The BVO matrix plays a main role to absorb the visible light to produce the electron–hole carriers. Then the photo-excited electrons move from BVO to WO, while the photo-generated holes easily flow from WO to BVO. Such an enhancement of charge transport properties should lead to a significant suppression of electron–hole recombination and result in a great enhancement of the photoactivity, as confirmed by the photoluminescence spectroscopy. Reference Van, Do, Chen, Tzeng, Tsai, Song, Liu, Lin, Chen, Wu, Luo, Chou, Huang, Hsu and Chu15 Therefore, the WO molar fraction of WO–BVO is a key parameter to tailor its photoelectrochemical properties. According to the proposed WO–BVO VHN pseudobinary phase diagram, the composition ratio near 17WB might be a good combination, where BVO, BWO, and WO coexist in the sample. It was reported that both BiVO4/Bi2WO6 heterojunction and Bi2WO6/WO3 heterojunction exhibit good photoactivities. Reference Ju, Wang, Li, Fan, Ai, Zhang and Wang38,Reference Gui, Zhang, Chang and Yu39 A combination of the BiVO4/Bi2WO6 and Bi2WO6/WO3 heterojunctions may obtain excellent PEC properties, consistent with the highest incident photo-to-current efficiency of WO–BVO nanocomposites with 10 vol% WO. Reference Van, Do, Chen, Tzeng, Tsai, Song, Liu, Lin, Chen, Wu, Luo, Chou, Huang, Hsu and Chu15
IV. CONCLUSION
In summary, a series of WO3–BiVO4 nanostructure thin films with 17, 25, 50, 67, and 100 mol% WO3 grown on the YSZ (001) substrate were investigated by a combination of XRD, SEM, TEM, and EDS. The monoclinic BiVO4 formed the matrix with clear epitaxial relationships, whereas the WO3 crystallized into nanopillars embedded into the matrix. In 17WB sample, orthorhombic Bi2WO6 was formed with residual o-WO3. However, the h-WO3 phase and the o-WO3 phase coexisted in other composite samples. And only some of the WO3 grains exhibit specific epitaxial relationships with the YSZ substrate. The pure WO3 thin film even became polycrystalline. The thin amorphous layer at the film/substrate interface indicates that the mismatch strain between films and substrate is released. Consequently, the hydrostatic tensile strain due to thermal expansion mismatch between BiVO4 and WO3 as well as the diffusion of Bi into the WO3 stabilized the metastable h-WO3, which determined the microstructures and the final PEC properties of the WO3–BiVO4 thin films. Such information shed the light to design the microstructures of the WO3/BiVO4 heterojunctions and improve its photoactivity.
ACKNOWLEDGMENTS
This work was supported by the National Key Project for Basic Research of China (Grant Nos. 2014CB921104 and 2013CB922301), NSFC under Grant No. 51572085, and Natural Science Foundation of Shanghai (16ZR1409500).