China's stock market meltdown made headline news around the world in the summer of 2015. Its impact reverberated across the globe, putting a dent in stock markets in Asia, Europe and America. While the causes of the panic are complex and multiple, one of the deepest fears behind the sell-off was the impression that export-manufacturing – the engine of China's hyper-growth over the past three decades – had hit the doldrums.Footnote 1 Manufacturing output fell worryingly to a three-year low in 2015 and continued to shrink in 2016.Footnote 2
While the aggregate picture appears bleak, it must be stressed that only a thin geographic slice of China, concentrated in the coastal cities, makes up the factory of the world. In 2006, the five coastal provinces of Guangdong, Jiangsu, Zhejiang, Shanghai and Shandong accounted for 76 per cent of the value of total exports.Footnote 3 Undoubtedly, manufacturing has taken a hit in coastal China. Factor and labour costs have risen rapidly, eroding the profits and competitiveness of export manufacturers. This dire situation, reflected in gloomy statistics and media reports, has fanned worries about the weakening of the entire Chinese economy.
The ongoing hype about the manufacturing crisis on the coast, however, has obscured discussion in both scholarly and popular literature of a significant new trend: the migration of capital and investment from wealthy coastal areas into poorer central and western provinces, beginning in the early 2000s.Footnote 4 This phenomenon is termed “industrial transfer” (chanye zhuanyi 产业转移) in Chinese, which is much harder to define and quantify than industrial output because transfer (or relocation) is dynamic and multifaceted. Nevertheless, one indicator of the scale of industrial transfer is “domestic investment” (shengwai zijin 省外资金), also a relatively new term. Official statistics indicate a steady flow of domestic or interprovincial investment from the coastal to the inland regions. To illustrate, in 2008, the combined value of domestic investment that flowed into the five central provinces of Jiangxi, Henan, Hunan, Hubei and Anhui was 836 billion yuan. In 2015, seven years later, it ballooned to 3,760 billion yuan.Footnote 5 This was 2.5 times the amount of foreign direct investment (FDI) that poured into China in the same year. Furthermore, this comparison only includes domestic investment in five central provinces; it excludes the western provinces and industrial transfer within the coastal region.Footnote 6
Despite the fact that domestic investors are taking on an economic role as formidable as that of foreign investors in the earlier decades, the shift has received scant mention in the scholarly literature and media.Footnote 7 The purpose of this article is to lay a macro-historical foundation for further empirical investigation into the trend of industrial transfer. I address the following basic questions. What were the historical processes leading up to industrial transfer today? Why did this pattern emerge only in the early 2000s and not earlier? What are the economic and regulatory forces that have accelerated industrial transfer? What are the implications of industrial transfer for the reshaping of China's national competitive advantage? Addressing these questions will help us to see the big, evolving picture of China's economy and enable us to identify micro-level questions for study.
From a comparative perspective, China's industrial transfer is unique in that it manifests a domestic version of the “flying geese” model. Coined by Japanese economist Kaname Akamatsu, the term “flying geese” refers to a tiered system of development in Asia.Footnote 8 Like the lead goose in a V-shaped formation, Japan was the first to launch late industrialization and hence became the most advanced economy in the region. It occupied the highest end of the regional supply chain, while other nations took on lower-level production. In exchange, lead economies transferred capital and technology to laggard economies, thereby assisting them in the process of industrial catch-up. In other words, the flying geese model describes a division of labour that can generate mutual benefits among unevenly endowed nations.
China's experience departs from the original theory of flying geese in three significant ways. First, China displays a pattern of differentiated production and industrial transfer across sub-national regions within a nation, rather than across nations within a region. This occurs because China's vast size renders it more like a continent than a country. Compared to other countries in East Asia, such as Japan and South Korea, China is many times larger and displays far wider sub-national inequality. This calls for a rethinking of Michael Porter's classic theory of national competitive advantage. In his influential book, The Competitive Advantage of Nations, Porter names four factors that affect national competitiveness in the global market: endowed factors, home demand for products and services, a structure of supporting industries, and a structure of domestic enterprises.Footnote 9 Treating nations as homogeneous, Porter's theory completely ignores regional economic relations.Footnote 10 For large countries like China, promoting regional complementarity and niches – in addition to competitionFootnote 11 – is key to national competitive advantage.Footnote 12
Second, in China, cross-national and sub-national transfers of industries are sequentially linked. Following market liberalization in 1978, scores of factories from East Asia, especially Hong Kong and Taiwan, moved to China's coastal areas to exploit the region's competitive advantages in low-cost, labour-intensive, export-oriented manufacturing, which fuelled rapid industrialization and trade expansion on the coast.Footnote 13 But while coastal provinces grew wealthier by leaps and bounds, central and western provinces lagged behind by several orders of magnitude.Footnote 14 By the 2000s, the coastal cities switched roles, from recipient to investor, bringing opportunities of late industrialization to laggard provinces.
Third, departing from the original flying geese model, which highlighted only the transfer of capital and technology, China is now experiencing a transfer of government policies and practices, in addition to capital, across regions. While coastal locales today can afford to pick winners and resolve to expel low-end industries, inland governments have little choice but to welcome virtually all investment projects, regardless of quality. Interestingly, inland governments have also belatedly adopted aggressive investment promotion tactics that were practised but abandoned on the coast ten to twenty years ago.Footnote 15
In other words, within China, we see a delay in the diffusion of government practices across regions. This lagged pattern has not been picked up in the existing literature on policy diffusion which assumes that any experiment, once proven successful, can be replicated across the country simultaneously.Footnote 16 My study, on the other hand, reveals that the replication of government practices and experiments is dependent upon economic conditions, which vary across regions and change over the course of development. Strategies that worked on the coast did not work in the interior during the 1980s and 1990s, as inland governments simply could not compete against coastal cities in attracting foreign investment. It was not until the mid-2000s, when coastal investors turned inward, that interior regions received a new lease of growth opportunity. Therefore, future studies of policy diffusion must take into account the effects of economic conditions, as well as sequence and timing, on policy replication. What works in one region may not work in other regions until a later point in time.
The rest of my discussion proceeds as follows. The first section traces the evolution of cross-national industrial transfer from East Asia to coastal China in the 1980s and 1990s to domestic industrial transfer from the 2000s onwards. The next two sections zoom in on cost and regulatory pressures that push traditional manufacturers to relocate from the coast. The third section simultaneously reveals delayed institutional changes that have occurred within local governments in the interior as well as different levels of selectivity and policies made with regard to evicting low-end industries. Finally, I conclude with the implications of industrial transfer for the remaking of China's competitive advantage, and offer suggestions for future firm-level research on industrial transfer.
The Scale of Industrial Transfer
Estimating the scale of industrial transfer is tricky because, according to officials at the National Development and Reform Commission (NDRC), there is no consensus, even among central planners and policy experts, on the definition of “transfer” (zhuanyi 转移).Footnote 17 Compared to output, transfer is a dynamic, multifaceted concept, which makes measurement difficult. A common translation of chanye zhuanyi is “industrial relocation,” but this term fails to capture the fact that transfer can take many forms at the firm level, including the establishment of new production facilities, the creation of new distribution chains and research and development facilities, outward investment, and the physical relocation of corporate headquarters to another province or city within the home province.Footnote 18 Relocation is only one aspect of transfer.
Constrained by the dynamic, multifaceted nature of industrial transfer, systematic and consistent data are lacking in China's official yearbooks. Nevertheless, multiple sources and case studies point to a dramatic movement of investments from the coast to the interior. One indicator is “beyond-province investment” (shengwai zijin), i.e. investment from beyond a given province but within national borders and excluding Hong Kong, Taiwan and Macau. More simply, this term measures domestic investment.
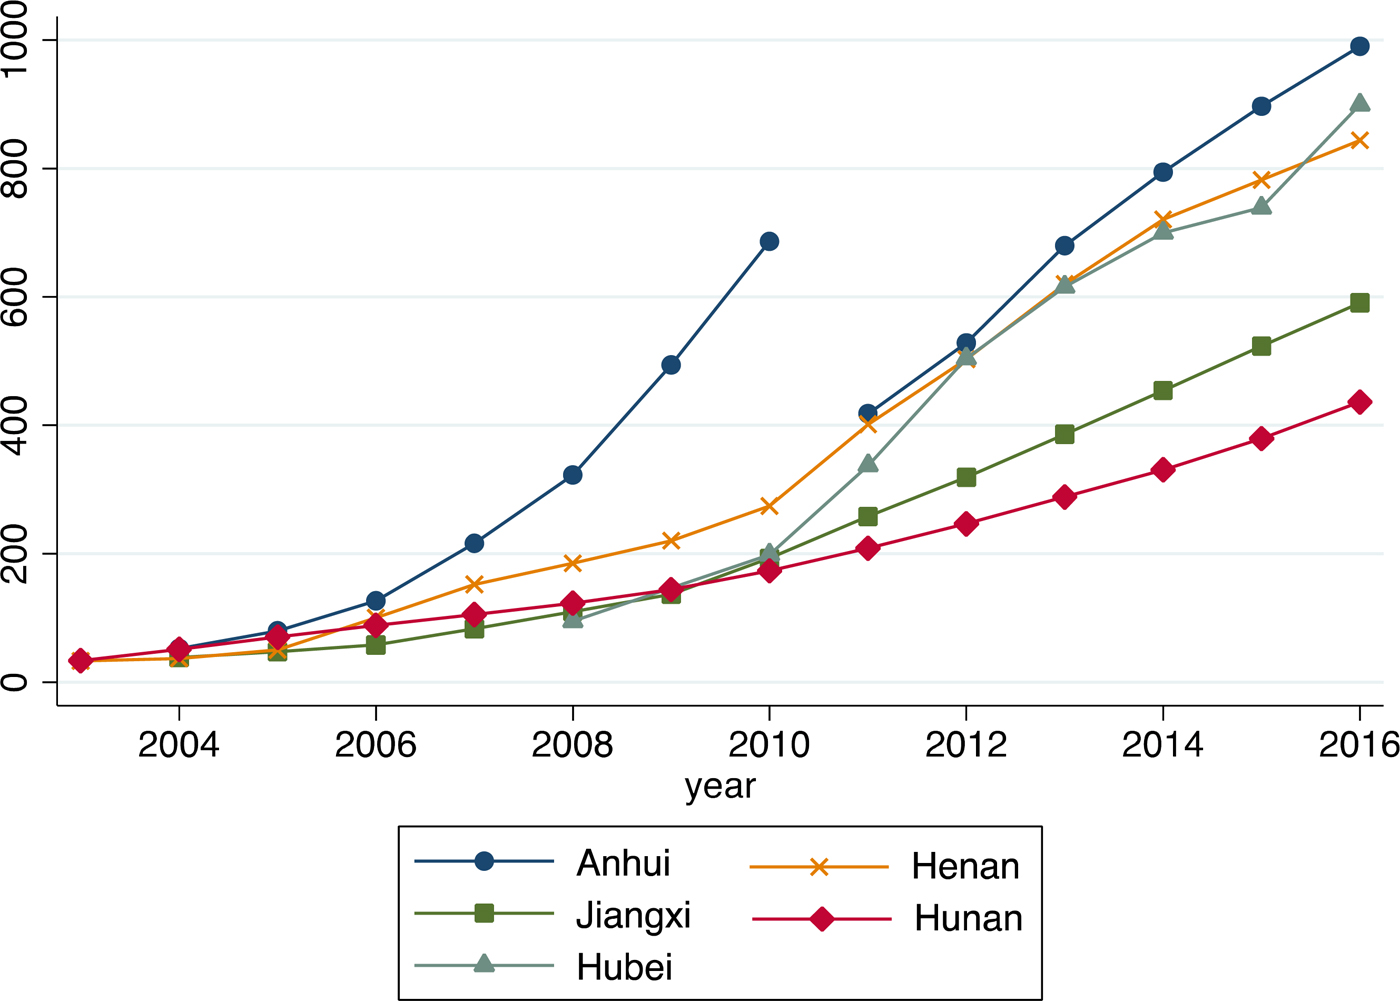
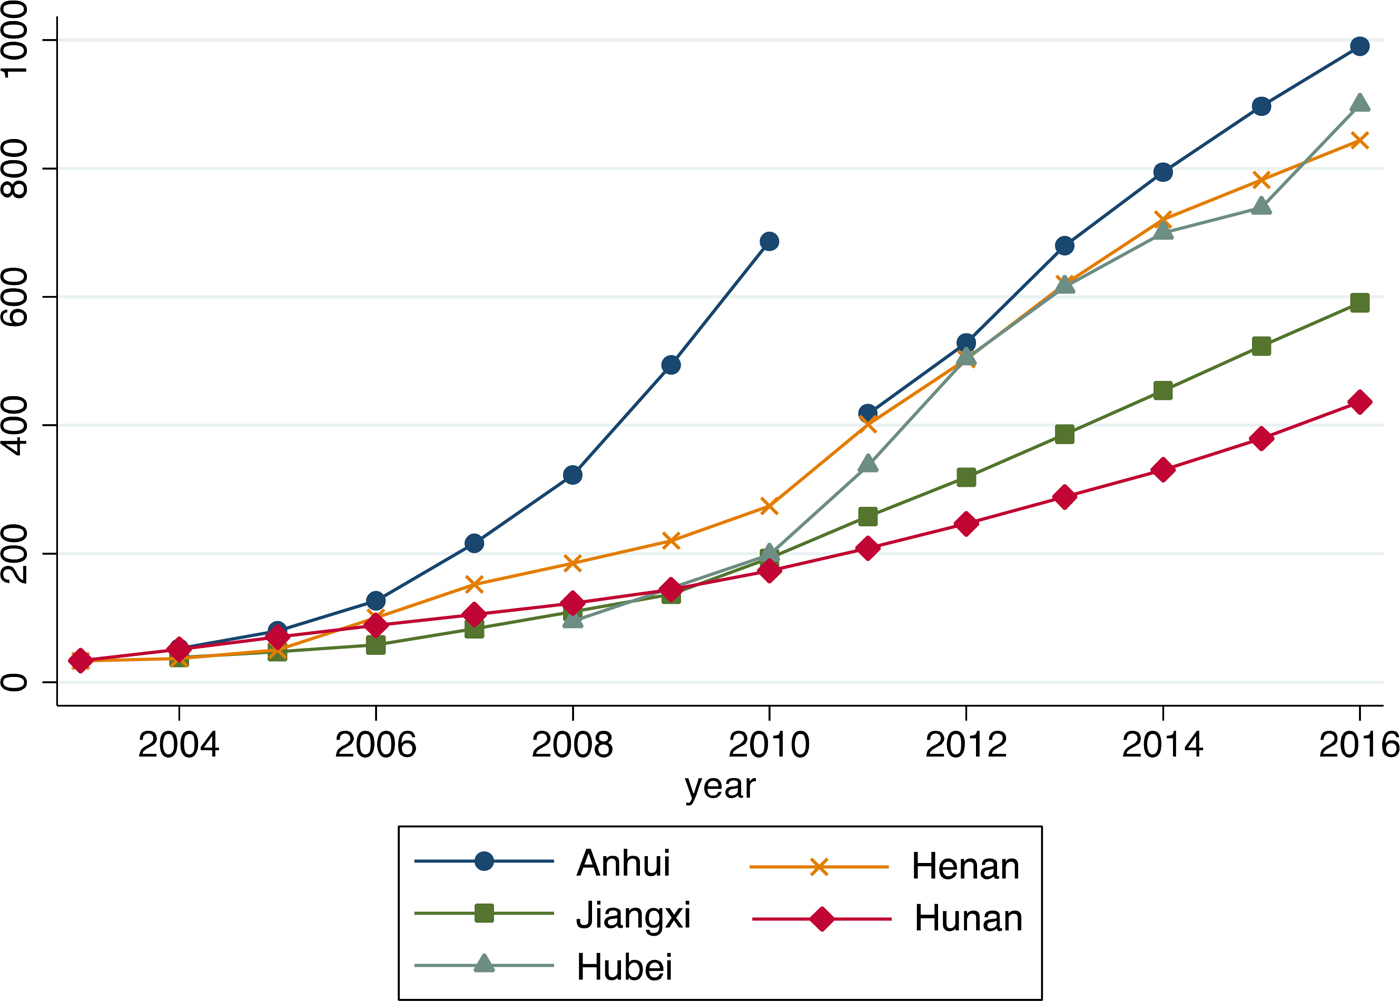
Since 2004, the central provinces have seen a steady rise in domestic investment, as illustrated in Figure 1. Domestic investment only appeared in the annual work reports of these provinces from the early 2000s onwards, indicating that it is a new occurrence. In Hubei province, this terminology appeared later, in 2008. In terms of the total volume of domestic investment, Anhui province held the top spot in the central region.
Domestic Investment in Five Central Provinces (billion yuan), 2003–2016
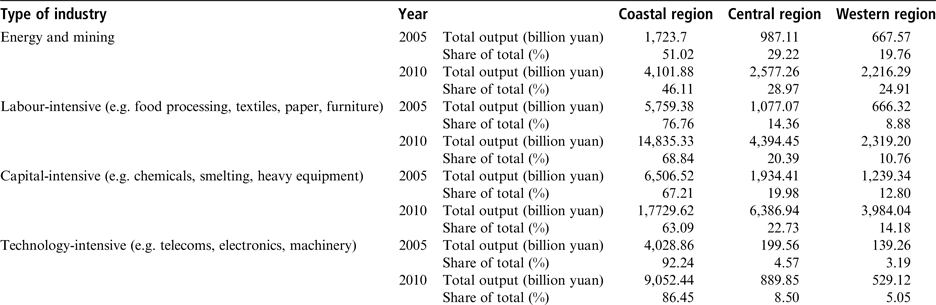
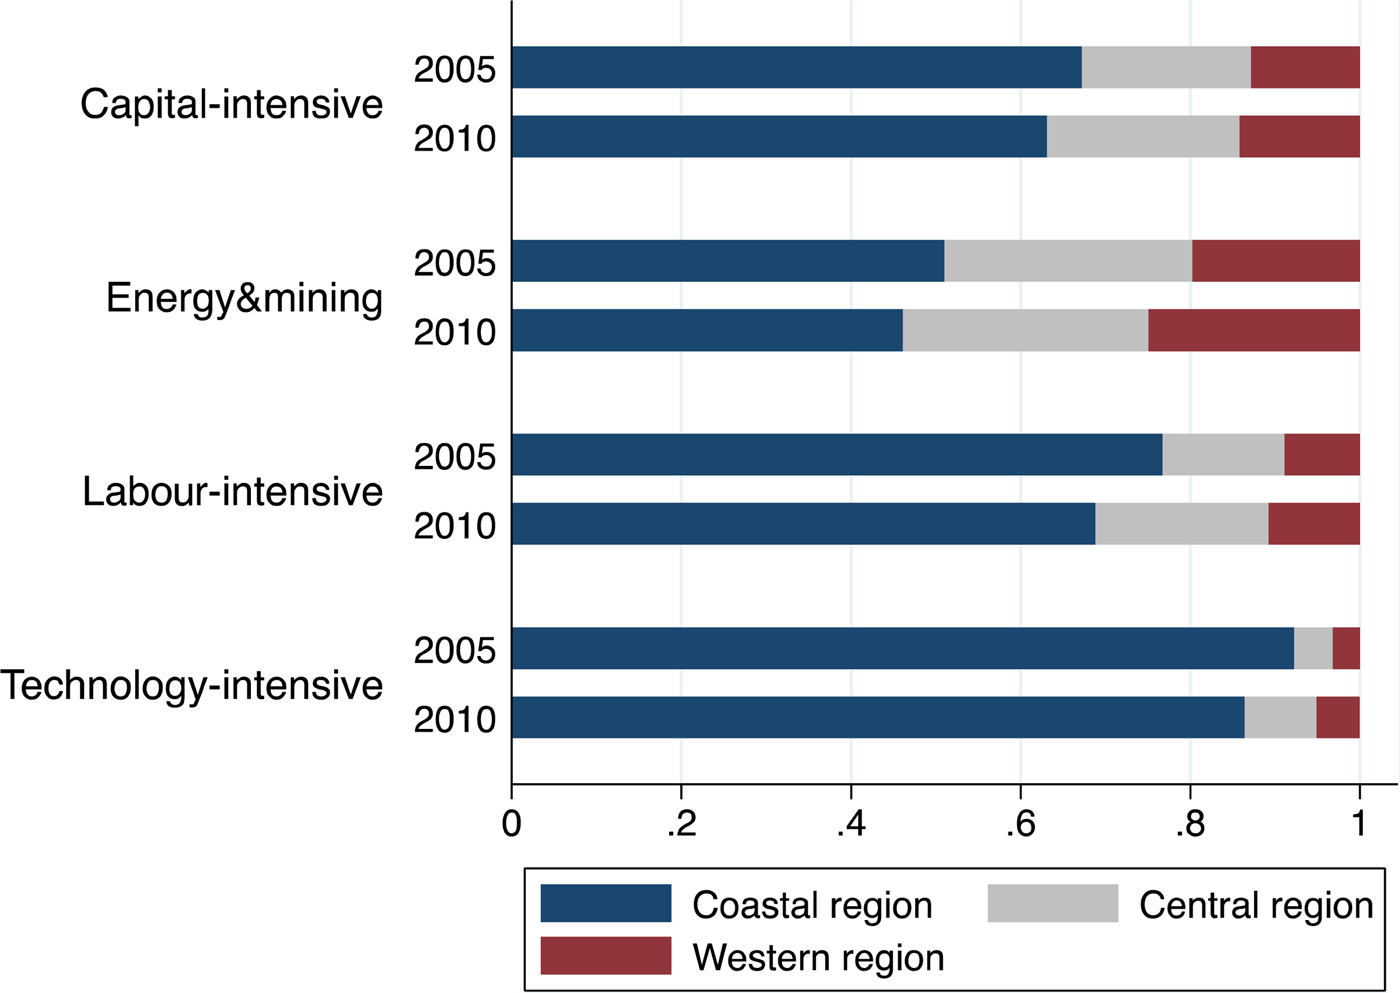
Temporal shifts in the geographic distribution of manufacturing provide another indication of industrial transfer. Drawing on a study by the NDRC, Table 1 shows a consistent decline in the coastal region's geographic share of manufacturing vis-à-vis central and western regions. This decline occurred from 2005 to 2010 across all four major industries: energy and mining, labour-intensive, capital intensive, and even technology-intensive sectors (such as telecommunication products and electronics).
Geographic Share of Manufacturing in 2005 versus 2010

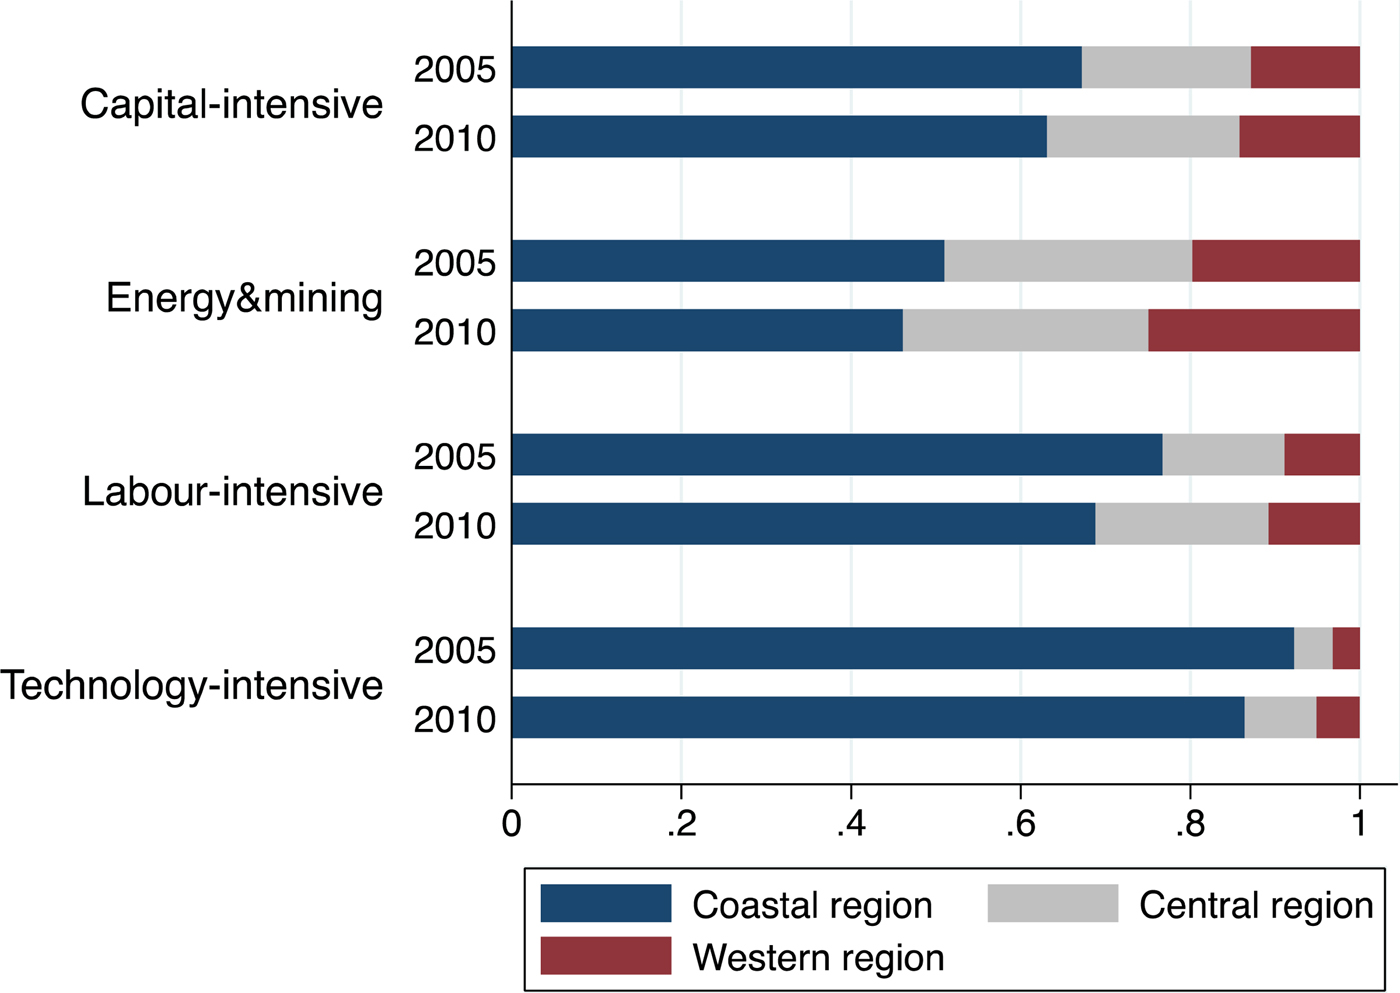
Figure 2 illustrates the temporal and geographic patterns in Table 1. The central and western regions’ share of manufacturing increased as the coastal region's share declined. In 2010, central provinces registered a larger share of manufacturing in labour-, capital-, and technology-intensive industries than western provinces. Coastal provinces accounted for less than half of China's energy and mining production, and although they continue to dominate in technology-intensive industries, even this share has declined over time.
Geographic Share of Manufacturing in 2005 versus 2010
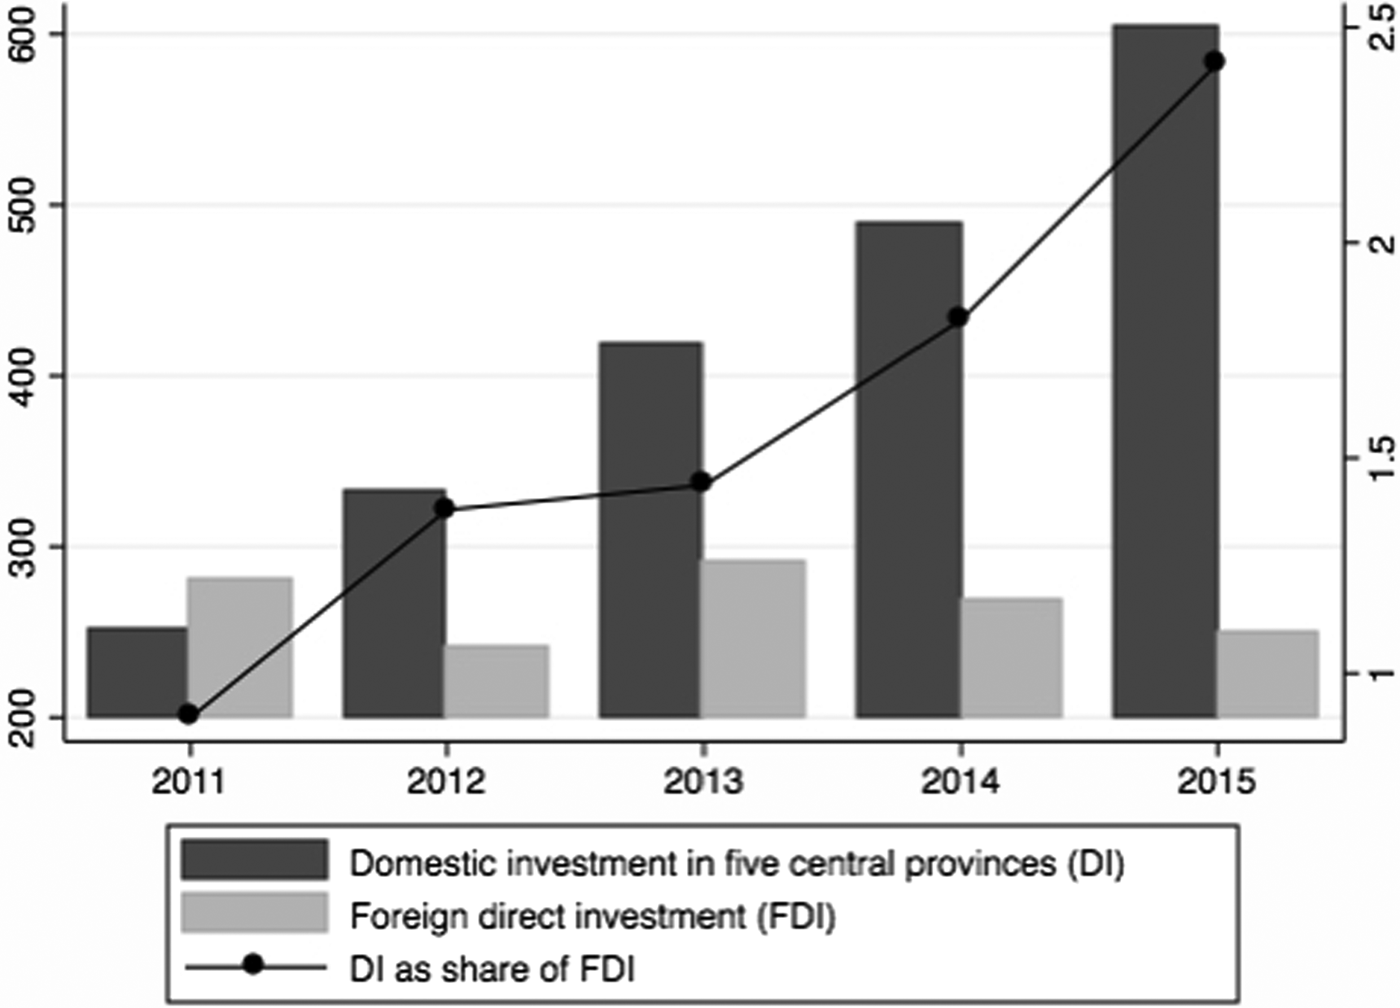
Importantly, the scale of domestic investment has far outstripped that of FDI in China, a fact that has received surprisingly little attention. Figure 3 compares the volume of domestic investment in five central provinces (Anhui, Jiangxi, Hebei, Hunan and Henan) to that of FDI that entered China from 2011 to 2015. During this period, FDI fluctuated within a narrow band between US$240 billion and US$300 billion, whereas domestic investment in the central region surged from US$251 billion to US$603 billion. By 2005, domestic investment in this region was almost 2.5 times that of FDI in all of China combined. Clearly, the role of domestic investment in China's current and future economic development demands attention.
Domestic Investment in Five Central Provinces versus Foreign Direct Investment in China (US$ billion), 2011–2015

Historical Processes Leading up to Industrial Transfer
Industrial transfer did not appear out of the blue. Rather, the seeds of this process may be traced back to central policies since market opening. This section traces the evolution of regional development policies and patterns during the following periods: 1978–1993; 1993–2000; 2000s; and 2010 onwards. One common thread that emerges from this historical review is that the central government did not foresee, let alone engineer, industrial transfer at the beginning of reform. That said, earlier central policies unintentionally contributed to industrial transfer, first, by widening regional inequality over time, and second, by expanding transportation infrastructure in the interior through fiscal transfers, which later enabled industries to move inland. It was not until 2010 that industrial transfer was officially elevated to the status of a national development strategy.
1978–1993: partial market liberalization
From the 1950s to the 1970s, Mao Zedong 毛泽东 chose to promote heavy industrialization in the interior and suppress growth on the coast. Fearing foreign invasion, Mao believed it was necessary to create autarkic regions for self-sufficiency to defend China. The central government funnelled industrial projects and funds into interior provinces like Hubei and Sichuan, but most of these projects either failed or were left unfinished.Footnote 19 As Justin Lin underscores, Mao's policies were destined to fail because they defied natural comparative advantages.Footnote 20
Once Deng Xiaoping 邓小平 took over the reins and announced the “reform and opening” in December 1978, Mao's policies were reversed. Deng encouraged the coastal regions to leverage their geographic proximity to global export markets to attract foreign investment and thereby stimulate industrialization. The leadership approved the establishment of special economic zones (SEZs) in several coastal cities, including Shenzhen 深圳, Xiamen 厦门 and Zhuhai 珠海. These zones attracted the first waves of FDI, predominantly from Hong Kong, Taiwan, Macau, and later, Singapore, South Korea and Japan.Footnote 21
During the 1980s, central planners in Beijing urged the regional governments to develop economic specializations according to their factor endowments, which were dictated primarily by location and availability of natural resources. During the seventh Five-Year Plan (1986–1990), the central government enjoined the regions to “leverage their respective advantages.” Specifically, the seventh Plan stated that the coastal regions should engage in “the restructuring of traditional industries, new industries and consumer goods production,” the central regions should focus on energy, construction and mining, and the western regions should specialize in agriculture production and processing.
During this period, central policies were overtly biased towards letting the coastal region “get rich first,” to use Deng's phrase.Footnote 22 The interior regions were of course unwilling to accept a disadvantageous arrangement. Owing to the dual-track pricing system of the 1980s of under-priced raw materials and overpriced processed goods, each province sought to prevent the outflow of raw materials from its borders and to maximize the production and export of manufactured goods to other provinces.Footnote 23 This resulted in a “commodity war,” marked by local protectionism, duplicative industries and over-capacity.Footnote 24
1993–2000s: fully fledged market reforms
The year 1993 proved to be a structural break in China's reforms.Footnote 25 The post-Deng leadership under President Jiang Zemin 江泽民 and Premier Zhu Rongji 朱镕基 announced the Party's historic decision to shift from partial to fully fledged market liberalization. Market liberalization forced uncompetitive enterprises protected by local governments to shut down, thus ushering in a wave of industrial consolidation.Footnote 26 Soon after, the coastal region consolidated its advantage in processing industries and services,Footnote 27 while the central and western regions were relegated to supplying raw materials and cheap labour to the coast. From then on, the economic gap between the coast and the interior grew even wider.
2000s: central campaigns to redistribute wealth to the interior
Although the central leadership expressed concern about growing regional disparities in as early as the 1990s,Footnote 28 it did not make a decisive policy shift from privileging the coast to redistributing wealth to the disadvantaged interior until the tenth Five-Year Plan (2001–2005). During the ninth NPC in 1999, President Jiang Zemin proposed the “great western development” initiative,Footnote 29 a campaign to stimulate investment and economic growth in impoverished western provinces. Massive fiscal transfers from the central government poured into the west to finance infrastructure projects. But, as attention shifted westwards, growth in the central regions fell behind the west.Footnote 30 To make up for this neglect, Premier Wen Jiabao 温家宝 inaugurated the “rise of the central regions” in 2004, a campaign to narrow disparities between the coastal and central regions.Footnote 31
When these campaigns were formulated in the early 2000s, the focus was on helping the central and western regions catch up economically through fiscal grants and infrastructure construction, but not through industrial transfer.Footnote 32 At the time, industrial transfer had not been elevated to the highest policy agenda. Indeed, the idea of pairing coastal businesses with inland destinations had not entered the minds of the policymakers. Nevertheless, infrastructure investment during this period paved the physical foundation for subsequent industrial migration by connecting inland and coastal economies through the construction of highways, high-speed railways, bridges and other facilities.Footnote 33
Meanwhile, as the central authorities adjusted their policies in response to widening disparities, changes in market conditions were unfolding across the coastal cities. As the coast industrialized and prospered, factor inputs (for example, electricity, land and manufacturing facilities) spiked in cost. Most significantly, the cost of labour, which used to be abundant and cheap, increased as the pool of young workers shrank.Footnote 34 Simultaneously, local governments in the coastal regions grew increasingly hostile towards low-end, labour-intensive manufacturing as they sought to make room for more valuable and non-polluting investments (see the next section). In other words, by the 2000s, low-end manufacturers on the coast felt the same market and policy pressures that had previously driven East Asian producers to coastal China, following market liberalization.
2010 onwards: industrial transfer elevated to national development strategy
Central planners in Beijing did not plan in advance, much less engineer, the ongoing wave of domestic investment and industrial migration. Instead, they reacted to it. In 2010, the State Council issued a circular entitled “Guiding principles on industrial transfer to the central and western regions” (hereafter, Circular).Footnote 35 In contrast to the policies of the 1980s that endorsed an asymmetrical economic relationship between the coastal and the interior regions, the 2010 Circular aimed to foster mutual gain between unequally endowed regions.
From a national strategic perspective, central and western regions offer abundant natural resources, low factor costs and huge room for domestic market growth. The interior region's take-over of coastal industries will not only accelerate late industrialization and urbanization but will also facilitate economic restructuring and upgrading on the coast. This strategy is termed “emptying the cage to change the bird” (tenglong huanniao 腾笼换鸟) and, in principle, will refine the division of labour within China.
Additionally, central policymakers felt it was necessary to evolve China's niche in the international market. The 2008 global financial crisis, which first unfolded in the United States, inflicted a painful lesson upon Chinese leaders. Manufacturing orders from the United States and other developed economies abruptly slumped, hitting low-end export manufacturers on the coast especially hard. These producers, who made wafer-thin profits, could not survive the sudden drop in demand. In the first half of 2008, it was estimated that 67,000 factories shut down leaving millions of workers without jobs. The crisis threatened to plunge the economy into recession and spark political unrest.Footnote 36
In desperation, China's leadership responded with an unprecedented fiscal stimulus package totalling 4 trillion yuan. The package plugged the recession temporarily but left distorting downstream effects on the economy, and in particular, a frenzy of local state borrowing that has led to the current financial bubble.Footnote 37 The 2008 crisis alerted the leadership to the dangers of continued reliance on the low-cost export manufacturing that is concentrated on the coast. They also saw the urgency of buffering China's domestic economy from the vicissitudes of the global market. This experience is likely one motivating factor behind the “belt and road” plan to diversify the sources of China's growth.
Following the State Council's 2010 Circular was a host of concrete ministerial-level policies to promote industrial transfer. Important ministerial bodies came on board, including the NDRC, Ministry of Commerce, and Ministry of Industry and Information Technology. Once the Circular was issued, the central government established several “recipient of industrial transfer model zones” (chengjie chanye zhuanyi shifanqu 承接产业转移示范区) in selected cities in the central region. Like special economic zones in the past, these zones received a comprehensive package of benefits that included preferential policies from the centre, infrastructure funds, loans, waiver of interest payments, priority land quota allocation, and priority approval of targeted investment projects.Footnote 38
In short, the processes leading up to industrial transfer today may be summed up in the following steps: market liberalization in 1978 → influx of foreign investment (particularly from East Asia) to coastal China, stimulating early industrialization and growth on the coast → as coastal markets grew and became saturated, costs rose and local regulations stiffened→ coastal manufacturers pressured to migrate and invest inland → late industrialization and growth spurts in parts of central and western China.Footnote 39
A Closer Look at Cost Pressures
Having outlined the macro historical processes leading up to domestic industrial transfer in recent years, this section now zooms in on the cost pressures that confront coastal manufacturers. In the past decades, manufacturers in China served as outsource manufacturers for major retailers in wealthy capitalist economies. Traditionally, the manufacturers produced light consumer items like textiles, shoes, furniture, paper and toys, using low costs as their competitive advantage. Intense competition among producers kept profits thin. Hence, export manufacturing is highly sensitive to cost pressures, especially in land and labour.
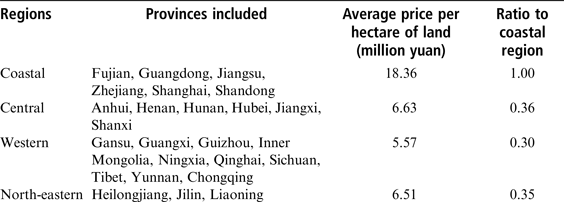
In China, land cannot be sold to private parties; instead, businesses can lease the right to use parcels of land by bidding for and paying a one-off land use fee (tudi churangjin 土地出让金).Footnote 40 Table 2 compares the average price per hectare of land in 2011 across four major regions – coastal, central, western and north-eastern – according to the amount of land use fees collected. The average price of land in the coastal region, 18.36 million yuan per hectare, is three times higher than in the other regions. Within the coastal region, there is also wide variance. Land is most expensive in Shanghai, costing an average of 45.51 million yuan per hectare, making the city prohibitively expensive for building factories.
Average Land Prices across Regions, 2011
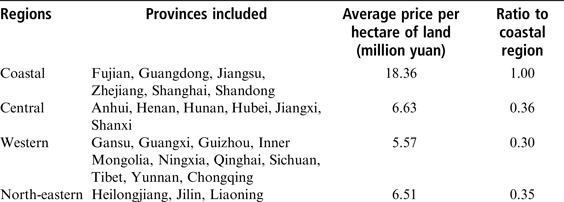
Source: Author's calculation from China Land Resources Yearbook.
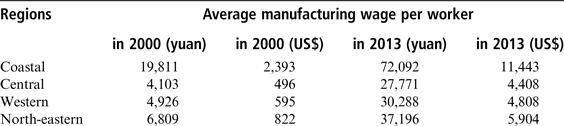
Next, consider the increase in the cost of labour from 2000 to 2013, as detailed in Table 3. Across the regions, the coast consistently registered the highest manufacturing wage. Converted to US dollars, in 2000 the average annual wage on the coast was US$2,393; by 2013, this had grown to US$11,443. Compare this rate to the United States, where the average hourly wage of manufacturing workers was US$24.34 in 2013.Footnote 41 On the basis of an eight-hour working day and 20 work days per month, the average annual wage adds up to US$46,732. Evidently, even though the cost of labour in coastal China was only a quarter of that in the US, the immense labour-cost advantage that China's coastal cities used to boast has shrunk drastically within a short span of 13 years.
Average Manufacturing Wage across Regions, 2000 versus 2013
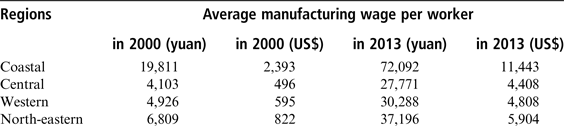
Source: Author's calculation from China Labour Yearbook 2001; 2014.
Note: Following the World Bank Indicator, the exchange rate was 6.2 yuan to US$1 in 2013, and 8.3 yuan to US$1 in 2000. http://data.worldbank.org/indicator/PA.NUS.FCRF.
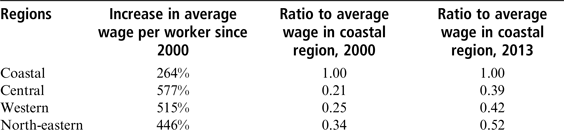
Table 4 further summarizes a comparison of the average manufacturing wage across regions and over time. On average, wages in China have increased by 450 per cent from 2000 to 2013. During this time, wages in the coastal region increased by 264 per cent. This rate of increase was actually less than it was for the central (577 per cent), western (515 per cent), and north-eastern (446 per cent) regions. Indeed, during my fieldwork and in interviews conducted in the central provinces of Hubei and Jiangxi, local officials lamented that wage costs were on the rise, even in inland China.Footnote 42 In 2000, the average manufacturing wage in the central, western, and north-eastern regions was 21 per cent, 25 per cent, and 34 per cent, respectively, of that on the coast. Thus, for coastal factories, relocation to the interior provinces still provided attractive cost savings. However, the cost gap between the coast and the other regions has narrowed since 2000. By 2013, the average wage in the central, western, and north-eastern regions increased to 39 per cent, 42 per cent and 52 per cent, respectively, of the average wage in the coastal region.
Comparison of Average Manufacturing Wage across Regions and over Time
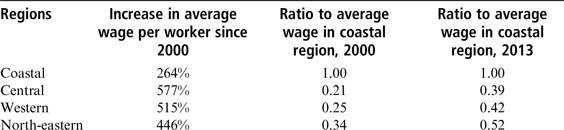
These numerical trends point both to the economic promise and perils of industrial transfer within China. On the one hand, there remains a significant gap in factor costs between the coastal and interior regions, making it potentially cost-effective for coastal factories to transfer production inland. Furthermore, the central government has recently tried to shift the sources of economic growth from export and investment to domestic consumption.Footnote 43 Some coastal producers relocate inland to capture growing consumer markets in the interior. On the other hand, the cost advantage of the interior vis-à-vis the coast is shrinking. Even in the central, western, and north-eastern provinces, the supply of blue-collar workers is declining. This stems both from China's one-child policy and from increased university enrolment among young workers. Additionally, as China's workforce enjoys more political freedom and exposure to ideas about labour rights, it is also becoming increasingly assertive, as is evident from the high-profile labour protests in recent years.Footnote 44
A Closer Look at Policy Pressures
While the issue of cost pressures is amply reported in the media, it is less known that policies and regulations made by local governments constitute another push-or-pull factor for manufacturers. Since the launch of market reforms, local governments have played a conspicuously active role in local development, prompting some observers to characterize China as a local variant of the East Asian developmental states.Footnote 45 Yet, although local governments in China are generally pro-growth, they do not pursue the same types of growth simultaneously. Nor do they employ identical development strategies. Rather, as I will show here, the content of local development policies, including targets of investment recruitment and eviction, varies tremendously across regions and evolves over time.
In a separate work, I document the evolution of industrial promotion policies among locales on the coast and in the interior.Footnote 46 Briefly described, in the years following 1993 (when the Party announced the decision to pursue fully fledged market reforms), local governments in the coastal region were keen to attract any type of investment, regardless of sector, value or complementarity. During the early years of market-building, the focus of these local governments was on maximizing the quantity, rather than quality, of growth. Over time, however, as investments poured in and markets expanded, coastal local governments became less financially desperate and increasingly selective in the quality of investment they sought to attract. Today, these governments enact high entry barriers for manufacturing projects. Many go further to implement concrete, forceful policies to expel low-end, polluting industries from their jurisdiction. In other words, the policy feature of “selecting winners” that defined developmental states in East Asia was absent in coastal China when markets first opened and only subsequently evolved.
As coastal governments have become selective, inland locales, on the other hand, are currently on the receiving end of an influx of domestic investment coming from the coast, particularly industries that are expelled by coastal local governments. This burst of new opportunities has stirred inland local governments into an ongoing frenzy to attract domestic investment, dubbed “investment fever” (zhaoshang rechao 招商热潮).Footnote 47 My research in Hubei and Jiangxi found that starting from the mid-2000s, local governments assigned investment recruitment targets to all agencies within the party-state apparatus, including to non-economic organizations like the Women's Federation.Footnote 48 That is to say, all local bureaucrats must participate in recruiting investors, a practice that prevailed in coastal cities during the early decades of reform. One marked difference is that for inland locales, domestic investors from the coast, rather than foreign investors from overseas, are the prime targets.
In other words, inland governments today are belatedly replicating the developmental approach adopted in the coastal region from the 1980s through to the early 2000s. Coastal locales abandoned such tactics of en masse, aggressive and indiscriminate investment promotion as their markets grew and became saturated. In laggard provinces like Hubei and Jiangxi, however, local governments are still desperate to attract any investment project. Thus, they willingly offer potential investors generous tax breaks, subsidies and loose regulation. Pressures to “race to the bottom” are more prevalent in fiscally poor cities.Footnote 49
This delayed replication of economic strategies and practices departs from the “point to surface” policy experiments discussed in earlier studies.Footnote 50 First, this replication was not designed to be a top-down process by central policy makers; rather, it evolved bottom-up, in the absence of planning. Second, diffusion was delayed, with coastal regions moving first in the evolutionary process. They were the first to successfully industrialize and now seek to expel low-end industries to the interior, which has become a recipient of domestic investment. This delayed policy diffusion reflects underlying variance in growth endowments (both geographical and historical) between the coastal and inland regions.
To illustrate the variation in developmental policies and degrees of selectivity among local governments in the coastal and central regions, I compare three cities: Ningbo 宁波, Sanming 三明, and Huangguang 黄冈. Among these, Ningbo, which is situated right on the coast in Zhejiang close to Shanghai, is the wealthiest and was the first to embrace foreign investment. Sanming is situated in the interior of Fujian province. It is less geographically advantaged than Ningbo and is thus less wealthy, but it has nevertheless industrialized heavily. Huanggang is located in the central province of Hubei. Compared to Zhejiang and Fujian, locales in Hubei were unable to attract foreign investment in the 1980s and 1990s, so many were stuck in poverty throughout the previous decades.
I compared the amount and content of regulations related to the “eviction of backward industries” (taotai luohou chanye 淘汰落后产业) on the official government websites of all three cities. Official government websites provide a rich source of information about the policies and priorities of local governments.Footnote 51 One should not be quick to dismiss these websites as mere vehicles of propaganda. It is likely that content must be vetted by senior executives before it can be publicly posted. Thus, information on official websites can offer useful clues about the primary concerns and policy positions of local authorities.
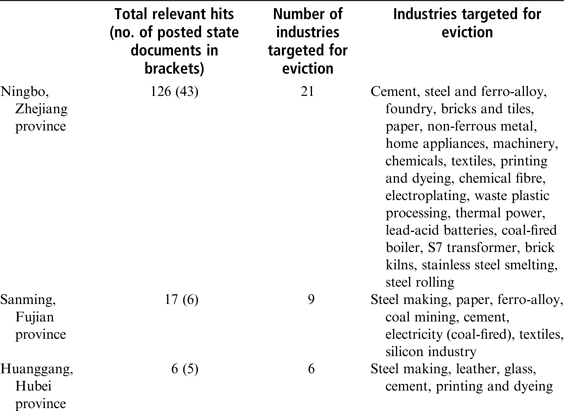
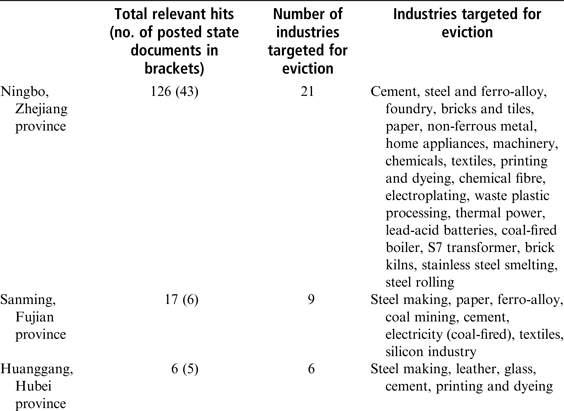
Table 5 summarizes the number of relevant hits under the search term “eviction of backward industries” on the official websites of the three city governments. Although imperfect, the number of hits is a useful indicator of the degree of attention paid by local authorities to the policy issue. For a more precise indicator, I subdivided the hits into city-level state documents and regulations posted on the websites and other links (for example, media reports). While it is easy for local governments to post media links related to the eviction of backward industries, crafting, vetting and then posting state documents online indicates serious efforts at policy implementation.
Local State Policies on Eviction of Backward Industries
Source: Tabulated from official websites of the local governments.
Consistent with my earlier discussion, among the three cities, Ningbo has the largest number of hits (126), 20 times more than Huanggang (only 6) and seven times that of Sanming (17). Although both Ningbo and Sanming are located on the coast, Ningbo posted more information and more state documents on industrial eviction than Sanming. Clearly, there exists economic and policy variance even within the coastal region, as some cities are more developed than others. Ningbo, the most prosperous city, also listed a larger number of industries for eviction (21), compared to Sanming (9) and Huanggang (6).
Next, I compared the type of industries targeted for eviction. Steel and cement manufacturing companies were targeted for eviction in all three cities. Other overlapping targets of eviction in Ningbo and Sanming were paper, ferro-alloy, textiles, and coal-fired electricity, while Huanggang's list overlapped with Ningbo's list only in printing and dyeing. All five targets in Huanggang were mandated by central policies, and Sanming listed only textiles and silicon in addition to the five centrally mandated targets.Footnote 52 This suggests that industrial eviction in the less developed cities was motivated primarily by compliance with central policies. By contrast, the most prosperous city of Ningbo went far beyond central demands. It identified the most industries for eviction, including cement, paper, chemicals, batteries, stainless steel, plastic processing, and even textiles (which used to be a major manufacturing sector in Zhejiang). Apart from its concern for environmental protection, the Ningbo city government also underscored “promoting economic restructuring and altering the method of economic development” as a key motivation for phasing out backward industries.Footnote 53
Policy decisions to evict selected industries appear to be backed by regulatory teeth, especially in the two coastal cities of Ningbo and Sanming. As part of the city's plan to “empty the cage and change the bird,” Ningbo set up an earmarked fund to subsidize and reward local enterprises that restructure or relocate. For example, subsidies are provided to enterprises that terminate production of goods on the evicted list, which will then “free up more than 300 tons of carbon emissions” for other manufacturing sectors. Enterprises are entitled to up to 200,000 yuan (about US$32,000) in subsidies for the elimination of every unwanted product line. For particular sectors such as equipment production, one-time subsidies are also offered per machinery item (for instance, 20,000 yuan per steam boiler), to encourage these sectors to close down or move away. Alongside such incentives, the city governments also issued penalties.Footnote 54 Both Sanming and Huanggang required targeted enterprises to shut down by stipulated deadlines.Footnote 55 Enterprises that refused to comply could have their licences revoked or their electricity and water supplies cut off.
While all three cities have formulated policies to evict backward industries, the content of their policies and the government's ability to implement them varies across cases. Compare Sanming and Huanggang. Aside from closures, the city government in Sanming has employed more sophisticated market mechanisms, such as differentiating the price of electricity supply for backward and preferred industrial sectors, to incentivize market actors to restructure.Footnote 56 Sanming has also laid out plans to facilitate mergers among enterprises in backward industries.Footnote 57 Moreover, in Sanming, both the city and county governments have pledged funds to reward targeted enterprises that succeed in terminating their production on time.Footnote 58 In Huanggang, however, the government has modestly stated that it is only “trying to apply for rewards and supporting funds from the provincial and national governments.”Footnote 59
The city governments have even turned the eviction of backward industries into mandatory bureaucratic targets.Footnote 60 For example, Huanggang announced its decision to close two printing and dyeing enterprises in 2014, and specifically marked two production lines, 68 machines, and 5,400 square metres of factory space as part of its targets.Footnote 61 Eviction tasks were assigned to specific local government offices, such as the Development Zone Committee. Bureaucratic targets in Sanming were more comprehensive than in Huanggang. One target was to assign monetary rewards to evicted backward industries.Footnote 62 In addition, the city government signed “contracts” with its county and district governments, specifying their responsibilities for evicting backward industries, a target that was included in cadre evaluations.Footnote 63 Sanming's targets appeared to push local officials so hard that the number of backward industries that were shuttered exceeded assigned targets in some cases.Footnote 64 Although Ningbo appeared less harsh in its approach, it also applied numerical targets. One document stated that the city should subsidize about 20 “empty the cage and change the bird” projects each year.Footnote 65
Yet, despite the apparently strong measures taken by these local governments, they cannot in fact achieve the desired outcomes by command. It is problematic to evict some enterprises, particularly if these companies contribute to local employment and tax income.Footnote 66 It is especially difficult to expel enterprises that were earlier brought in through the personal connections of local officials.Footnote 67 It remains to be seen whether market forces will trump policy forces in driving backward industries away from the coast. If costs keep rising and factories are no longer able to make profits, then they will have to close down or move away.
Variations in policy across these cases should be understood not simply as variations across space but more specifically as variations across locales at different stages of development. Ningbo represents the wealthiest and most institutionally advanced of the three cities. It is already at a stage of development where it wants to select industries and is determined to expel low-end, polluting manufacturers. For Ningbo, the priority is to free up space for the entry of higher-end producers. By contrast, as a newcomer in the industrialization process, Huanggang city cannot afford to be as picky. Thus, it welcomes – or does not explicitly shun – industries that wealthy locales like Ningbo no longer want to host.
Conclusion
This article brings attention to the important phenomenon of industrial transfer in China. One key measure of industrial transfer is domestic investment, which in the central region alone, is already 2.5 times the total volume of FDI in China. That FDI was a major engine in China's early reform and development is already well-known; in contrast, domestic investment and industrial transfer, which only recently appeared, have received little attention.
With the aim of laying a macro-historical foundation for further research into this subject, this article traces the processes leading up to industrial transfer in the present day, illuminates the costs and policy pressures pushing manufacturers away from the coast, and reveals a pattern of delayed policy diffusion from coastal to inland regions. Inland governments today receive an unprecedented flow of investment from the coast. Intense competition has prompted these governments to belatedly adopt the aggressive, en masse investment recruitment tactics that were phased out on the coast in the 1990s and 2000s. While coastal cities like Ningbo are determined to evict backward industries, inland cities like Huanggang cannot afford to be selective. The latter's formulation and enforcement of eviction policies are clearly and deliberately weak.
Delayed policy diffusion deserves greater attention in the study of China's policymaking and experimentation process. Jessica Teets and William Hurst identify three different modes of policy diffusion: top-down (from central to local), bottom-up (from local to central), and horizontal (from region to region without Beijing's intervention).Footnote 68 While their discussion points usefully to the different directions of policy diffusion, it fails to note the important role of timing and sequence. Lagged replication of investment strategies is one among many instances in which policy adoption is conditional upon economic conditions. In another instance, my research in Chengdu finds that even within a single county, while the wealthiest township was able to dilute growth targets and prioritize social goals, the same policy could not feasibly be adopted in less wealthy townships that must first deliver economic growth.
Policies that fit first-movers may not fit laggard regions. Later on, however, as economic conditions change among the latter, what used to fail in a particular place may work. Beyond China, delayed policy diffusion has been studied through interdependent spatial models and event history analysis of different rates of policy adoptions.Footnote 69 Future studies of China's policy diffusion should take into account the interaction of space and time.
Industrial transfer will play a critical role in the remaking of China's national competitive advantage. For the coast, the migration of labour-intensive, low-end manufacturing inland frees up room for higher-end production and tertiary economic activities, a strategy that Chinese policymakers term “emptying the cage to change the bird.” For inland economies, the domestic migration of industries brings a flow of investment and growth opportunities that previously did not exist.Footnote 70 Hypothetically, if an effective division of labour according to regional comparative advantages emerges, then China can gain a powerful edge over other national competitors. After all, few nations boast of having the lowest to highest ends of production within a single common market.
The above scenario, however, projects a policy ideal. Actualizing it is far from easy, much less assured. The central leadership cannot command regional governments to specialize in particular manufacturing sectors according to their cost and competitive advantage. Nor can state authorities compel private and foreign-owned businesses to move to desired locations. Even at the grassroots level, local governments’ efforts to expel low-end, polluting industries are sometimes resisted or circumvented. In the past few years, the central government has launched programmes and model sites to promote industrial transfer, but the migration of production remains a largely bottom-up, market-driven process that cannot be precisely controlled by central or local authorities.
Many questions remain for future empirical research. Evidently, there is a need to collect more data about the scale of industrial transfer. As discussed above, however, this is challenging because “transfer” (a movement) is much harder to capture than output. Firm-level surveys and case studies present one promising step. It is still unknown how firms respond to cost and regulatory pressures and then choose the site of their relocation accordingly. One may further investigate the challenges that companies face when moving into the interior, and whether they move in isolation or with an entire supply chain. Moreover, the central and western provinces are not the only possible destination – future research could examine whether manufacturers choose to close down or relocate beyond China, such as to countries in Africa.Footnote 71 As a first step, this article brings attention to the fact that domestic manufacturers are moving en masse from the coast to the interior. Only by understanding the origins, drivers and distinctive features of industrial transfer can we further unpack this process.
Acknowledgement
I thank Linda Lim, Mary Gallagher and Dorothy Solinger for helpful comments, and in particular, Kellee Tsai for directing me to the “flying geese” literature. Zhang Wen, Nicole Wu and Zeng Simeng provided superb research assistance. I also benefited from feedback at the University of California-Irvine's Colloquium on Justice and Development, with special thanks to Benjamin Van Rooij, Su Yang, Tom Bernstein, Wang Feng, and comments from the organizers and discussant Luo Zhi at the Asian Development Bank Institute's conference on “Impacts of a possible growth slowdown in the PRC.”
Biographical note
Yuen Yuen Ang is associate professor of political science at the University of Michigan, Ann Arbor. She is the author of How China Escaped the Poverty Trap (2016), which was among Foreign Affairs’ “Best of Books 2017.”