Implications
In Spain, heavier pigs than in other countries are intended for elaborate dry-cured products such as ham. Besides, the largest cereal crop is barley, whose usual acceptable price and nutritional composition make it interesting to revalue it as the single major ingredient in diets for growing pigs. A diet based on barley means a reduction of the protein : energy ratio and a vitamin A deficiency in relation to the requirements for pigs of that age. Both aspects may have a positive effect on backfat depth and intramuscular fat content, which are desirable in the production of heavy pigs intended for dry-cured products in the Mediterranean area.
Introduction
Barley is the largest cereal crop in Spain, with a yearly production of more than 11 million tonnes in ∼3.5 million hectares of land (Ministerio Medioambiente, Medio Rural y Marino, 2011). The acceptable price and nutritional composition (Fundación Española Desarrollo Nutrición Animal, 2010) of this cereal makes it of interest for study as the main ingredient in diets for pigs during the growing or the finishing period. A diet based on barley means a reduction of the protein : energy ratio in the ration and a deficiency in vitamin A in relation to the requirements for pigs of that age. Both aspects may have a positive effect on the intramuscular fat (IMF) content. In terms of this, Daza et al. (Reference Daza, Latorre and López-Bote2010) found that meat from pigs fed a diet based only on granulated barley from 90 to 130 kg BW tended to show a 23.5% higher IMF content than that from pigs fed a barley–wheat–soybean meal diet.
Obviously, the IMF proportion and composition are important meat quality characteristics (Fernández et al., Reference Fernández, Monin, Talmant, Mourot and Lebret1999). Several dietary strategies have been implemented to enhance the IMF content in swine production. For instance, it has been reported that reductions of the protein/digestible energy ratio lead to a higher IMF percentage (D'Souza et al., Reference D'Souza, Pethick, Dunshea, Pluske and Mullan2003). Also, the fatty acid (FA) profile of the IMF changes with the use of different dietary fat sources (rape seed oil, soya bean oil and tallow; Wiseman and Agunbiade, Reference Wiseman and Agunbiade1998). However, reports sometimes show contradictory results. In addition, a negative association has been found between dietary vitamin A and IMF proportion in cattle (Siebert et al., Reference Siebert, Kruck, Davis, Pitchford, Harper and Bottema2006) and in pigs (D'Souza et al., Reference D'Souza, Pethick, Dunshea, Pluske and Mullan2003).
On the other hand, the production of heavy pigs (>100 kg BW) is often in the Mediterranean area when they are intended for dry-cured ham production (Latorre et al., Reference Latorre, García-Belenguer and Ariño2008). Spain is the world leader in dry-cured hams and shoulders, with a total production of more than 46 million pieces in 2010 (Ministerio Medioambiente, Medio Rural y Marino, 2011). The use of high percentages of inclusion of barley in diets for heavy pigs might be very interesting from a nutritional, economical and product quality point of view (Daza et al., Reference Daza, Latorre and López-Bote2010).
Therefore, the aim of this study was to investigate the influence of the use of barley as the single major ingredient in the diet during the growing or the finishing period on production performance, carcass characteristics and meat and fat quality in heavy pigs.
Material and methods
Animal husbandry and feeding management
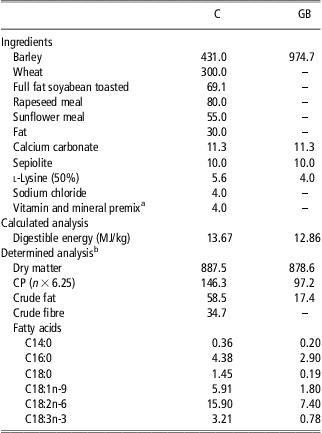
All the experimental procedures used in this study were in compliance with the Spanish guidelines for the care and use of animals in research (Boletín Oficial Estado, 2005). A total of 48 crossbred gilts of 46.8 kg BW (86 ± 3 days of age) were used for the study. All pigs were the progeny of Duroc sires (Asociación Turolense de Industrias Agroalimentarias, Teruel, Spain) and Landrace × Large White dams (Hypor España G.P., Barcelona, Spain). Before the experiment, all pigs had been subjected to the same feeding and management. On arrival at the experimental farm (El Chantre, Teruel, Spain), pigs were randomly allotted to 24 pens, with two pigs per pen. There were three treatments based on the diets received during the growing and finishing periods: (i) the control diet was fed from 45.6 to 127.8 kg BW (C group), (ii) the control diet was fed from 47.0 to 91.8 kg BW and granulated barley was fed from 91.8 to 129.7 kg BW (C + GB group) and (iii) granulated barley was fed from 47.9 to 93.1 kg BW and the control diet was fed from 93.1 to 135.1 kg BW (GB + C group). The control feedstuff consisted of a commercial diet based on barley, wheat and vegetable protein sources and the granulated barley feedstuff had that cereal as the single main ingredient in the diet. Pigs were housed in 30% slotted floor pens (2.30 × 2.60 m) in a controlled environment barn and had free access to pelleted diets and water throughout the trial. Chemical analysis of feeds was carried out according to the procedures of the Association of Official Analytical Chemists (2000). The ingredients, calculated energy and determined composition of the experimental diets are shown in Table 1.
Ingredient composition and estimated and determined analyses of the control and granulated barley diets for heavy pigs (g/kg as fed unless otherwise indicated)

C = control diet; GB = granulated barley; diets provided during growing or finishing period.
aSupplying per kg diet: 7000 IU of vitamin A, 1500 IU of vitamin D3, 15 IU of α-tocopherol acetate and 10 mg of copper sulphate.
bAccording to Association of Official Analytical Chemists (2000).
Growth performance
Live weight and feed consumption were recorded per pen at the beginning and at the end of each phase and were used to calculate the average daily gain (ADG), average daily feed intake and feed conversion ratio (FCR) for growing, finishing and overall periods. Animals were slaughtered when the average BW of each group reached around 130 kg BW (86, 101 and 140 days of the trial for pigs fed C, C + GB and GB + C diets, respectively). Also, ultrasonic measurements of fat thickness were taken one day before slaughter using an Apparatus RTU (Kretz Technick Inc., 600V-V2.232, Sonovet, Austria). Measurements were recorded on the right side of all animals at the last rib level by the same operator, measuring over the skin without clipping the fleece.
Slaughter, carcass measures and meat and fat sampling
The day before slaughter, feed was withheld for 7 h and pigs were weighed and transported 30 km to a commercial abattoir (Jamones y Embutidos Altomijares SL, Teruel, Spain), where they were kept in lairage for 10 h with full access to water but not to feed. Pigs were electrically stunned (225 to 380 V/0.5 amps for 5 to 6 s), exsanguinated, scalded, skinned, eviscerated and split down the midline according to standard commercial procedures. Hot carcass weight was individually recorded and used to calculate carcass yield.
At 45 min postmortem, carcass length from the posterior edge of the Symphysis pubis to the anterior edge of the first rib, ham length from the anterior edge of the Symphysis pubis to the hock joint and ham circumference at its widest side were measured on the left side of each carcass. Carcass compactness was then calculated as carcass weight/carcass length. Backfat thickness between the 3rd and the 4th last ribs and fat depth over the Gluteus medius (GM) muscle were also measured on the midline of the carcass (skin included).
The head was removed at the atlanto-occipital junction and carcasses were suspended in the air and refrigerated at 2°C (1 m/s; 90% relative humidity) for 2 h. Carcasses were then processed according to commercial standards. Afterwards, hams, shoulders and loins were trimmed and weighed to calculate trimmed ham, shoulder and loin yields. The trimming consisted in eliminating part of the external fat and skin to fit commercial requirements and the process was performed by qualified personnel of the abattoir.
After the carcass had been processed, a section of 500 ± 20 g of the Longissimus thoracis (LT) muscle at the level of the last rib from each left loin were excised. Subcutaneous fat samples, including fat layers, skin and lean, were also taken from the left ham of each carcass at the tail insertion close to the coxal region. All the meat and fat samples were vacuum-packaged in individual bags and stored at −20°C for 3 weeks until subsequent analyses.
Meat quality analyses
The LT samples were thawed in vacuum-package bags for 24 h at 4°C, removed from the packages, blotted dry for 20 min and weighed. Thawing loss was calculated by dividing the difference in weight between the fresh and the thawed samples by the initial fresh weight. Meat colour was evaluated after 30 min blooming with a colorimeter (Model CM 2002; Minolta Camera, Osaka, Japan) using objective measurements (Commission International de l'Eclairage, 1976) with illuminant D65, 10° Standard Observer. The colorimeter was previously calibrated against a white tile according to the manufacturer's recommendations. The average of three random readings was used to measure lightness (L*, a higher value is indicative of a lighter colour), redness (a*, a higher value is indicative of a redder colour) and yellowness (b*, a higher value is indicative of a yellower colour). Additionally, chroma (c*) and hue angle (H°) were calculated as  and as H° = tang−1(b*/a*) × 57.29, respectively (Wyszecki and Stiles, Reference Wyszecki and Stiles1982). Chroma is related to the quantity of pigments and high values represent a more vivid colour denoting lack of greyness. Hue is the attribute of a colour perception denoted by blue, green, yellow, red, purple, etc. and it is related to the state of pigments. After measurement of colour, an LT sample was used to analyse the FA profile of IMF.
Cooking loss was determined using the method described by Honikel (Reference Honikel1998). Briefly, an LT slice (200 ± 20 g) was taken from each chop, weighed, placed in a plastic bag and cooked to an internal temperature of 70°C in a 75°C water bath (Precisterm J.P., Selecta S.A., Barcelona, Spain). Internal temperature was monitored during cooking with a handheld temperature probe (Model HI 9063; Hanna Instruments, Woonsocket, RI, USA). Cooked samples were allowed to cool at 15°C for 30 min, blotted dry and weighed. The difference between pre- and post-cooking weights was divided by the pre-cooked weight to calculate the cooking loss percentage. To determine the shear force value, samples were cut parallel to the long axis of the muscle fibres into rectangular cross-section slices, 10 × 10 mm and 30 mm in length. Afterwards, slices (8 per chop) were sheared perpendicular to the fibre orientation, using a Warner–Bratzler device attached to an Instron Universal testing machine attached to a portable computer (Model 5543; Instron Ltd, Buckinghamshire, UK) and equipped with a 5-kg load cell and a crosshead speed of 150 mm/min.
Dry-curing process and sampling
The left ham from each carcass was dry-cured according to the Consortium rules (Boletín Oficial Aragón, 1993). Briefly, the hams were salted for 12 days at 2°C to 4°C (nitrites were added to the salt). Afterwards, the hams were washed and allowed to rest in a controlled atmosphere (3°C to 6°C and 80% to 90% relative humidity) for 10 weeks. Following the resting period, the hams were dried by increasing the temperature (from 10°C to 30°C) and decreasing the relative humidity (from 85% to 70%) until the required weight loss was attained. After 18 months of processing, a sample of Biceps femoris (BF) muscle from each dry-cured ham was taken to analyse the FA profile of IMF.
FA analyses of feeds and fat
The FA of diets were extracted and quantified using the one-step procedure described by Sukhija and Palmquist (Reference Sukhija and Palmquist1988) in lyophilized samples. Pentadecenoic acid (C15:1) (Sigma, Alcobendas, Madrid, Spain) was used as the internal standard. Previously, methylated FA samples were identified according to Rey et al. (Reference Rey, López-Bote and Arias1997) using a gas chromatograph (Model HP6890; Hewlett Packard Co., Avondale, PA, USA) and a 30 m × 0.32 mm × 0.25 μm cross-linked polyethylene glycol capillary column (Hewlett Packard Innowax). A temperature program of 170°C to 245°C was used. The injector and detector were maintained at 250°C. The carrier gas (helium) flow rate was 3 ml/min.
Lipids from subcutaneous fat from ham were extracted using the procedure proposed by Bligh and Dyer (Reference Bligh and Dyer1959), whereas lipids from LT and BF samples were obtained according to the method developed by Marmer and Maxwell (Reference Marmer and Maxwell1981). Fat extracts were methylated in the presence of sulphuric acid and analysed as described above. From individual FA percentages, the saturated FA (SFA), monounsaturated FA (MUFA) and polyunsaturated FA (PUFA) proportions were calculated.
Statistical analyses
The pen was the experimental unit for statistical analysis of productive performance traits, whereas the pig was the experimental unit for the remaining dependent variables. Data were analysed using the GLM procedure of Statistical Analysis Systems Institute (1990). The model included the dietary treatment as the main effect and the initial weight of pigs or carcass weight as a covariate when P < 0.05 for growth performance or carcass characteristics, respectively. Duncan's test was used to assess differences between treatment means. Shapiro and Wilk (Reference Shapiro and Wilk1965) test was used to evaluate the normal distribution of the data carrying out the transformation arc sin (x/100)0.5 for those whose distribution was not normal.
Results
Growth performance
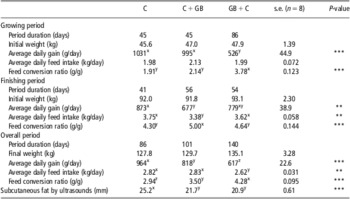
During the growing period, the C and C + GB group grew faster (P < 0.001) and had better FCR (P < 0.001) than the GB + C group (Table 2). During the finishing period, the C gilts had higher ADG (P < 0.01) than C + GB gilts, with GB + C in an intermediate position. In addition, C and GB + C gilts ate more feed (P < 0.01) and were more efficient (P < 0.001) than C + GB gilts.
The effect of dietary treatment (C and GB) on productive performance and subcutaneous fat depth in vivo of heavy pigs

C = control diet; GB = granulated barley; diets provided during growing or finishing period.
**P < 0.01; ***P < 0.001.
x,y,zMeans with different superscript letters within a row differ (P < 0.05).
For the overall experimental period, the C group grew faster (P < 0.001) and had better FCR (P < 0.001) than the GB + C group, with C + GB being intermediate (964 v. 818 v. 617 g/day for ADG and 2.94 v. 3.50 v. 4.28 g/g for FCR in C, C + GB and GB + C gilts, respectively). Also, C and C + GB groups ate more feed (2.82 v. 2.83 v. 2.62 kg/day; P < 0.01) than the GB + C group. In vivo measurement by ultrasounds showed that C gilts had higher subcutaneous fat depth than the rest of the groups (25.2 v. 21.7 v. 20.0 mm for C, C + GB and GB + C, respectively; P < 0.001).
Carcass characteristics
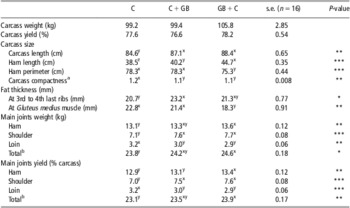
No significant differences among treatments were observed for carcass weight or yield (P > 0.05) (Table 3). However, carcass length was higher (P < 0.01) by 3.0% to 4.5% and carcass compactness was lower (P < 0.01) by 8.4% in the C + GB and GB + C groups than in the C group. Ham length was higher by 16% in GB + C than in C gilts, with C + GB in an intermediate position (P < 0.001), and ham perimeter was higher by 4% in C and C + GB groups than in the GB + C group (P < 0.001). In addition, carcasses from C + GB gilts had higher backfat depth between the 3rd and the 4th last ribs than those from C gilts, with GB + C in an intermediate position (20.7 v. 23.2 v. 21.3 mm for C, C + GB and GB + C gilts, respectively; P < 0.05). However, C and C + GB groups had 24.6% and 16.9% higher backfat at GM muscle, respectively, than the GB + C group (P < 0.01). The total main joints (ham + shoulder + loin) were heavier (P < 0.05) and had a higher yield in carcass (P < 0.01) in the GB + C group than the C group, with C + GB in an intermediate position (23.8 v. 24.2 v. 24.6 kg for carcass weight and 23.1% v. 23.5% v. 23.9% for carcass yield from C, C + GB and GB + C gilts, respectively), and this was mainly due to the higher yield of hams (P < 0.01) and shoulders (P < 0.001).
The effect of dietary treatment (C and GB) on carcass characteristics of heavy pigs

C = control diet; GB = granulated barley; diets provided during growing or finishing period.
*P < 0.05; **P < 0.01; ***P < 0.001.
x,y,zMeans with different superscript letters within a row differ (P < 0.05).
aCarcass weight (kg)/carcass length (cm).
bHam + shoulder + loin.
Meat quality
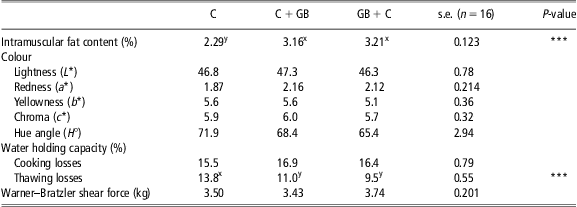
The dietary treatment had no influence on the colour, shear force value or cooking loss of the loin (P > 0.05; Table 4). However, meat from C + GB and GB + C gilts had lower thawing loss (13.8% v. 11.0% v. 9.5% for C, C + GB and GB + C, respectively; P < 0.001) and a higher IMF content (2.29% v. 3.16% v. 3.21%, respectively; P < 0.001) than meat from C gilts.
The effect of dietary treatment (C and GB) on meat characteristics of heavy pigs

C = control diet; GB = granulated barley; diets provided during growing or finishing period.
***P < 0.001.
x,yMeans with different superscript letters within a row differ (P < 0.05).
FA profile of subcutaneous fat from ham
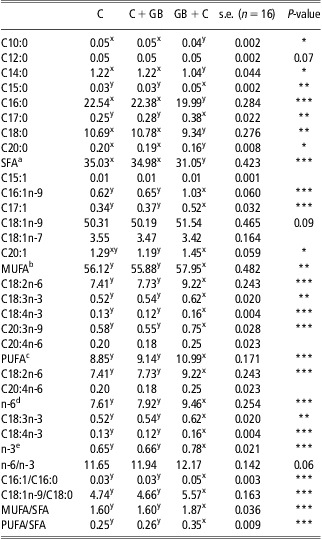
The SFA outer layer proportion was higher (P < 0.001) by 12.7% in C and C + GB than in GB + C gilts due to the higher C10:0, C14:0 and C20:0 (P < 0.05), C18:0 (P < 0.01) and C16:0 (P < 0.001) contents (Table 5). The MUFA outer layer percentage was lower (P < 0.01) by 3.5% in C and C + GB than in GB + C gilts due to the lower C20:1 (P < 0.05) and C16:1n-9 and C17:1 (P < 0.001) contents and tended to be lower for the C18:1n-9 (P = 0.09) proportion. The PUFA outer layer proportion was lower in C and C + GB than in GB + C gilts (8.85% v. 9.14% v. 10.99%, respectively; P < 0.001) due to the lower C18:3n-3 (P < 0.01) and C18:2n-6, C18:4n-3 and C20:3n-9 (P < 0.001) contents. The outer layer of subcutaneous fat from GB + C gilts tended to have a higher (P = 0.06) n-6/n-3 ratio and had higher (P < 0.001) n-6 and n-3 contents and C16:1/C16:0, C18:1n-9/C18:0, MUFA/SFA and PUFA/SFA ratios than C or C + GB gilts.
The effect of dietary treatment (C and GB) on fatty acid profile (%) of the outer layer of subcutaneous fat from ham of heavy pigs

C = control diet; GB = granulated barley; diets provided during growing or finishing period.
*P < 0.05; **P < 0.01; ***P < 0.001.
x,yMeans with different superscript letters within a row differ (P < 0.05).
aSFA, ΣSaturated fatty acids = C10:0 + C12:0 + C14:0 + C15:0 + C16:0 + C17:0 + C18:0 + C20:0.
bMUFA, ΣMonounsaturated fatty acids = C15:1 + C16:1n-9 + C17:1 + C18:1n-9 + C18:1n-7 + C20:1.
cPUFA, ΣPolyunsaturated fatty acids = C18:2n-6 + C18:3n-3 + C18:4n-3 + C20:3n-9 + C20:4n-6.
dn-6, Σn-6 = C18:2n-6 + C20:4n-6.
en-3, Σn-3 = C18:3n-3 + C18:4n-3.
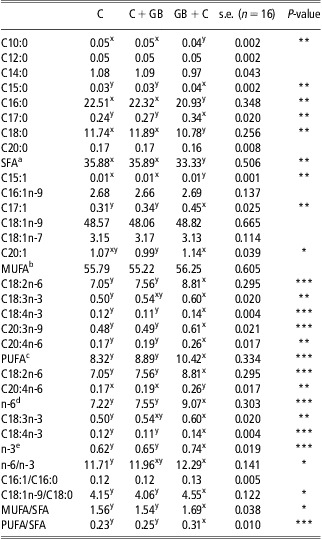
Despite the lower (P < 0.01) proportion in C15:0 and C17:0 contents, the SFA inner layer proportion was higher (P < 0.01) by 7.6% in C and C + GB than in GB + C gilts due to the higher (P < 0.01) C10:0, C16:0 and C18:0 contents (Table 6). No effect of dietary treatment was detected on the MUFA inner layer percentage (P > 0.05), although C and C + GB had higher (P < 0.01) C15:1 and lower C17:1 contents than GB + C gilts. The PUFA inner layer proportion was lower in C and C + GB than in GB + C gilts (8.32% v. 8.89% v. 10.42%, respectively; P < 0.001) due to the lower C18:3n-3 and C20:4n-6 (P < 0.01) and C18:2n-6 and C18:4n-3 (P < 0.001) contents. The inner layer of subcutaneous fat from GB + C gilts had higher n-6 and n-3 contents and PUFA/SFA ratio (P < 0.001) and C18:1n-9/C18:0, MUFA/SFA and n-6/n-3 ratios (P < 0.05) than the remaining groups of gilts.
The effect of dietary treatment (C and GB) on fatty acid profile (%) of the inner layer of subcutaneous fat from ham of heavy pigs

C = control diet; GB = granulated barley; diets provided during growing or finishing period.
*P < 0.05; **P < 0.01; ***P < 0.001.
x,yMeans with different superscript letters within a row differ (P < 0.05).
aSFA, ΣSaturated fatty acids = C10:0 + C12:0 + C14:0 + C15:0 + C16:0 + C17:0 + C18:0 + C20:0.
bMUFA, ΣMonounsaturated fatty acids = C15:1 + C16:1n-9 + C17:1 + C18:1n-9 + C18:1n-7 + C20:1.
cPUFA, ΣPolyunsaturated fatty acids = C18:2n-6 + C18:3n-3 + C18:4n-3 + C20:3n-9 + C20:4n-6.
dn-6, Σn-6 = C18:2n-6 + C20:4n-6.
en-3, Σn-3 = C18:3n-3 + C18:4n-3.
FA profile of IMF from Longissimus thoracis and Biceps femoris muscles
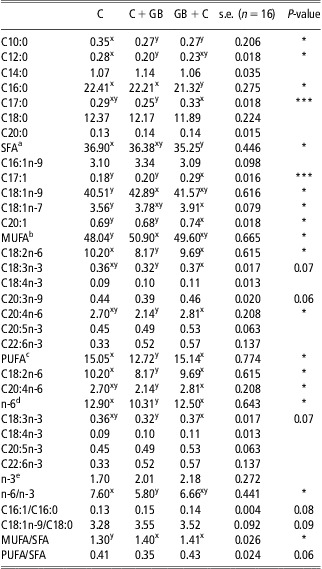
The SFA proportion of IMF from loin (LT muscle) was higher (P < 0.05) by 4.7% in C than in GB + C gilts, with C + GB being intermediate, and this was due to the higher (P < 0.05) C10:0, C12:0 and C16:0 contents (Table 7). The MUFA percentage of IMF from loin was lower (P < 0.05) by 5.6% in C than in C + GB gilts, with GB + C being intermediate, and this was due to the lower (P < 0.05) C18:1n-9 and C18:1n-7 contents. The PUFA proportion of IMF from loin was higher in C and GB + C gilts than in C + GB gilts (15.05% v. 15.14% v. 12.72%, respectively; P < 0.05) due to the lower C20:4n-6 (P < 0.05) content and tended to be lower for the C18:3n-3 (P = 0.07) proportion. The IMF of loin from C and GB + C gilts had a higher n-6 content (P < 0.05) and tended to show a higher PUFA/SFA ratio (P = 0.06) than C + GB gilts. The IMF of loin from C gilts tended to have a lower C18:1n-9/C18:0 ratio (P = 0.09) and showed a lower MUFA/SFA (P < 0.05) ratio than the remaining groups of gilts. The IMF of loin from C gilts tended to have a lower C16:1/C16:0 ratio (P = 0.08) and had a higher n-6/n-3 ratio (P < 0.05) than C + GB gilts, with GB + C being intermediate.
The effect of dietary treatment (C and GB) on fatty acid profile (%) of the intramuscular fat from loin (Longissimus thoracis muscle) of heavy pigs

C = control diet; GB = granulated barley; diets provided during growing or finishing period.
*P < 0.05; ***P < 0.001.
x,yMeans with different superscript letters within a row differ (P < 0.05).
aSFA, ΣSaturated fatty acids = C10:0 + C12:0 + C14:0 + C15:0 + C16:0 + C17:0 + C18:0 + C20:0.
bMUFA, ΣMonounsaturated fatty acids = C16:1n-7 + C17:1 + C18:1n-9 + C18:1n-7 + C20:1.
cPUFA, ΣPolyunsaturated fatty acids = C18:2n-6 + C18:3n-3 + C18:4n-3 + C20:3n-9 + C20:4n-6.
dn-6, Σn-6 = C18:2n-6 + C20:4n-6.
en-3, Σn-3 = C18:3n-3 + C18:4n-3 + C20:5n-3 + C22:6n-3.
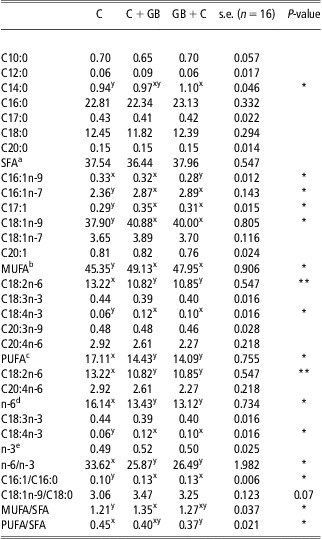
No effect of dietary treatment was detected on the SFA percentage of IMF from ham (BF muscle; P > 0.05), although the GB + C group had a higher (P < 0.05) C14:0 content than the C group, with C + GB being intermediate (Table 8). The MUFA proportion of IMF from ham was lower (P < 0.05) by 5% to 7% in C than in the remaining groups due to the lower (P < 0.05) C16:1n-7, C17:1 and C18:1n-9 contents. The PUFA percentage of IMF from ham was higher in C than in the C + GB and GB + C groups (17.11% v. 14.43% v. 14.09%, respectively; P < 0.05) due to the higher C18:2n-6 content (P < 0.01). The IMF proportion from ham of C gilts had a lower (P < 0.05) C16:1/C16:0 ratio than C + GB and GB + C gilts and a lower (P < 0.05) MUFA/SFA ratio than C + GB gilts, with GB + C being intermediate. The IMF from ham of C gilts had a higher (P < 0.05) PUFA/SFA ratio than GB + C gilts, with C + GB in an intermediate position.
The effect of dietary treatment (C and GB) on fatty acid profile (%) of the intramuscular fat from ham (Biceps femoris muscle) of heavy pigs

C = control diet; GB = granulated barley; diets provided during growing or finishing period.
*P < 0.05; **P < 0.01.
x,yMeans with different superscript letters within a row differ (P < 0.05).
aSFA, ΣSaturated fatty acids = C10:0 + C12:0 + C14:0 + C15:0 + C16:0 + C17:0 + C18:0 + C20:0.
bMUFA, ΣMonounsaturated fatty acids = C16:1n-7 + C16:1n-7 + C17:1 + C18:1n-9 + C18:1n-7 + C20:1.
cPUFA, ΣPolyunsaturated fatty acids = C18:2n-6 + C18:3n-3 + C18:4n-3 + C20:3n-9 + C20:4n-6.
dn-6, Σn-6 = C18:2n-6 + C20:4n-6.
en-3, Σn-3 = C18:3n-3 + C18:4n-3.
A quadratic relation was observed between C18:1n-9 proportion and IMF in LT muscle: C18:1n-9 = 29.00 + 5.17IMF − 0.42IMF2 (R 2 = 0.66, r.s.d = 1.57, P < 0.0001).
Discussion
Growth performance
Data showed that the reduction of CP in feed provided to gilts from 48 to 92 kg or from 92 to 130 kg BW impaired ADG and FCR. D'Souza et al. (Reference D'Souza, Pethick, Dunshea, Pluske and Mullan2003) observed that pigs fed a diet containing 16.9% CP during the growing period (24 to 65 kg BW) had worse FCR in comparison with pigs fed a control diet containing 18.7% CP but no differences were detected in ADG during the growing–finishing phase (24 to 100 kg BW). Daza et al. (Reference Daza, Latorre and López-Bote2010) did not find any difference in growth performance between pigs fed a control diet (15.6% CP) and those fed granulated barley during the finishing period (86 to 130 kg BW), although FCR was worse in pigs fed granulated barley. In the present trial, the FCR was higher in GB + C gilts than in C + GB and in C gilts. Critser et al. (Reference Critser, Miller and and Lewis1995) found that a reduction from 18.4% to 13.1% CP in the diet during the growing–finishing period (42 to 102 kg BW) decreased ADG and impaired FCR in gilts. In addition, Chiba et al. (Reference Chiba, Ivery, Cummins and Bamble1999) observed that a reduction of lysine concentration in the growing diet (23 to 50 kg BW) decreased ADG and increased FCR in the combined growing–finishing period (23 to 105 kg BW), but reduced ultrasound backfat at slaughter, which was also observed in the present experiment.
Carcass characteristics
The higher values of carcass and ham length of C + GB and GB + C gilts may be attributed to the fact that they were older and heavier than C gilts, which is in agreement with the data from Latorre et al. (Reference Latorre, García-Belenguer and Ariño2008), although these authors also observed an increase in ham perimeter with age. We do not have an explanation for the narrow hams in the GB + C group. Carcass compactness was lower in C + GB and GB + C than in C gilts due to their higher carcass length.
Granulated barley provided during the finishing phase increased fat thickness at the level of the 3rd and the 4th last ribs. However, when the cereal was provided during the growing period, fat thickness at the level of GM muscle decreased. In this respect, Chiba et al. (Reference Chiba, Ivery, Cummins and Bamble1999) found that backfat thickness decreased or increased if the dietary lysine concentration was reduced in the growing or the finishing period, respectively.
No differences between C + GB and GB + C gilts was detected for the weight and yield of lean joints studied, except for ham percentage. However, ham and shoulder weights and yields were higher in GB + C than in C gilts. It seems that GB + C gilts, which were underfed for CP during the growing phase, had a compensatory response during the finishing period in those variables, although this effect was not seen on the loin. According to data reported by Whang et al. (Reference Whang, Kim, Donovan, McKeith and Easter2003), pigs previously fed diets with restricted CP increased protein retention and reduced lipids deposition during the posterior period. This effect might be related to sex because Martínez-Ramírez et al. (Reference Martínez-Ramírez, Jeaurond and de Lange2008a and Reference Martínez-Ramírez, Jeaurond and de Lange2008b) observed a compensatory protein deposition after a period of amino acid intake restriction in barrows and a complete compensatory protein retention after a moderate amino acid intake restriction between 15 and 38 kg BW in boars with high lean-tissue growth potential. In a recent report, Edmonds and Baker (Reference Edmonds and Baker2010) showed that pigs fed deficient CP and lysine diets for 14 days, followed by increased levels of both nutrients during a subsequent 21 days can achieve similar carcass merit as that achieved with conventional CP feeding regimes. Similar results were found in the current experiment, in which the proportions of ham and shoulder, which are important lean pieces, were higher in GB + C than in C gilts.
Meat quality
No differences were observed between dietary treatments for colour traits, which agrees with several reports that have shown that feeding changes hardly have an effect on the colour of meat. However, Daza et al. (Reference Daza, Latorre and López-Bote2010) found that meat from the pigs fed granulated barley during the finishing phase had higher a*, b* and c* values and a lower H° value than meat from pigs fed the control diet.
Meat from the C + GB group had lower thawing loss than that from C gilts, which is in agreement with the data obtained by Daza et al. (Reference Daza, Latorre and López-Bote2010) in pigs of the same crossbreed. The results of the current experiment suggest that a reduction in CP concentration in growing or finishing diets might increase the water-holding capacity of meat.
The IMF of LT muscle was higher in C + GB and GB + C than that in C gilts. This result is especially important for consumers because a higher IMF has been traditionally associated with more juiciness and greater acceptability of the meat. Several studies have reported a higher IMF content in meat from pigs fed diets with a reduced CP : digestible energy ratio. Thus, Kerr et al. (Reference Kerr, McKeith and Easter1995) reported that pigs fed reduced CP diets from weaning to the end of the growing or finishing period had a higher marbling score compared with pigs fed a high CP diet. Cisneros et al. (Reference Cisneros, Ellis, McKeith, McCaw and Fernando1996) observed that an amino acid-deficient diet during the late finishing phase (3 to 5 weeks before slaughter) in pigs led to an increased IMF content in comparison with a control diet. In addition, D'Souza et al. (Reference D'Souza, Pethick, Dunshea, Pluske and Mullan2003) reported that meat from pigs fed 15% and 30% reduced protein : digestible energy diets during the growing period had a higher IMF content compared with that from pigs fed a conventional diet.
On the other hand, no vitamin and mineral supplementation was supplied in granulated barley diets and consequently some effect on meat quality might have been expected, mainly because of the lack of vitamins A and E. According to the results of several experiments, dietary vitamin E supplementation has no significant influence on growth performance, carcass traits, IMF content or FA composition of the outer and inner layers of subcutaneous backfat and IMF (López-Bote et al., Reference López-Bote, Isabel and Daza2002). However, in other studies, it has been reported that dietary vitamin E supplementation leads to a reduction in susceptibility to meat oxidation from heavy pigs (López-Bote et al., Reference López-Bote, Isabel, Ruiz and Daza2003). Diet supplementation with copper and vitamin E did not have an effect on IMF content and FA composition of neutral and polar lipids from LT muscle in heavy pigs (Rey and López-Bote, Reference Rey and López-Bote2001). Therefore, in the present experiment, perhaps the meat from pigs fed granulated barley might have been more susceptible to oxidation than that from pigs fed conventional feed, but this aspect has not been studied in this work.
The vitamin A content in barley is very low (Fundación Española Desarrollo Nutrición Animal, 2010). D'Souza et al. (Reference D'Souza, Pethick, Dunshea, Pluske and Mullan2003) found that the vitamin A restriction in the diet increased IMF in LT muscle, although Olivares et al. (Reference Olivares, Daza, Rey and López-Bote2009a and Reference Olivares, Daza, Rey and López-Bote2009b) did not find any effect. Recently, Olivares et al. (Reference Olivares, Daza, Rey and López-Bote2011) observed, in Large White × (Large White × Landrace) barrows, an increase in IMF of LT muscle due to vitamin A reduction in the diet from 55 to 125 kg BW. In this line, Siebert et al. (Reference Siebert, Kruck, Davis, Pitchford, Harper and Bottema2006) reported in beef cattle that IMF was higher at lower dietary vitamin A concentrations, and Oka et al. (Reference Oka, Mauro, Miki, Yamasaki and Saito1998) observed in steers that the effect of vitamin A restriction depended on the initial age and weight of animals, being higher at younger ages. The reason could be that the effect of the vitamin A on IMF deposition is mediated by retinoic acid, which is a derivative that regulates the adipogenic differentiation of fibroblasts inhibiting the terminal differentiation of intramuscular adipose tissue (Kuri-Harcuch, Reference Kuri-Harcuch1982). According to Brandebourg and Hu (Reference Brandebourg and Hu2005), retinoic acid inhibits porcine preadipocyte differentiation. Moreover, retinoic acid is related to the regulation of the growth hormone gene expression (Bedo et al., Reference Bedo, Santisteban and Aranda1989), which in turn decreases IMF deposition. The current study indicates that the use of barley (poor in vitamin A and with a low protein : energy ratio) during the growing or finishing period might have been enough to increase IMF percentage.
FA profile of tissues
The granulated barley provided during the growing phase decreased SFA and increased PUFA and C18:1n-9/C18:0 and MUFA/SFA desaturation indexes in subcutaneous outer and inner layers from ham, and also increased MUFA in the subcutaneous outer layer. Studies in vivo and in cell lines show that vitamin A and the retinoic acid have a positive effect on stearoyl-CoA-desaturase activity, which is the enzyme that catalyses the formation of MUFA from SFA (Zolfaghari and Ross, Reference Zolfaghari and Ross2003). Nevertheless, there is scarce information on the influence of dietary vitamin A on the FA profile in pig tissues. Olivares et al. (Reference Olivares, Daza, Rey and López-Bote2009a) found, in backfat outer and inner layers from Duroc × (Large White × Landrace) pigs, that a diet low in vitamin A content decreased SFA and increased MUFA and C18:1n-9/C18:0 and MUFA/SFA desaturation indexes. However, Olivares et al. (Reference Olivares, Daza, Rey and López-Bote2011) observed in Large White × (Large White × Landrace) lean pigs that a dietary vitamin A low level had no influence on the MUFA or PUFA proportions of the backfat outer layer, although there was an increase in SFA proportion and MUFA/SFA ratio. In a previous study, Olivares et al. (Reference Olivares, Daza, Rey and López-Bote2009b) found different responses of dietary vitamin A on FA composition depending on the crossbreed; in lean pigs, a dietary supplementation with vitamin A decreased backfat and IMF saturation, whereas in moderately fatty pigs, similar to the present study, contrasting results were obtained.
Some trials have also been carried out on the effect of vitamin A on the FA profile of tissues in ruminants. Siebert et al. (Reference Siebert, Kruck, Davis, Pitchford, Harper and Bottema2006) observed lower C16:0 and SFA concentrations in backfat from Angus cattle but not in Holstein steers receiving a low level of dietary vitamin A, which suggests a possible effect of genetic type.
The FA compositions of subcutaneous outer and inner layers of ham from C and C + GB gilts were not different, which might indicate that the reduction in dietary vitamin A during the finishing phase had no influence on the FA composition of subcutaneous fat from dry-cured ham. In the current study, it seemed that restricting vitamin A intake during the finishing phase may not have been enough to affect the FA composition of ham subcutaneous fat from moderately fatty pigs but restricting vitamin A during the growing phase led to ham subcutaneous fat desaturation.
The GB + C treatment in comparison with the C treatment decreased SFA, tended to increase MUFA and had no influence on PUFA proportions in IMF of LT muscle, whereas in IMF of BF muscle increased MUFA, decreased PUFA and had no effect on SFA proportions. Similar results were found by Olivares et al. (Reference Olivares, Daza, Rey and López-Bote2009a and Reference Olivares, Daza, Rey and López-Bote2009b) in neutral lipids from LT muscle from Duroc × (Large White × Landrace) pigs. However, there is no experiment in the literature on the effect of dietary vitamin A level on the FA composition of IMF from BF muscle.
The C + GB treatment, in comparison with the C treatment, increased the MUFA concentration and the MUFA/SFA ratio, decreased PUFA and n-6 contents and had no influence on the SFA proportion in IMF from LT and BF muscles. Daza et al. (Reference Daza, Latorre and López-Bote2010) observed that Duroc × (Large White × Landrace) pigs fed granulated barley during the finishing period had increased C18:1n-9 and MUFA and decreased C18:2n-6, C18:3n-3, n-6, n-3 and PUFA concentrations, and there was no effect on the SFA proportion in IMF from LT muscle.
The quadratic relation found between C18:1n-9 and IMF percentages in LT muscle may be interesting for genetic selection as an increased IMF also increased the C18:1n-9 concentration, which means a parallel improvement in pork meat and fat quality. In the current experiment, the higher C18:1n-9 and MUFA proportions observed in the IMF from LT and BF muscles from C + GB and GB + C gilts might be explained because the activity of stearoyl-CoA-desaturase enzyme might have been increased when animals received rations with a low fat content (Wirth et al., Reference Wirth, Heuch, Holm and Bjorntorp1980) or rich in carbohydrates (Enser, Reference Enser1975). Furthermore, dietary vitamins, mainly vitamin A supplementation in C gilts, might not have led to an increase in stearoyl-CoA-desaturase activity likely because the gilts used in the present trial were from a moderately fatty crossbreed.
Conclusions
In heavy gilts, granulated barley provided during the growing or the finishing period improved some carcass characteristics mainly due to changes in the FA profile of backfat and also improved meat quality because IMF percentage and its major FAs increased.
Acknowledgements
This research was supported by Project PET-2007-08C11-05 (INIA, Spain). We thank Elifio Feliz de Vargas and Itziar Garitano (El Chantre, Teruel, Spain) for the care and control of experimental animals.