


1. Introduction
As part of the Norwegian Antarctic Research Expeditions (NARE), a mass-balance and glacier dynamics research project has been started on Jutulstraumen ice stream, western Dronning Maud Land, Antarctica. The project was initiated during the austral summer 1992-93 and lias beert continued during the 1993-94 and 1996-97 seasons. in this paper we discuss the results of surface mass-balance measurements obtained from stakes and shallow firn cores, concentrating on spatial variation in the accumulation. The temporal variation of accumulation and the climatic implications will be discussed in another paper.
Jutulstraumen ice stream
Jutulstraumen ice stream is located in Dronning Maud Land, near the Greenwich (zero) meridian (Fig. 1). Jutul-straumen with its ice-shelf area Fimbuliscn is fed by parts of Amundsenisen and Wegneriscn, and the total drainage system has an area of 124 000 km2 (N. F. Mclntyre, quoted by Reference SwithinbankSwithinbank, 1988). This makes it the largest ice stream in western Dronning Maud Land (15° W- 20° E). The inland ice is dammed by the mountain range Kirwanvcggcn and Neumayerskarvct to the west and H. U. Sverdrupfjclla, Gjelsvikfjella and Miinhg-Hofmannfjella to the cast, and ice is channelled through Jutulstraumen. The mainstream follows a major deep valley believed to be of structural origin (Dccleir and Van Autenboer, 1982). A more detailed description of the physiography of the area is given by Reference SwithinbankSwithinbank (1959, 1988) and Reference GjessingGjessing (1972). Reference HoydalHoydal (1996) used new surface-velocity measurements obtained during NARE 1992-93 and gravity profiles across Jut nisi räumen and Viddalen presented by Dccleir and Van Autenboer (1982) to calculate an ice discharge of 13.1 km3 a−1 at latitude 72°15' S (about 40-50 km south of the grounding line at an elevation of 1000 m a.s.l.).
2. Methods
The approach followed in this work is based on traditional methods of obtaining data on surface accumulation in Antarctica: direct stake readings and shallow-core analysis.
Stake measurements
During the first field season (1992 93), 44 accumulation and velocity marker stakes were set up in the elevation range 710-1200 m a.s.l. (Fig. 1). Thirty-six of these slakes were placed between Nashornkalvanc and Jutulrora, giving a 50 km long line across Jutulstraumen (profile 1), and six stakes were planted between Nashornkalvanc and Istind (profile 2). The stake spacing was about 4 km, except for three rectangular strain nets with nine stakes (3 x 3) in each with a spacing of about 1 km. Stakes were also put out at drill sites B and D in 1992-93 and E, F, G and H in 1993 94. The height of all stakes not covered by snow was measured during the 1993-94 season (19 of 42 stakes) and the 1996-97 season (4 of 48 stakes). The snow accumulation from the stakes was converted to water equivalents by multiplying by snow-density values taken from a mean densifica-tion curve. The curve was obtained from a compilation of density profiles from five pits for depths of 0—1.5 m and from cores at depths greater then 1.5 m (Melvold and others, 1996;
Jutulstraumen and Fimbulisen, showing the stake profiles (P-1 — profile 1; P-2 = profile-2) and shallow -core sites.

Hagen and Melvold, 1997). For the accumulation calculation it is assumed that the bottom of each stake is firmly fixed.
In conjunction with the stake readings made in 1993, stake positions along profiles 1 and 2 were measured using phase-tracking kinematic global positioning system (GPS) techniques (see Reference Eiken, Hagen and MelvoldEiken and others, 1997, for a full description of the technique used). Along profile 1 (Fig. 1) and in the three strain nets the same techniques were used for surface levelling. The measurements were carried out with an epoch time of 5 seconds, giving a 30 m spacing between the measured surface elevation points. Static GPS techniques were used to position the core locations and the stakes. The measurements were always carried out with a reference receiver on fixed point.
Shallow cores
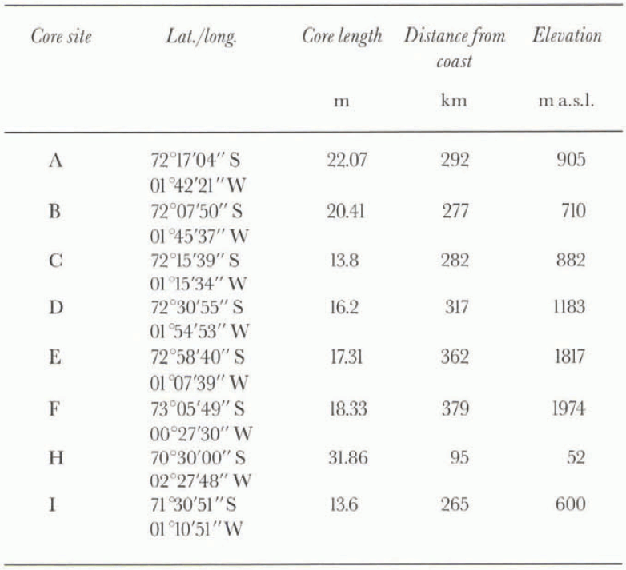
During the two field seasons, nine shallow firn cores with depths of 13-32 m were drilled at different sites in the drainage area. The site elevations ranged from the ice shelf up to about 2400 m a.s.l. (Fig. 1). A Polar Ice Coring Office (PICO) lightweight auger with a diameter of 7.69 cm was used. Density profiles were determined in the field by measuring the length, diameter and weight of each core section (10-40 cm). The density of the uppermost metre was measured in a snow pit, as the core broke apart due to the low density. All firn-core sections were packed in plastic tubes and returned frozen to Norway. Core length, distance from coast and position of each core are listed in Table 1.
Positions of firn cores
Laboratory
The firn cores were cut and prepared in a cold laboratory for measurements of stable oxygen isotopes, total β radioactivity and gamma spectrometry. For the radio-isotope measurements, samples with a mass of about 200 g (length 10—20 cm) were cut contiguously from the cores to ensure an adequate temporal resolution. These samples, a total of 900, were melted, acidified and pumped through ion-exchange filters (Dclmas and Pourchet, 1977), after which total β radioactivity was measured by methods described by Pin-glot and Pourchet (1979). Assemblies of ion-exchange filters were made for high-resolution gamma spectrometry (about five gamma-ray samples per firn core), to detect the Cs fall-out (the most abundant artificial long-lived radionuclide) (Pinglot and Pourchet, 1981).
For the oxygen-isotopic ratios (δ18o), samples were cut contiguously along the length of the cores. The sample length ranged from about 4cm for the coastal sites and gradually decreased to 1.5cm for core Fon the plateau, in order to ensure that about 15 samples per annual layer could be obtained for detection of the annual signal (Reference Peel and ClausenPeel and Clausen, 1982). Accumulation records from previous expeditions were used to select appropriate sample thickness (Schylt, 1958; Reference LundeLunde, 1961; Reference OrheimOrheim and others, 1986; Reference Isaksson and KarlénIsaksson and Karlen, 1994).
3. Results
Stake tneasuretnents
Accumulation
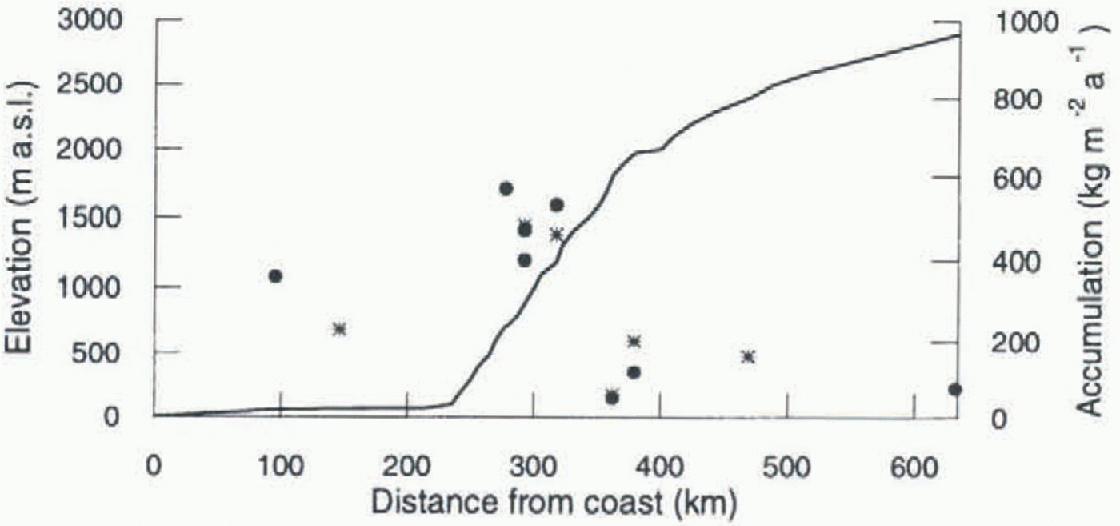
The accumulation pattern found from stake measurements shows a large spatial variability along Jutulstraumen. The
Surface elevation and accumulation along Jutulstraumen traverse from the ice-shelf edge to the plateau. The elevations are taken from topographical maps and GPS measurements at the core locations. Alean accumulation obtained from the cores and the slakes is shown br solid circles and solid stars, respectively. Data on ike accumulation at 620 km arefrom Isaksson and others (1996).
Accumulation rate measured at stakes shown by solid circles between 1993 and 1994 and surface elevation along the 50 km long profile 1. Solid crosses show the minimum accumulation for stakes covered by snow between 1993 and 1994, and open circle the mean value between 1993 and 1997. The locations of Nashornkalvane and Jutulmra are indicated. Note the large exertion of the elevation.
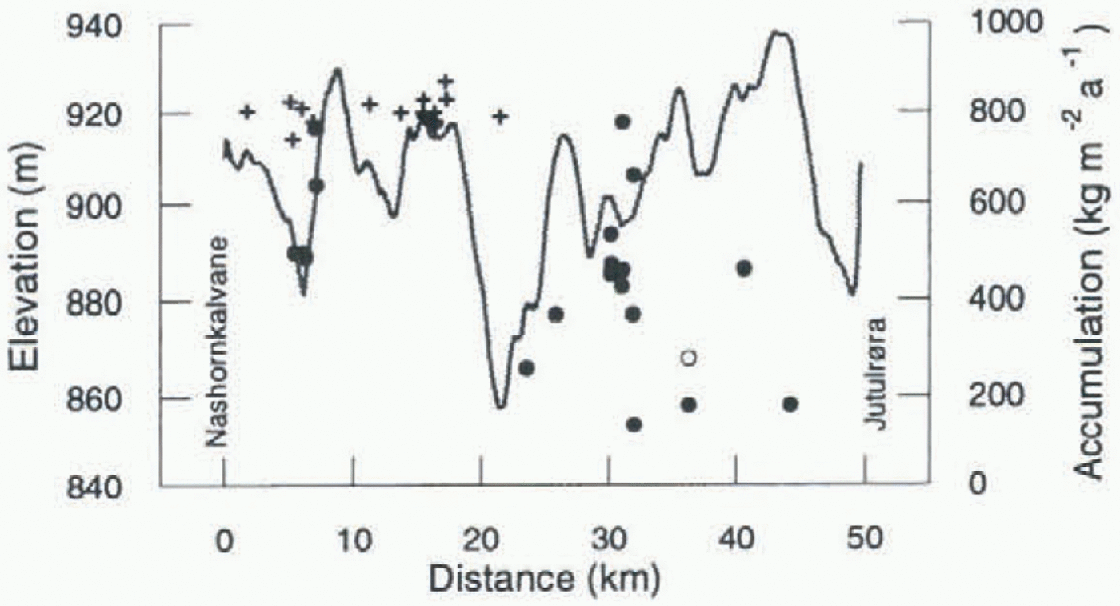
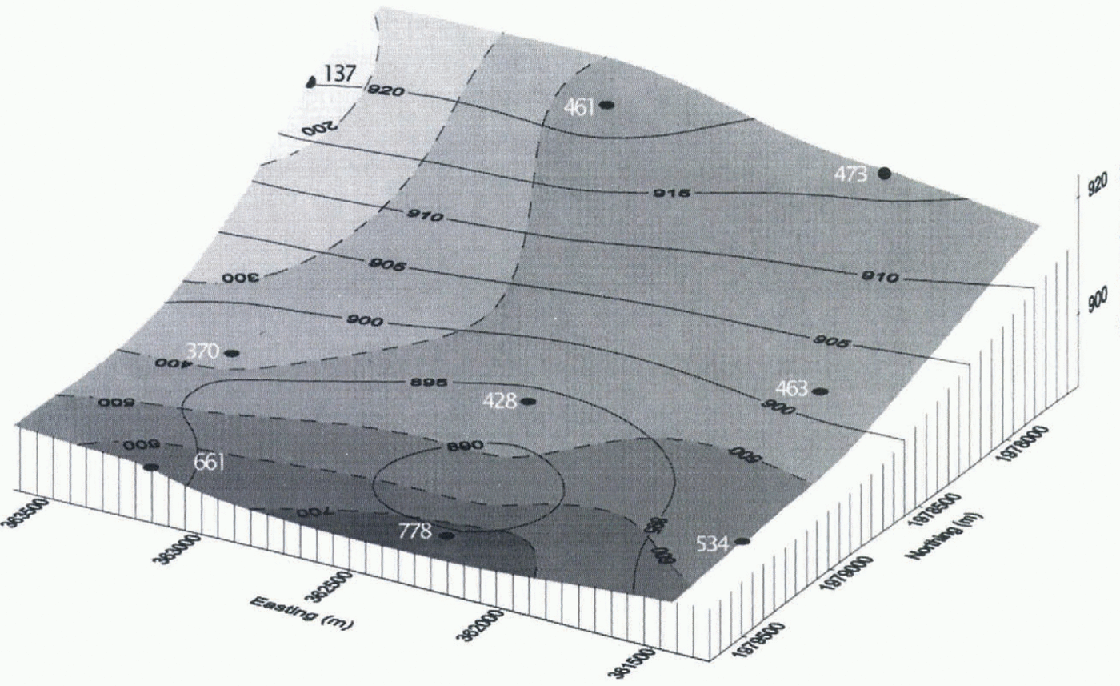
accumulation ranges from 230 kg m −2a−1 at the ice shelf to a mean of 460 kg m−2 a−1 at 900-1000 m elevation, to 160 kg m2 a−1 at 2400 m elevation (Fig. 2). For a 1 year period (1993-94) along the 50 km long profile (profile 1) crossing Jutulstraumen at about 900 m a.s.l. (Fig. 3) the accumulation ranged from 140 to more than 780 kg m−2 a−1. The mean value was 460 kg m−2a−1 and its standard deviation was 190 kg m−2a−1, Figure 3 shows the measured accumulation at 19 of the 36 measured stakes, and the estimated minimum accumulation at the 17 stakes which were covered by snow during the 1994 measurements. Minimum accumulation was estimated by setting the snow depth equal to total stake height above the snow surface in 1993. The accumulation rate across Viddalcn (profile 2) is greater than 780 kg m−2 a−1 (only one of six stakes was not covered by snow) except in the area close to the Nashornkalvane nunatak (a stake was situated 700 m north of the nunatak) where an accumulation rate of only 180 kg m−2 a−1 was found. Large areal variability in accumulation rate was also found with in the three stake strain networks siluated in profile 1. This is illustrated in Figure 4 which shows the spatial distribution of accumulation for a stake network (3x3 stakes) situated 15 km west ofjutul-rora nunatak. The distribution was obtained by kriging interpolation of the measured accumulation at the stakes (Fig. 4). The variation in net accumulation rate was systematic and reached 100% (500 kg m −2 a−1) in less then 3 km between 1992-93 and 1993-94.
Surface elevation
Surface elevation profiles across Jutulstraumen obtained from the kinematic GPS levelling are shown in Figure 3. They show small-scale undulations in the surface topography, with shallow valleys and low ridges. A maximum height difference of 80 m between the valley bottom and corresponding ridges was found in the central part of the
Spatial distribution of accumulation shown by field contours, and measured accumulation at stakes shown by crosses in kg m −2 a−1 for strain net 3. The accumulation is draped over the DEM of the plots, and contour interval is 5 m.
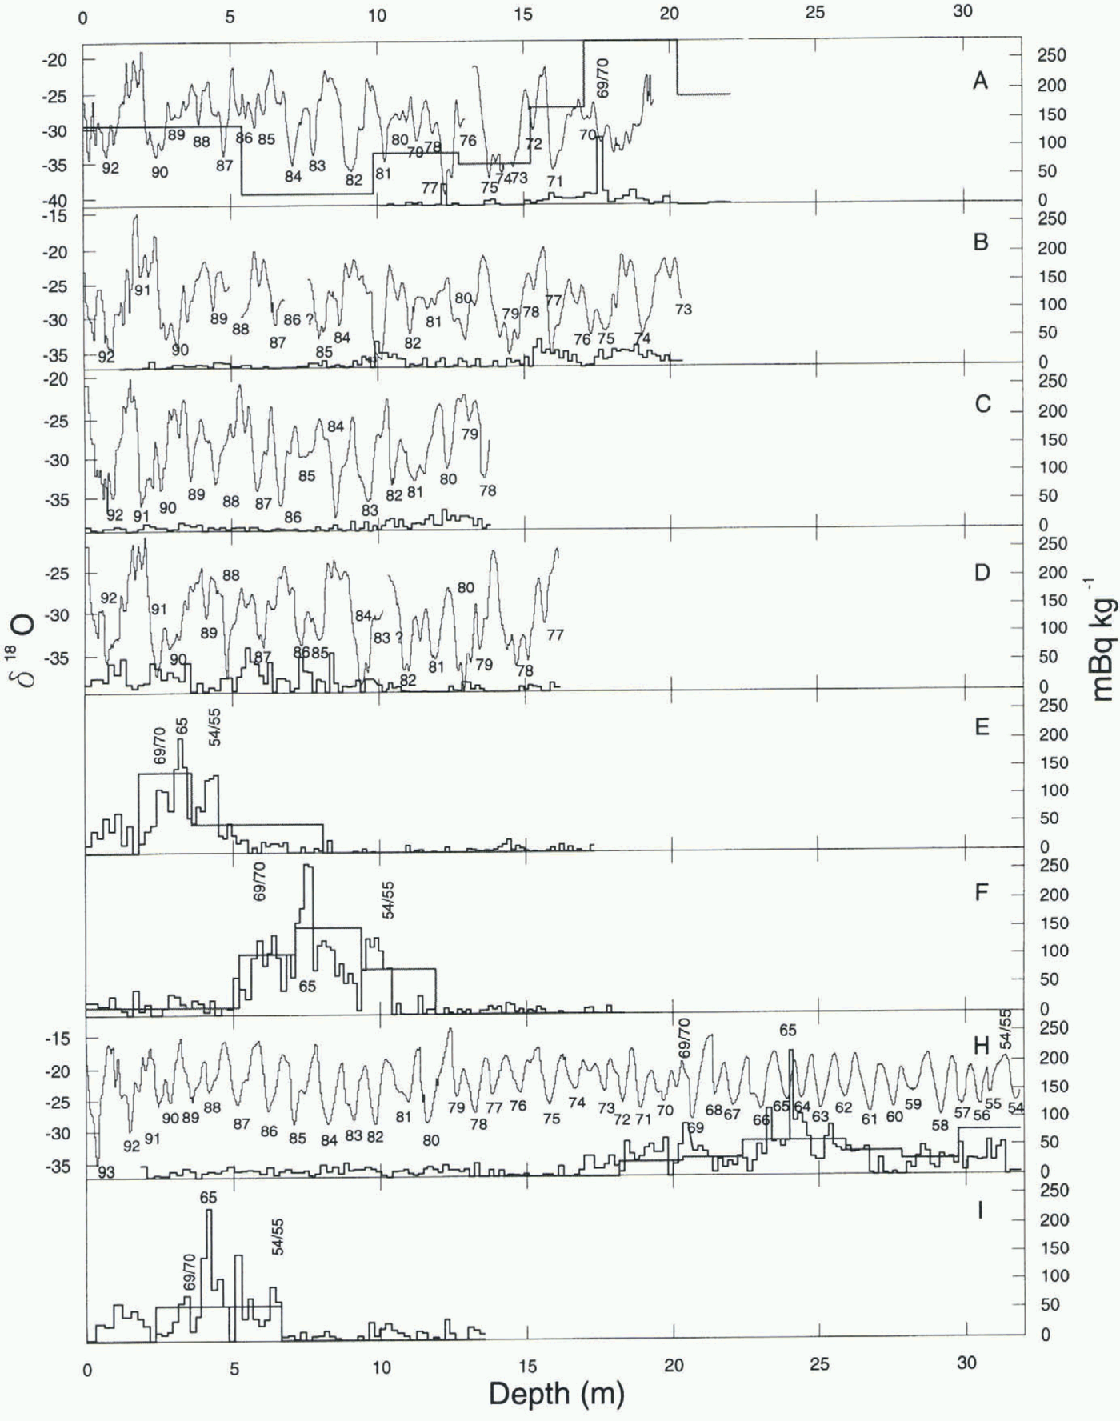
Specific total β radioactivity (heavy line), gamma137 Cs (dotted line) activity for cores A-F, H and I, and oxygen δ18o profiles at sites AD and H. Adapted time-scales are shown. The dating is tentative on cores A-D. The scale for 137Cs activity is only 1/10 of the mBq kg−1 shown in thefigure.
cross-profile. A digital elevation model (DEM) of the surface in the stake strain network situated 15 km west ofjutul-rora nunatak was interpolated (Fig. 4). The DEM was derived from over 200 measurements of surface elevation retrieved from the phase-tracking kinematic GPS survey in 199.1 Generally, the maximum surface slope (aspect north) follows the flow direction from south to north. Over the whole area, surface slope varies from less then zero in a concavity in the north-central section to about 2.0° in the southeastern section.
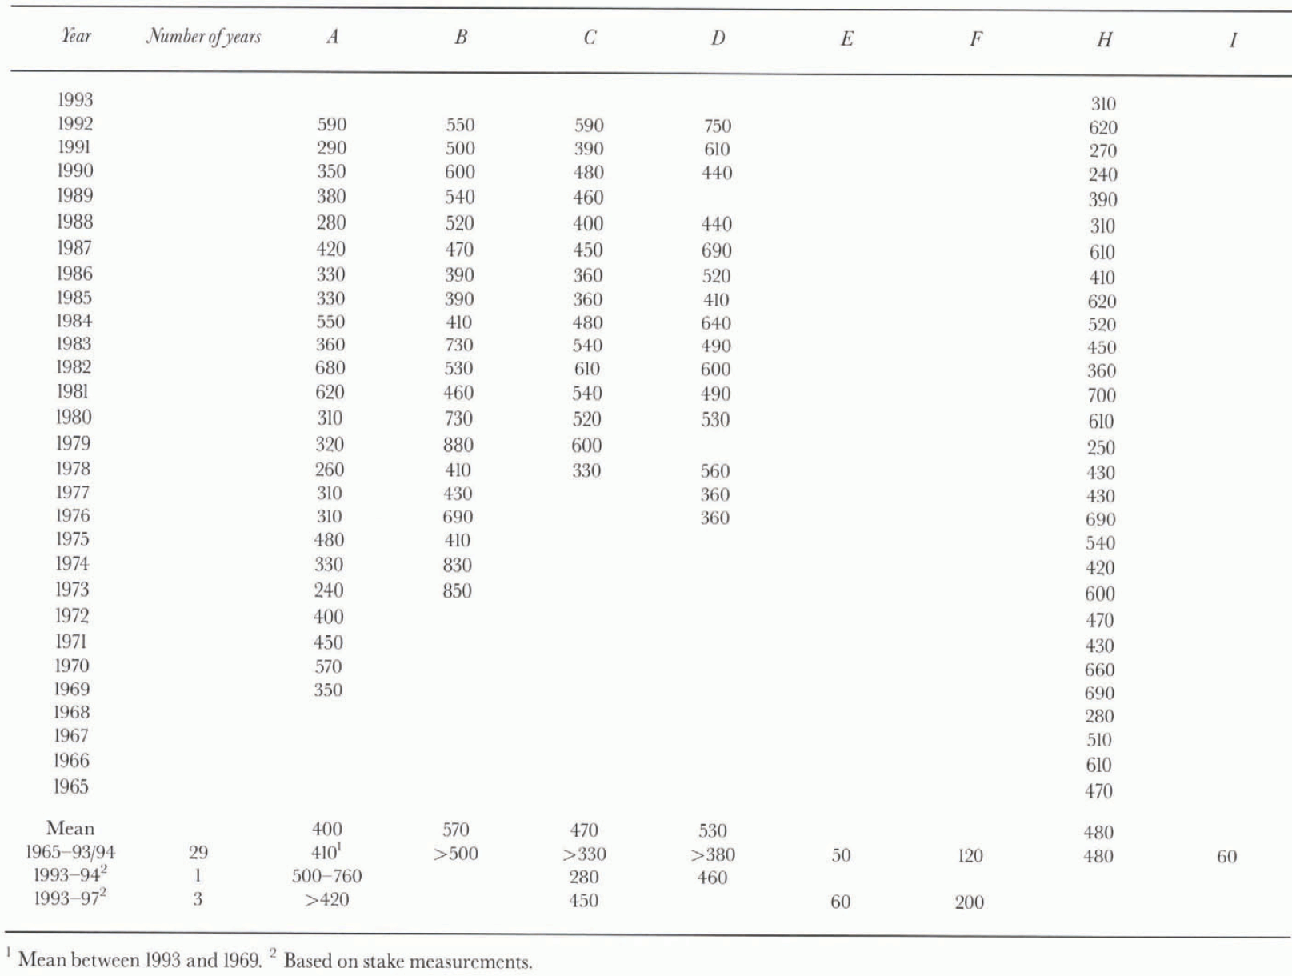
Annual accumulation rates in kg m −2 a−1 for core sites A-D and H, based on the δ18Ó stratigraphy. Mean accumulation over the 1993—95period in kg m−2a−1 for firn cores A, E, F, Hand I, based on β radioactivity
Firn-core stratigraphy
isotope profiles
Core H from the ice shelf close to Norway station (Fig. 1) is taken as the reference for the radioactivity and stable oxygen-isotope profiles, as its high accumulation rate of 480 kg m −2 a−1 results in the best vertical resolution. Figure 5 illustrates the β radioactivity profile along with the l37Cs and δ18o for this core. The β radioactivity profile exhibits one clear maximum at a depth of 24.12-24.28 m, and one less pronounced peak at a depth of 20.67-20.85 m. We assume that these two peaks correspond to January 1965 and January 1969 (e.g. Reference Picciotto, Crozaz, de Brcuck and CraryPicciotto and others, 1971; Clausen and others, 1979; Reference Aristarain, Pinglot and PourchetAristarain and others, 1987). The δ18o stratigraphy shows well-developed seasonal variation (characterised by high δ18o content in summer snow layers and low δ18o content in winter snow layers), but the amplitudes clearly reduce with increasing depth. The annual δ18o cycles, however, are still preserved, allowing year-to-year dating. The radioactivity peaks of 1965 and 1969 coincide with 1965 and 1969 identified by counting the delta cycles. The first increase in β radioactivity occurs near the bottom of the core at a depth of 31 m. This increase which is assumed to be the 1954—55 summer coincides with January 1955 identified by counting annual variations in δ18o. The 1969 and 1965 levels are confirmed by gamma spectrometry which gives a 137Cs fall-out of 30 Bq m −2 (at time of measurement).
We have no clear interpretation for the occurrence of 137Cs below 30 m as it is correlated with low values of total beta.
figure 5e, f and i illustrate the β radioactivity profile, along with the 137 Cs for each of the samples in cores E, F and L Note the similarity between the individual cores and the similarity with the profile of core H. Note also the similarity in mean values for the β radioactivity at the 1969 and 1965 levels in the different cores. in these radioactivity profiles the shift in activity from a low background value of 0-40mBqkg−1 to approximately 100-150 mBq kg−1 is assumed to be the 1954-55 summer level. This interpretation is similar to results from elsewhere in Antarctica (e.g. Picciotto and others, 1971; Clausen and others, 1979; Petit and others, 1982; Aristarain and others, 1987). The shift is weaker than found in records from the Antarctic interior (e.g. Petit and others, 1982) but similar to what is recognised in records from coastal stations in western Dronning Maud Land (Isaksson and Karlen, 1994) and the Antarctic Peninsula (Aristarain and others, 1987). Cores E, Fand I lack a well-defined seasonality in the concentrations of δ18o. The period 1964-94, represented by 4.45, 7.55 and 4.15 m of firn above the reference horizon of 1964-65, contains not more than 6 (E), 16 (F) and 7 (I) more-or-lcss clear delta cycles, while a complete, undisturbed layering should contain 29 annual delta cycles. This means that the observed delta cycles cannot be interpreted as representative of annual accumulation.
figure 5a-d illustrate the β radioactivity profile along with the 137Cs and δ18o for each sample in cores A-D. Note that no clear increase in β radioactivity and 137Cs occurs in cores B-D, while an increase occurs at a depth of 17.50-17.71 m in core A. We assume that the 1965 and 1969 horizons are never reached at core sites B-D and that the increase in β radioactivity in core A corresponds to the 1969 horizon. This assumption is based on the fact that the 1969 β radioactivity horizon has similar mean values in core A and in cores E, F, I and H. The variations in δ18o at core sites AD show a less pronounced signal than in core H. The signal is partly cyclic, but some annual layers contain double peaks, a phenomenon also known from the Antarctic Peninsula (Peel and Clausen, 1982). in some years, the annual δ18O cycles are smaller than normal (e.g. 1984-85 in core D). The difference of less than 10‰ between summer and winter surface is common for these layers. Consequently, year-by-year dating using δ cycles is not straightforward and any interpretation must be tentative. Nevertheless, a dating is given in Figure 5, using the fact that the 1969 level is never reached in cores B D and just reached in core A, as dated independently by β radioactivity.
Accumulation
Based on the chronological information deduced from the β radioactivity and δ18o the snow-accumulation increments were converted to mass using density profiles obtained from the core siles. The mean values for the period 1965-93 are calculated for cores E, F, H and A (1969-93) (table 2). The mean annual accumulation values for cores A-D in the period covered by each core are given in Tabic 2. They show considerable interannual variability, up to 250% (table 2). The error is assumed to be between ± 10 and ± 100 kg m−2a−1, taking into consideration errors in the density determination, the depth measurements and the sampling procedures.
The spatial accumulation distribution along Jululstrau-men is shown in Figure 2, where the accumulation and elevation profiles are plotted against distance from the coast and moisture source. The elevations are based on topographical maps (Norsk Polarinslitutt map sheet No. G5 G7) and elevations measured at the core sites by GPS. Accumulation values obtained from both stake measurements and cores are shown. Lunde (1961) found that the accumulation rate between 1957 and 1959 on thejutulstraumen part of Fimbulisen was only 74% of the accumulation at Norway-station (core site H). Assuming that this pattern still exists, we have calculated the accumulation rate from the mean accumulation rate obtained at site H. The values are shown in Figure 2.
4 Discussion
The areal variability of the rate of accumulation can be split into regional and local terms (Reference Giovinetto and MellorGiovinetto, 1964). The regional term in this work is the variation alongjutulstraumen from the ice shelf to the plateau. The local term has been split into two parts, along profile 1 and the areas covered by the 3 km x 3 km strain network.
Variation in accumulation across Jutulstraumen
Surface elevation and surface accumulation along profile 1 are shown together in Figure 3. The profile is 50 km long and runs across the flow direction and mean slope of the ice stream and the mean katabatic wind direction. The accumulation variation is not related to the surface topography (e.g. both high and low accumulation occurs on local hills and hollows). The surface undulation is therefore not directly a result of different accumulation across the ice stream but is most probably a result of the underlying bedrock topography. Across Jutulstraumen the spatial variations in accumulation are considerable and cannot readily be explained by across-valley relief. However, as will be seen later, the downslope surface gradient largely controls the accumulation over small geographical areas.
Superimposed on the large variations in accumulation across Jutulstraumen is a decreasing trend in the eastern margin towards the nunatak Jutulrora. A blue-ice area exists north of Jutulrora, indicating even lower accumulation occurs at this site. If we use the interpretation of Van den Brocke and Bintanja (1995), this low accumulation can be explained by wind-scouring and reduced deposition of drifting snow as a result of shielding by the nunatak. The low-accumulation area situated north and west of the Jutulrora is compatible with the effects of a southeast katabatic wind. in the area close to the Jutulrora nunatak, the decrease in accumulation may be explained by erosion effects due to wind-channelling by the nunatak. The same effect was found on two stakes close to the northern Nashornkalvane nunatak on the western side of Jutulstraumen. The higher accumulation in the central and western pari may be explained by accumulation of drifting snow. The results indicate that deposit of transported snow is an important factor in accumulation on this part ofjutul-straumen.
Variation of accumulation with minor topography A further investigation of the areal variability of accumulation related to surface topography was conducted on a local scale for the areas covered by the strain network (3 km x 3 km) (Fig. 4). The distribution of surface accumulation seems to be strongly influenced by the local topography with respect to the katabatic wind direction. The surface accumulation is smallest where the leeward slope is largest, and the accumulation is a maximum downstream where the leeward slope is small. A negative correlation of-0.7 was found between leeward surface, slope and accumulation rate. This shows that the accumulation regime depends on the down-slope surface gradient (aspect northwest). The same relation was also found for the two other strain nets located in profile 1 (Fig. 1) and has been recognised in previous studies such as Reference Black and BuddBlack and Budd (1964), Reference Gow and RowlandGow and Rowland (1965) and Reference WhillansWhillans (1975). The large variability, up to 100%, in accumulation over The strain net is due to differences in removal and deposit efficiency of the surface snow layers related to the local surface slope, a process that will lower the positive relief feature and fill the hollows. Some of the variations could also be due to migration of longwave dunes as reported from measurements near Byrd Station (Reference WhillansWhillans, 1978) and in eastern Kemp Land (Reference Goodwin, Higham, Allison and JiawenGoodwin and others, 1994). During the summer, when measurements were taken, the small-scale relief (sastrugi and dunes) is 0-0.3 m, equivalent to about 10 kg m −2 a−1 of accumulation. The aspect-dependent accumulation pattern is thus the most important factor for the areal variation in mass balance in this pari of Jutulstraumen.
Effect on firn-core stratigraphy
Considerable interannual variability, up to 250%, was found in annual accumulation from the firn-core stratigraphy (table 2). The variability is due to the combined effect of year-to-year “climate” variations, flow of the ice stream (ice in the core did not accumulate at a single location) and the effect of drifts and sast rugi (micro-relief). The accumulation records from the cores have not been adjusted for the upstream accumulation gradient, since this is assumed to be negligible over the few km distance from which the snow originated. The elfect of movement of the core site through geographical variations in surface mass balance, however, does need to be considered for cores A D in the ice stream, where the ice movement rate is high (200-400 m−2a−1), but not at core site H where the ice movement is only a few ma1. figure 4shows that large horizontal variations in surface mass balance of up to 500 kg m−2 a−1 occur over a distance of less then 3 km parallel to the flow direction. The effect of the variations will most probably be preserved in the firn-core stratigraphy since microrelief features aie pic-served (Whillans, 1978; Petit and others, 1982). This demonstrates that a large part of the variability in annual accumulation rates at core sites A-D could be due to the effect of moving the core-hole site through a geographically fixed variation in surface mass balance, and not climatic variations. The long time mean will therefore be a more reliable estimate of net accumulation.
Variation of accumulation with major topography
Generally, surface mass balance decreases with distance from the coast, varying from about 230 kg m−2 a−1 in the coastal region to less then 160 kg m −2 a−1 at the front of the plateau, 420 km inland and 2414 m a.s.l. This pattern seems to continue further into the plateau, and an accumulation of only 77 kg m 2 a−1 was found by Isaksson and others (1996) at 75°S, 2° E, a distance of 620 km from the coast at 2900 m a.s.l. This overall decreasing trend is expected since precipitation (accumulation) is a function of distance from moisture source, temperature and elevation (Reference Fortuin and OerlemansFortuin and Oerlemans, 1990; Giovinetto and others, 1990).
Figure 2 also shows that the region between 270 and 300 km (elevation interval 900-1200 m a.s.l.) diverges from the general trend in having a relatively high accumulation. A similar phenomenon was found (900-1200 m a.s.l.) on the ice sheet further west for the period 1957-59 (Swithinbank, 1959). The accumulation pattern there was related to altitude effects and deposits of snow transported by katabatic winds. On Jutulstraumen a change in the nature of the topography occurs on moving from the relatively flat ice-shelf area to the steeper ice stream. The change in topography causes orographic uplift and adiabatic cooling of humid air, giving rise to a zone of increased precipitation. in the same interval, Jutulstraumen changes flow direction (Fig. 1) from north to northeast. This probably causes a decrease in katabatic wind speed since the katabatic winds will only partly follow the ice stream, resulting in deposits of drifting snow. The effect of the snow deposits on the accumulation rale in this area is demonstrated by the stake measurements along profile 1. The relatively high accumulation between 900 and 1200 m elevation is thus a result of both increased precipitation due to orographic uplift and increased deposition of transported snow due to divergence and decrease of katabatic wind speed.
A major accumulation deficit is found at core sites E and I (Fig. 2). Core site E is located in an area of small-scale (few km) hills, and the surface microrelief is characterised by lanceolate sastrugi developed in wind-crusted snow (using Goodwin's (1990) classification). About 5 km to the west, blue ice could be seen on a large convexity. Relatively low accumulation on convex, as compared to concave, topography has been reported from various Antarctic studies (e.g. Reference SchyttSchytt, 1958; Swithinbank, 1959; Gow and others, 1972; Whil-lans, 1975; Reference Takahashi, Ageta, Fujii and WatanabeTakahashi and others, 1994). Modelling results of winter air-flow patterns over the Antarctic ice sheet by Reference Parish and BromwichParish and Bromwich (1987) and Reference ParishParish (1988) show that Jutulstraumen is located in a broad-scale confluence zone of katabatic winds. Strong soulheasl katabatic winds are thus expected during winter, resulting in correspondingly large transport and erosion potential along the ice stream. Wind speed is accelerated on convex topography because of the higher surface slope. The most plausible explanation for the low accumulation at core site E is erosion due to wind-scouring. Wind-scouring would also expla in the ambiguous oxygen stratigraphy found in core E since it has been shown that wind-scouring has a large effect on the oxygen-isotope profile (Reference Fisher, Koerner, Paterson, Dansgaard, Gundestrup and ReehFisher and others, 1983).
Core site I (700 m a.s.l.) is not in the drainage basin of Jutulstraumen but about 30 km east and 20 km south of the grounding line in a region where katabatic winds diverge horizontally on the north aspect slope. This is an area of mixed snow and blue-ice fields. The north-sloping area is favourably exposed to incoming solar radiation, and low accumulation rates result front the strong katabatic winds (Reference Winther, Elvehøy, Bøggild, Sand and ListonWinther and others, 1996). A gradual decrease in the blue-ice extension can be seen on Norsk Polarinstitutt satellite maps (sheet No. H5S, Jutulgryta) on moving towards core site 1 nearer the mountains H.U. Sverdrupfjella (Fig. 1). The low accumulation rate at site I could therefore be a result of one or more of wind-scouring, low precipitation or higher sublimation rates.
5. Conclusions
Generally, the surface mass balance decreases with distance from the coast and increased elevation: from about 230 kg m−2a−1 in the coastal region to less than 160 kg m −2 a−1 at the front of the plateau at a distance of 420 km from the coast and 2414 m a.s.l. However, divergence from this general trend is found in the elevation interval 900-1200 m a.s.l. where relatively high accumulation of up to 780 kg m−2a−1 occurs. A major accumulation deficit is found at core sites E and I.
Locally we found large variations of up to 100% in accumulation rate over distances of less then 3 km. The accumulation distribution was found to be dependent upon local surface topography and more specifically on the downslope surface gradient or aspect with respect to the katabatic wind direction. Some of the variations could also be due to migration of longwave dunes (Whillans, 1978; Goodwin and others, 1994), but this seems to play a minor role. The studies demonstrate the importance of the local topography for the interpretation of firn-core stratigraphy. The largest part of the interannual variability in accumulation rates found in the cores from the fast-flowingjutulstraumen could be due to the movement of the core site through a horizontal, geographically fixed variation in surface mass balance. The results are important for the interpretation of temporal variations of existing firn cores and for the selection of new sites for core drilling. The long time mean should be used for the most reliable estimate of the net accumulation.
Acknowledgements
We are grateful to Norsk Polarinstitutt, Oslo, for logistical help and for their excellent organisation of the expeditions, NARE 1992-93, 1993-94 and 1996-97. We are also grateful to our colleagues at the Geophysical Department, University of Copenhagen, and at the Laboratoire de Glaciologie et Géophysique de l'Environnement, Grenoble, who have been extremely helpful with the core analysis. We would like to thank our field assistants, T. Laumann,T. Tönning and C. Rolstad, and we are grateful to H. Elvehoy, C. E. Boggild and K. Sand for drilling core I. The project was financed by the Norwegian Research Council. This is publication No. 146 of NARE (1996-97).



