Introduction
Zeolite rocks are an important subject of study, both from a scientific and applied point of view. Translated from Greek, zeolite means ‘boiling water’, which is associated with their property of actively desorbing water with a characteristic hissing sound when heated. In mineral terms, zeolites form a whole group consisting of more than 200 minerals that differ from each other in the ratio of aluminum to silicon, the size of zeolite channels, the shape of crystals, etc. (Marantos et al., Reference Marantos, Christidis and Ulmanu2011). The most common minerals of the zeolite group that form commercial deposits are heulandite, clinoptilolite, mordenite, phillipsite, and chabazite.
Unlike clay minerals, which have a layered structure capable of swelling, zeolites have a rigid crystalline framework. Defects in the crystal lattice, formed due to isomorphic substitutions of Al for Si in the tetrahedra, lead to a negative charge in the zeolite framework. The tetrahedra are arranged in such a manner that form three-dimensional channels. It is this feature that allows zeolites to be used as molecular sieves (Marantos et al., Reference Marantos, Christidis and Ulmanu2011). Gas purification systems and the production of catalysts are based on this principle. In addition to the oil and gas sector, zeolites are widely used in agriculture and livestock farming, as an ameliorative additive and a source of useful micro- and macroelements that promote plant growth, as well as in the form of feed and hygienic bedding for livestock (Ming and Boettinger, Reference Ming and Boettinger2001; Kordala and Wyszkowski, Reference Kordala and Wyszkowski2024). The use of zeolites as a biologically active supplement by humans has also proven its effectiveness. Due to their superior ion-exchange properties, zeolite filters are able to decontaminate polluted water quickly and effectively (Burov et al., Reference Burov, Distanov, Zainullin, Konyukhova, Mikhailov, Nasedkin, Plenkin and Sabitov1990; Milyutin et al., Reference Milyutin, Belousov, Nekrasova and Krupskaya2023; Gadore et al., Reference Gadore, Mishra, Yadav, Yadav and Ahmaruzzaman2024).
About 120 deposits and occurrences of zeolites have been identified in Russia, but the State Register of Reserves lists only 18 deposits, and the extraction of zeolite rocks is of minor importance, with only four deposits being exploited. The Khonguruu deposit, located in the Republic of Yakutia, is one of the main sources of volcanic zeolite in Russia in terms of production volumes, but the majority of extracted zeolite raw materials are used as fillers in the production of concrete. Therefore, the study of the mineralogical composition and physical properties of the Khonguruu deposit is an important task that requires special attention, which will expand the areas of application of zeolites of this deposit.
One of the difficulties in studying the Khonguruu zeolites is the presence of heulandite and clinoptilolite, both members of the heulandite (HEU) group. Having the same crystal lattice parameters, their identification by direct methods, such as X-ray phase analysis, is difficult. The main difference between the structure of heulandite and clinoptilolite is the degree of order and stability of their crystal lattices (Yamamoto et al., Reference Yamamoto, Sugiyama, Matsuoka, Honda, Banno and Nozoye1998; Bish and Boak, Reference Bish and Boak2001). Heulandite is characterized by a more complex and variable structure with less SiO2, while clinoptilolite has a more regular and stable structure, a high silica content, and is more thermally stable (Sacerdoti and Lucchetti, Reference Sacerdoti and Lucchetti2010; Kantiranis et al., Reference Kantiranis, Sikalidis, Godelitsas, Squires, Papastergios and Filippidis2011).
According to their thermal stability, three types of heulandite are recognized (Alietti, Reference Alietti1972; Gottardi and Galli, Reference Gottardi and Galli1985): heulandite types 1, 2, and 3. Heulandite type 1 is characterized by appearance of the polymorphic transitions up to 400°C. After heating to 450–550°C the structure collapses. Heulandite type 2 is characterized by the co-existence of several polymorph phases beyond 550°C. Finally, heulandite type 3, also known as clinoptilolite, is stable after heating to ~700°C, without the appearance of other polymorph phases. For this reason, indirect methods have to be used for their qualitative and quantitative identification of heulandites. Differentiating between heulandite and clinoptilolites by the Si/Al ratio in this case is also not possible, as the zeolite layers have undergone secondary changes and the presence of amorphous silica in the rocks affects the value of the coefficient greatly.
The main objective of the present study is to investigate the geological history and the conditions of zeolite formation of the Khonguruu deposit, and to establish the physical and chemical properties of these zeolites, including the sorption capacity in relation to cesium radionuclide.
Regional geology and geology of the Khonguruu zeolite deposit
Overall geology
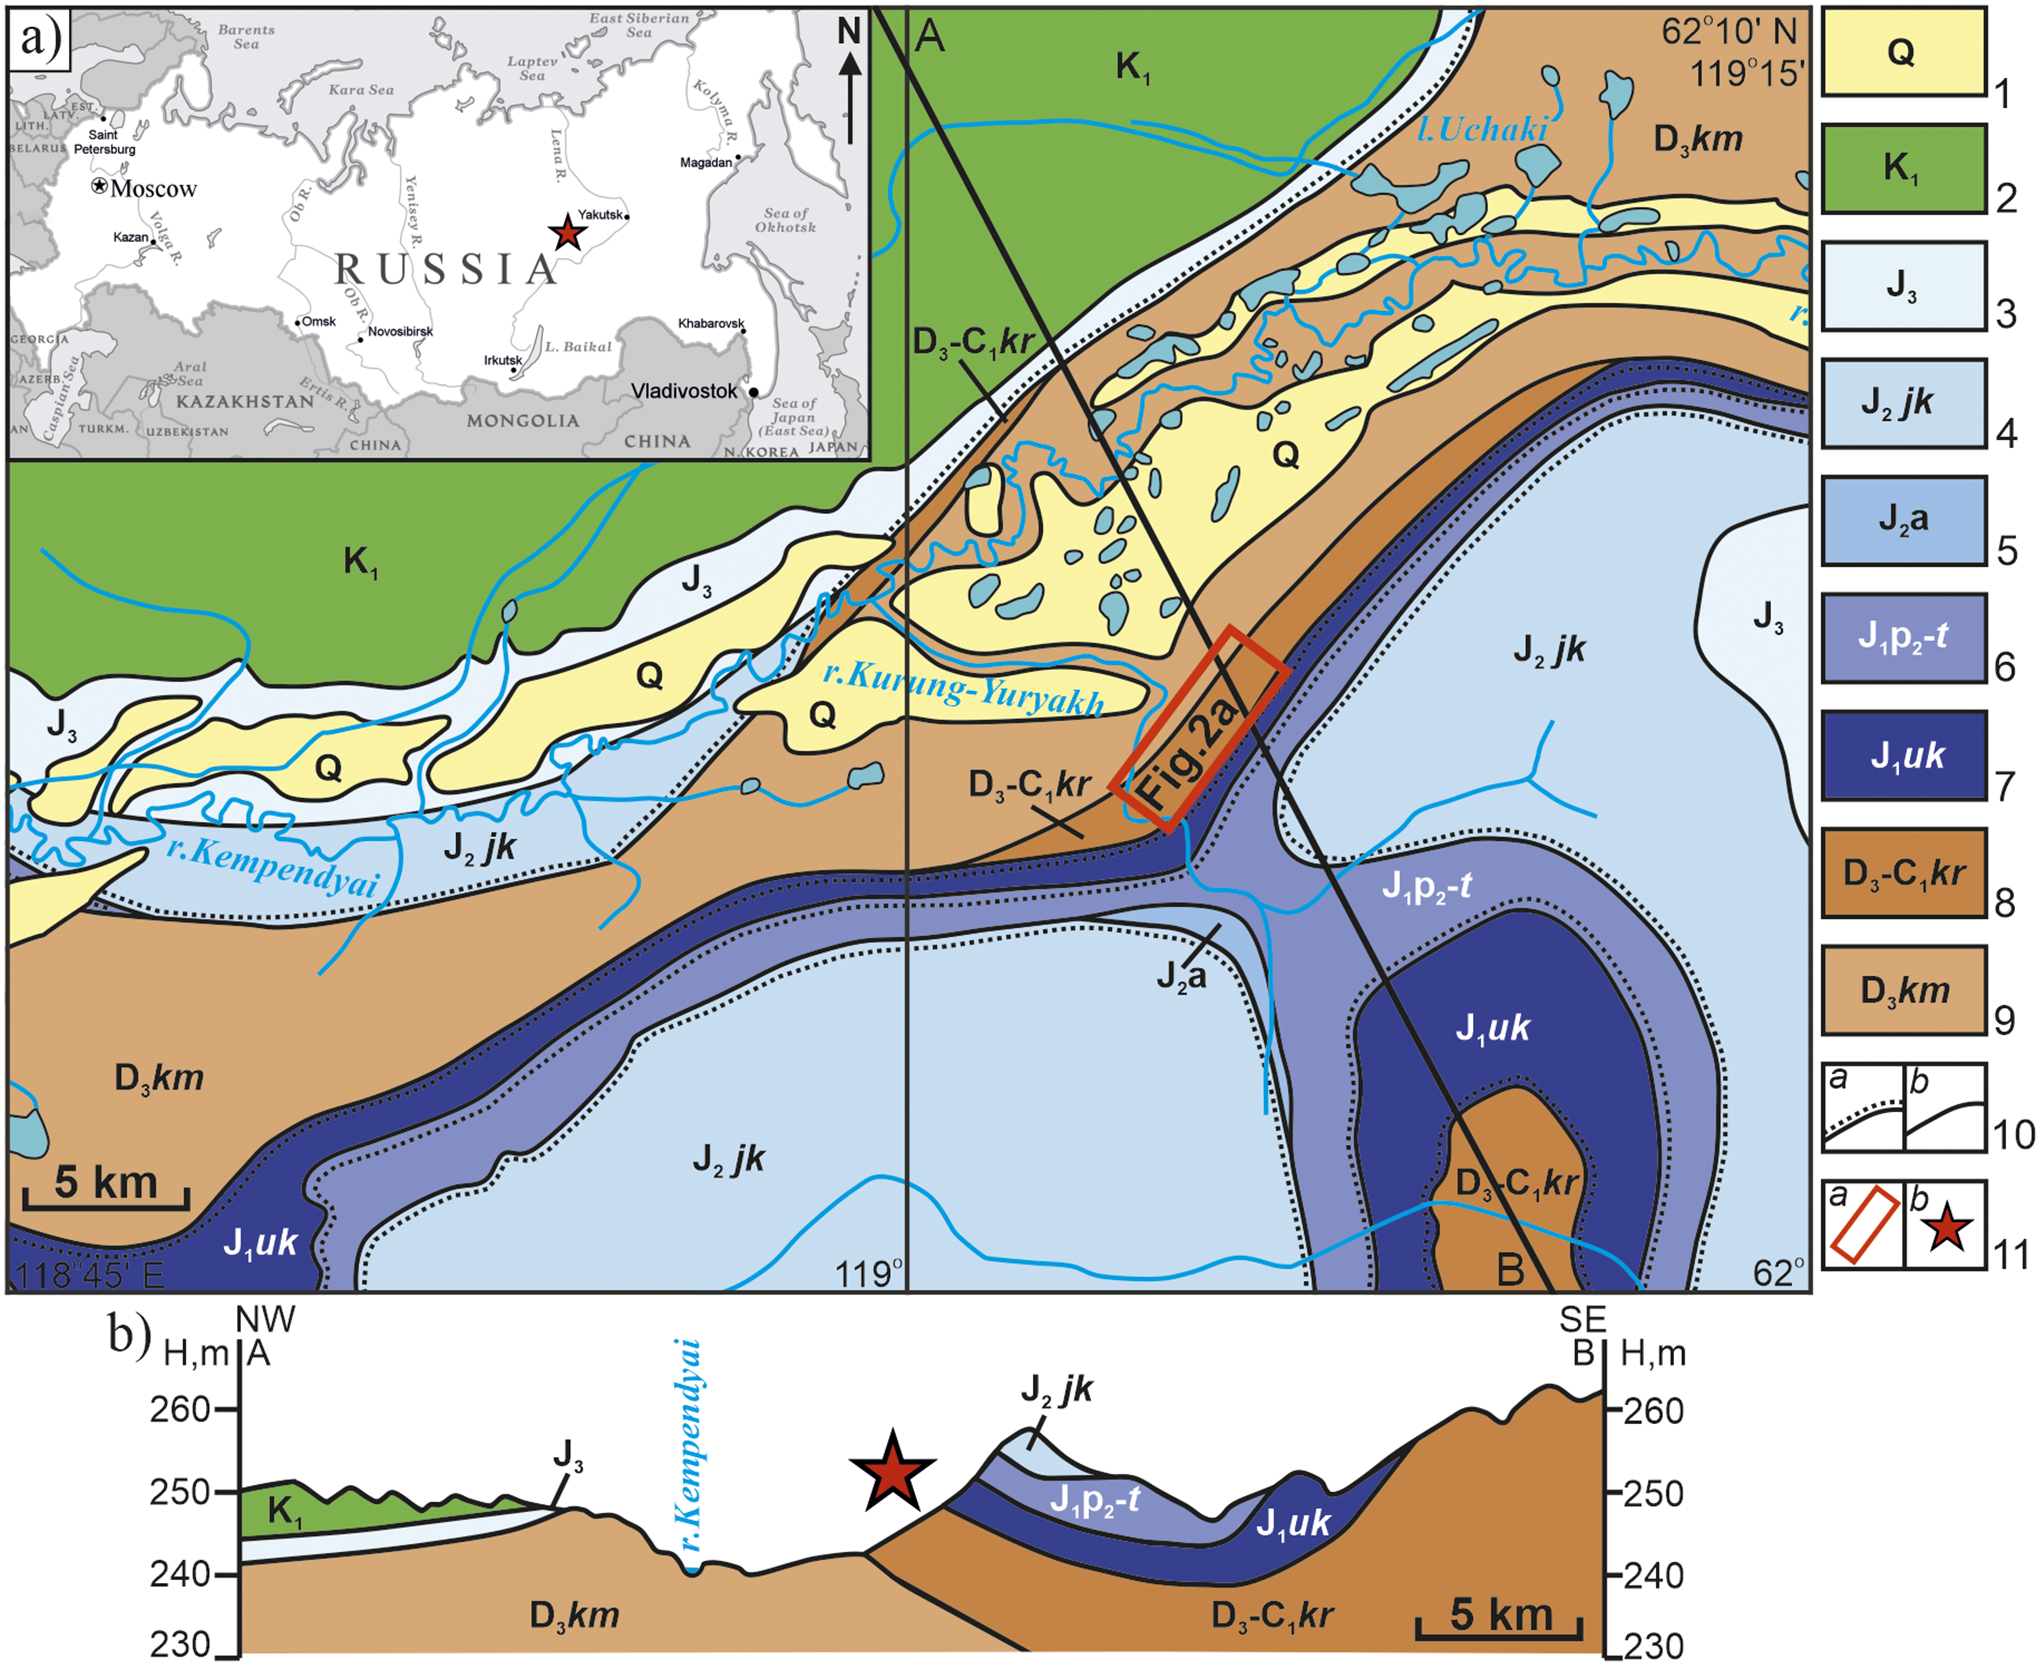
Zeolites in the Republic of Yakutia are confined to the Kempendyai depression, which contains several horizons of Upper Devonian–Lower Carboniferous zeolites of industrial interest. The geological structure of the territory includes Devonian volcanogenic-sedimentary rocks of the Kempendyai suite (D3km) and Upper Devonian–Lower Carboniferous terrigenous rocks of the Kurunguryakh suite (D3-C1kr), to which zeolite layers are confined (Fig. 1), as well as the overlying Triassic, Jurassic, and Cretaceous rocks, represented mainly by sedimentary and terrigenous material – sands, siltstones, marls, limestones, pebbles, argillites, clays, coals, and conglomerates.
Geological map (a) of the area of the Khonguruu zeolite deposit and along a cross-section; and (b) following the A–B line (Republic of Sakha (Yakutia) modified after Nakhabtsev et al., Reference Nakhabtsev, Korchagin and Shcherbakov1967; Nakhabtsev et al., Reference Nakhabtsev, Korchagin and Shcherbakov1975; Petrova et al., Reference Petrova, Starygina and Nikolaev1993). Key: 1 = undifferentiated Quaternary rocks; 2 = Cretaceous terrigenous rocks, sands with interlayers of sandstones, siltstones, gravels, marls, limestones, and mudstones; Jurassic terrigenous rocks (3–7): 3 = sands, clays, siltstones, mudstones, coals; 4 = sands, sandstones, siltstones, mudstones, and gravelites of the Yakut suite; 5 = sands with interlayers of sandstones of the Aalen stage; 6 = mudstones, siltstones, sands, sandstones, limestones of the Upper Pliensbachian substage–Toarcian stage; 7 = sands with interlayers of sandstones, pebbles, gravelites, siltstones, argillites, conglomerates of the Ukugut suite; 8 = Upper Devonian–Lower Carboniferous volcanogenic-sedimentary and terrigenous rocks of the Kurunguryakh suite; 9 = Devonian volcanogenic-sedimentary rocks of the Kempendyay suite; 10 = deposition boundaries: a, unconformable; b, normal; 11 = zeolites: a, deposits; b, occurrences.

The Kempendyai suite (D3km) forms the cores of a number of salt structures and is exposed in the terraces of the Kempendyai river and along the shores of karst lakes. The rocks are composed of fragments of mottled, mainly red-toned sandstones, siltstones, mudstones, limestones, dolomites, and tuffaceous rocks. Gypsum often occurs as fragments, crystals, and drusy forms. These rocks are overlain by siltstones and mudstones with sandstone interlayers, marls, clays, and limestones.
The Kurunguryakh suite (D3-C1kr) forms the wings of a number of salt uplifts and is confined to the Kempendyai river valley. From bottom to top, the section consists of interbedded limestones, sandstones, argillites, marls, sandy and silty tuffs and tuffites, zeolites, zeolitized tuffs, interbedded dolomites, and clayey limestones. The thickness of the suite in the Khonguruu section is 300–350 m in places, being 100 m on average.
The study area is characterized by a rather diverse complex of raw materials, including brown coal, gold, halite, various building materials and sources of salt brines. In addition to the most studied Khonguruu deposit, within this province there are as-yet unexplored zeolite occurrences at Soros, Ulakhan-Uottaah, Chuchuba, Muosaany, and Kyrto-Stag.
Geological structure of the Khonguruu deposit
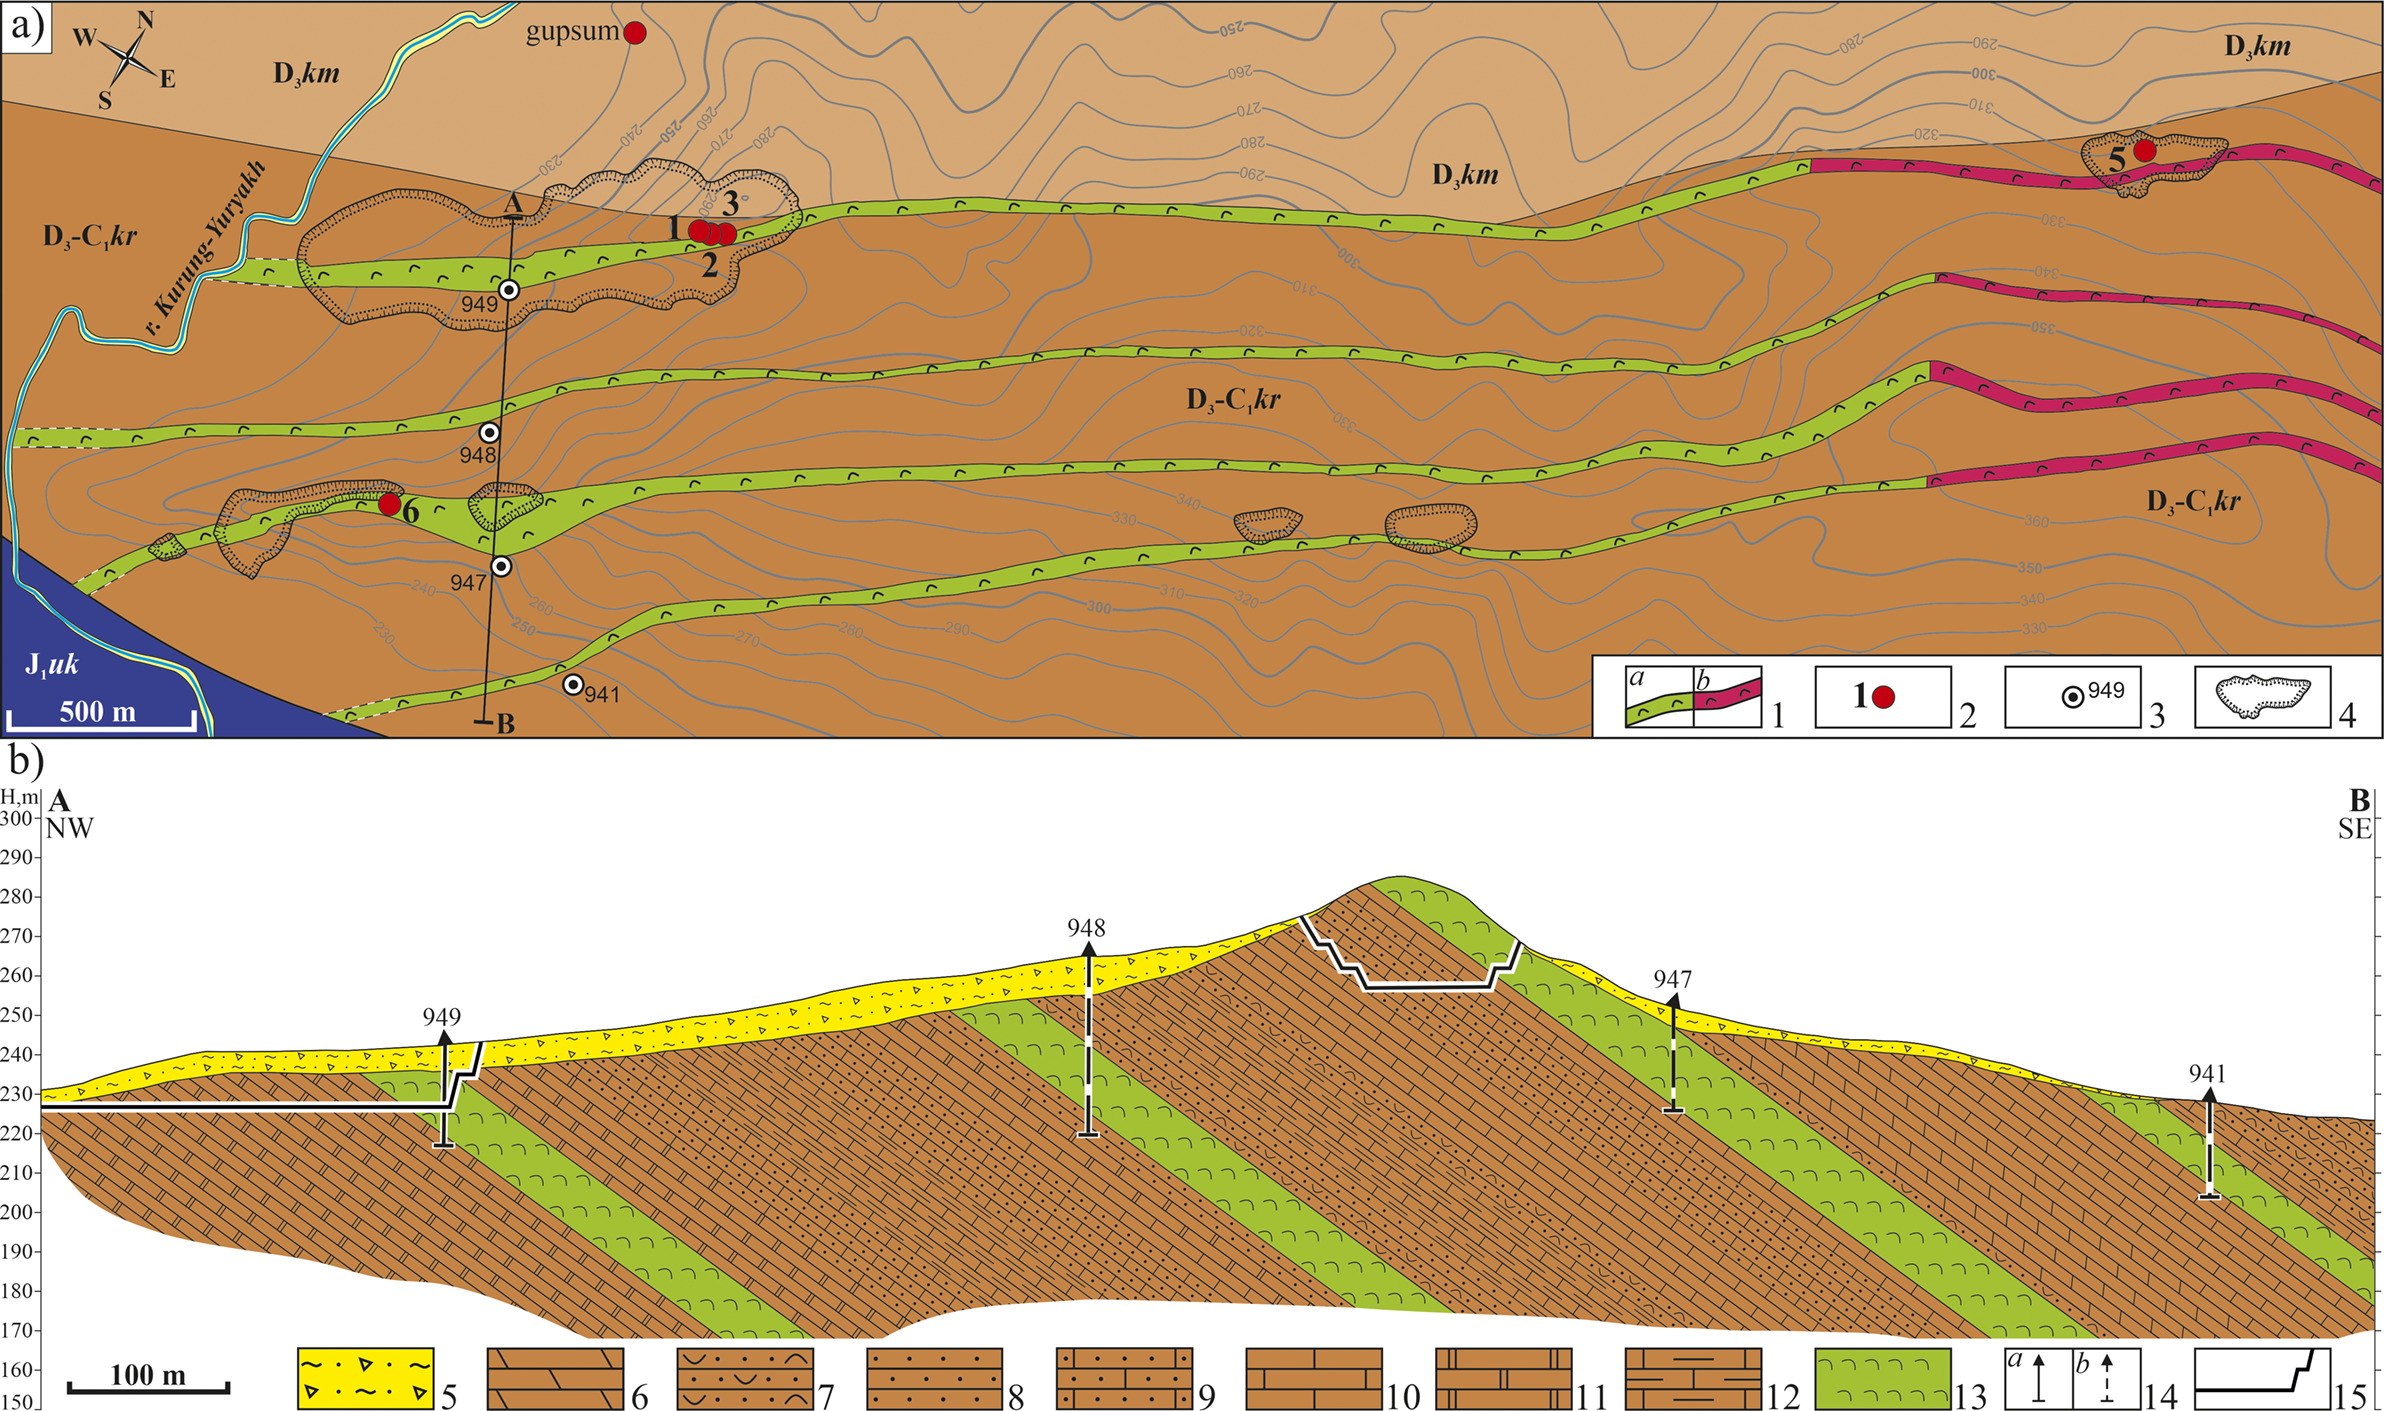
The Khonguruu deposit is located 22 km from the village of Kempendyai in the Suntarsky District of the Republic of Yakutia (Fig. 1). Structurally, the deposit is confined to the western part of the Vilyui syneclise (sedimentary basin) and is located within the Kempendyai depression. In total, the deposit contains four zeolite layers, with a north-eastern strike and monoclinal plunge at an angle of 25–45°C (Fig. 2). The layers are 5.6–11 m thick and they lie in conformity with the enclosing sedimentary and volcanic rocks (Kolodeznikov and Ivensen, Reference Kolodeznikov and Ivensen1979; Kolodeznikov et al., Reference Kolodeznikov, Novgorodov, Matrosova and Stepanov1992). The layers have been traced over a distance of 6–8 km and their structure has been studied to a depth of 100–160 m. Reserves of category A+B+C1 amount to 11.3 million tons. The deposit is being exploited, with annual production at ~30–50 thousand tons (State Reserves Committee of the Russian Federation: Zeolites, 2019).
Geological map of the Khonguruu deposit (a) and geological section along line A–B (b) according to Petrova et al. (Reference Petrova, Starygina and Nikolaev1993) with changes and additions. Key: 1 = types of zeolite (a, alkaline; b, alkaline-earth); 2 = sampling points and their numbers; 3 = boreholes and their numbers; 4 = quarries for zeolite extraction; 5 = N-Q sandy-clayey rocks; 6–13 = Upper Devonian–Lower Carboniferous volcanogenic-sedimentary and terrigenous rocks of the Kurunguryakh suite, see text for a detailed description; 13 = layers of zeolite; 14 = boreholes (a, on the section line; b, projected onto the section line); 15 = quarry outline.

The structure of the productive strata
Layer I is exposed at the top of the northern offset of the Khonguruu Range and is traced for 8 km. Within the exploration area, the layer is 2.21 km long, the thickness varies from 7.5 to 14.0 m and averages 10.9 m. The layer has been studied to a depth of 100 m down-dip. The zeolite content varies from 55 to 85% and averages 75%. The zeolites lie on red-colored clayey dolomites and are overlain by tuffaceous sandstones overlain by calcareous mottled sandstones. The angle of dip of the layer varies from 20° to 38°, averaging 33°.
Layer II is exposed in the middle part of the northern slope of the main highest spur of the Khonguruu Range. It has been traced for a distance of 6.5 km, the thickness varying from 2.6 to 11.3 m (average 7.2 m). The layer has been studied to a depth of 120 m. The zeolite content is 70–94 wt.% (80 wt.% on average). The layer lies on yellow-gray sandstones and is overlain by mottled tuffaceous siltstones with interbeds of tuffaceous sandstones. It is separated from the first layer by a 106 m thick layer of terrigenous rocks dipping with an angle of 25–40° (average 33°).
Layer III is exposed on the main crest of the Khonguruu ridge. It is traced by trenches and boreholes along the strike for 7 km and along the dip to 160 m. The layer is represented by zeolites and very thick layers of tuff sandstones (up to 1 m), grading into sandstones. The total thickness varies from 6.3 to 18.8 m (average 10.5 m) and the zeolite content is 74–92 wt.% (average 83 wt.%). The layer lies on gray limestones, overlain by weakly calcareous sandstones and limestones. It is separated from layer II by Devonian–Carboniferous terrigenous-carbonate rocks ~70 m thick. The dipping angle of the layer is 25–45° (average 35°).
Layer IV is exposed by trenches on the top of a small hill located south of the main ridge, traced for 6 km and studied to a depth of 150 m along the dip. The layer thickness is 4.1–6.7 m (average 5.3 m). The zeolite content in the layer is 75–99 wt.% (average 87 wt.%). The zeolites lie on gray dense limestones and are covered by black marls. This layer is separated from the third layer by a pile of carbonate rocks 50–55 m thick. The contact with the host rocks is sharp. The layer lies at an angle of 26–45°, averaging 36°.
Materials and methods
The material for the study was collected by the IGEM RAS team at the Khonguruu deposit during field work in 2023. Samples were collected both along the dip and strike of the layers at the active quarry (selection point No. 1–3), as well as in other parts of the deposit, where zeolite layers were exposed by an excavator. Sample No. 6 was collected from an outcrop exposed to the surface. The letter index in the name of the samples corresponds to the color of the zeolites: G = green, B = beige.
The mineralogical composition of bulk samples and clay fractions was determined at IGEM RAS by X-ray diffraction (XRD). The XRD patterns were obtained with an Ultima-IV X-ray diffractometer (Rigaku, Tokyo, Japan), using CuKα radiation, semiconductor 1D detector D/Tex-Ultra, scanning range 3–65°2θ, scanning speed 3°2θ min–1 and step 0.02°2θ. The mineralogical composition was determined according to Moore and Reynolds’ (Reference Moore and Reynolds1999) recommendations, and the quantitative composition was estimated by the Rietveld method (Post and Bish, Reference Post and Bish1989) using the BGMN code (Profex software, version 3.14.3; Doebelin and Kleeberg, Reference Doebelin and Kleeberg2015). Additionally, diagnostics of swelling clay minerals were carried out in oriented preparations in air-dry and ethylene glycol-saturated state.
The chemical composition of the zeolites was determined with X-ray fluorescence spectrometry (XRF) using an Axios mAX XRF spectrometer (PANalytical, Almelo, The Netherlands) on glass beads prepared by fusion with lithium tetraborate at 1200°C on samples previously dried at 110°C. The iron content was determined as total Fe2O3.
The microstructure of the samples was studied with scanning electron microscopy (SEM) using a LEO1450VP SEM (Carl Zeiss, Oberkochen, Germany). Samples for SEM were prepared in the form of individual particles and aggregates. The samples in powder form were deposited on a double-sided electrically conductive adhesive tape. Then the excess sample particles were removed with compressed air. As a result, a monolayer of individual particles and aggregates on an adhesive tape was obtained. The studied surface was coated with a 5–10 nm thick gold film, under vacuum. Chemical analysis was performed using an EDS Ultim Max backscatter electron detector (Oxford Instruments, Oxford, UK) and processed using Aztec version 5.1 software (Oxford Instruments). For quantitative analysis, calibration was performed using a Co standard.
Thermal analysis was performed on a TGA/DSC 3+ synchronous thermal analyzer (Mettler Toledo, Greifensee, Switzerland) equipped with an o-DTA (differential thermal analysis) sensor that does not require a reference sample. The instrument was calibrated using the melting temperature and enthalpy of certified materials: indium, zinc, aluminum, and gold. The measurements were performed in a synthetic air atmosphere (80% N2, 20% O2) in the temperature range 40–1000°C with a gas-flow rate of 100 mL min–1 and heating rate of 10°C min–1, using Al2O3 crucibles with a volume of 70 μL. At a temperature of 110°C, a long exposure was carried out.
The IR spectra were obtained using a Perkin Elmer Spectrum One Fourier transform infrared spectroscopy (FTIR) spectrometer equipped with an Indium Gallium Arsenide (InGaAs) detector and a KBr beam splitter. For each sample, 100 scans were recorded in the MIR region (4000 to 400 cm–1) with a resolution of 4 cm–1. To obtain a KBr pellet, 1 mg of sample was dispersed in 400 mg of KBr and the resulting mixture was placed in a 20 mm pellet die and pressed for 20–25 min. The pellet was placed in a glass desiccant box with CaCl2 and heated in a furnace at 150°C for at least 20 h. Spectra processing was performed using the OPUS 7.0 software package (Bruker Ltd). Baseline correction was made in Interactive mode using the Straight-line method with one iteration.
Evaluation of the specific surface area was carried out using a Quadrasorb SI/Kr analyzer (Quantachrome Instruments, Boynton Beach, FL, USA). Gas adsorption was performed at liquid nitrogen temperature (77.35K). Nitrogen with a purity of 99.999% served as an adsorbate. Helium grade 6.0 (99.9999%) was used for the volume calibration of the measuring cells. The calculation was carried out by the Brunauer–Emmett–Teller (BET) multiple-point isotherm in the P/P 0 range 0.05–0.30. Before measuring the surface characteristics of the samples, they were vacuum-pumped using the Flo-Vac Degasser installation, which is an integral part of the Quadrasorb SI/Kr analyzer. This installation allows pumping of gases and water from the pore space in the temperature range 15–400°C and enables control of pressure in the system (with the sample) in the range of 101.3–0.133 Pa. In this work, pumping of the samples was carried out at 100°С (temperature of dehydration) to a residual constant pressure in the system of 0.133 Pa. Use of a higher temperature can damage the structure of the aluminosilicates and therefore change the state of the pore space. The pumping time at this temperature was 4 h.
The cation exchange capacity (CEC) was determined by the method of multiple replacement of exchange cations with ammonium chloride. The composition of exchange cations in the solution was determined by the ICP-MS method (Tucker, Reference Tucker1974).
During the sorption of 137Cs, sodium nitrate solutions with concentrations of 0.1 mol dm–3 at pH 6.0 were used as the liquid phase. Before the onset of the experiments, the solutions were labeled with the 137Cs radionuclide (~105 Bq dm–3). The sorption parameters of the sorbents were measured under static conditions by stirring continuously 0.1±0.0001 g of the air-dried sorbent, with 20 cm3 of the solution for 48 h. The mixture was then filtered through a white ribbon paper filter and the specific activity of the corresponding radionuclide was determined in the filtrate. The distribution coefficients (K d) of the radionuclides were calculated using the formula:
 $$ {K}_{\mathrm{d}}=\frac{A_{\mathrm{o}}-{A}_{\mathrm{p}}}{A_{\mathrm{p}}}\times \frac{V_{\mathrm{p}}}{m_{\mathrm{c}}} $$
where A o and A p are the specific activity of the radionuclide in the initial solution and in the filtrate, respectively, in Bq dm–3; V p is the volume of the liquid phase, in cm3; and m c is the sorbent weight.
The experiments were run in duplicate. The specific activity of 137Cs in solutions was determined by the direct radiometric method with the SKS-50M universal spectrometric complex (Green Star Technologies, Moscow) using the gamma and beta spectrometric paths, respectively. The heulandite type was determined according to the method described by Alietti (Reference Alietti1972) and Gottardi and Galli (Reference Gottardi and Galli1985), by heating natural samples to 450°C, 550°C, and 650°C followed by XRD analysis.
Leaching of amorphous silica was carried out in fluoroplastic beakers in a 1 M NaOH solution for an hour in a water bath, at a solid:liquid ratio of 1:100. The beakers with the samples were then cooled in cold water and centrifuged at 2500 rpm for 7 min. The content of SiO2 in the aqueous phase after treatment was determined spectrophotometrically with the molybdate method (Eiler, Reference Eiler1982). A full description of the technique is given by Malyavsky and Pokidko (Reference Malyavsky and Pokidko2011).
The SiO2 content in the solution was estimated by the optical density after mixing with Euler’s reagent ([MoO42–] = 0.0707 M; [NH4+] = 0.148 M; [SO42–] = 0.375 M; pH 1.2). For this purpose, a selected aliquot of the solution after sample processing was diluted 25 times with 0.1 N HCl, after which 5 mL of the resulting solution was depolymerized by single boiling with excess KOH and mixed with 25 mL of Euler’s reagent. The silicon dioxide content was determined using a calibration graph obtained using a standard silicon solution (1000 μg mL–1, ICP standard). Optical density was determined at the absorption maximum of the yellow molybdate complex at a wavelength of 400 nm, using an Expert 001 photometer (Econix).
Results and Discussion
Textural and structural features of zeolites
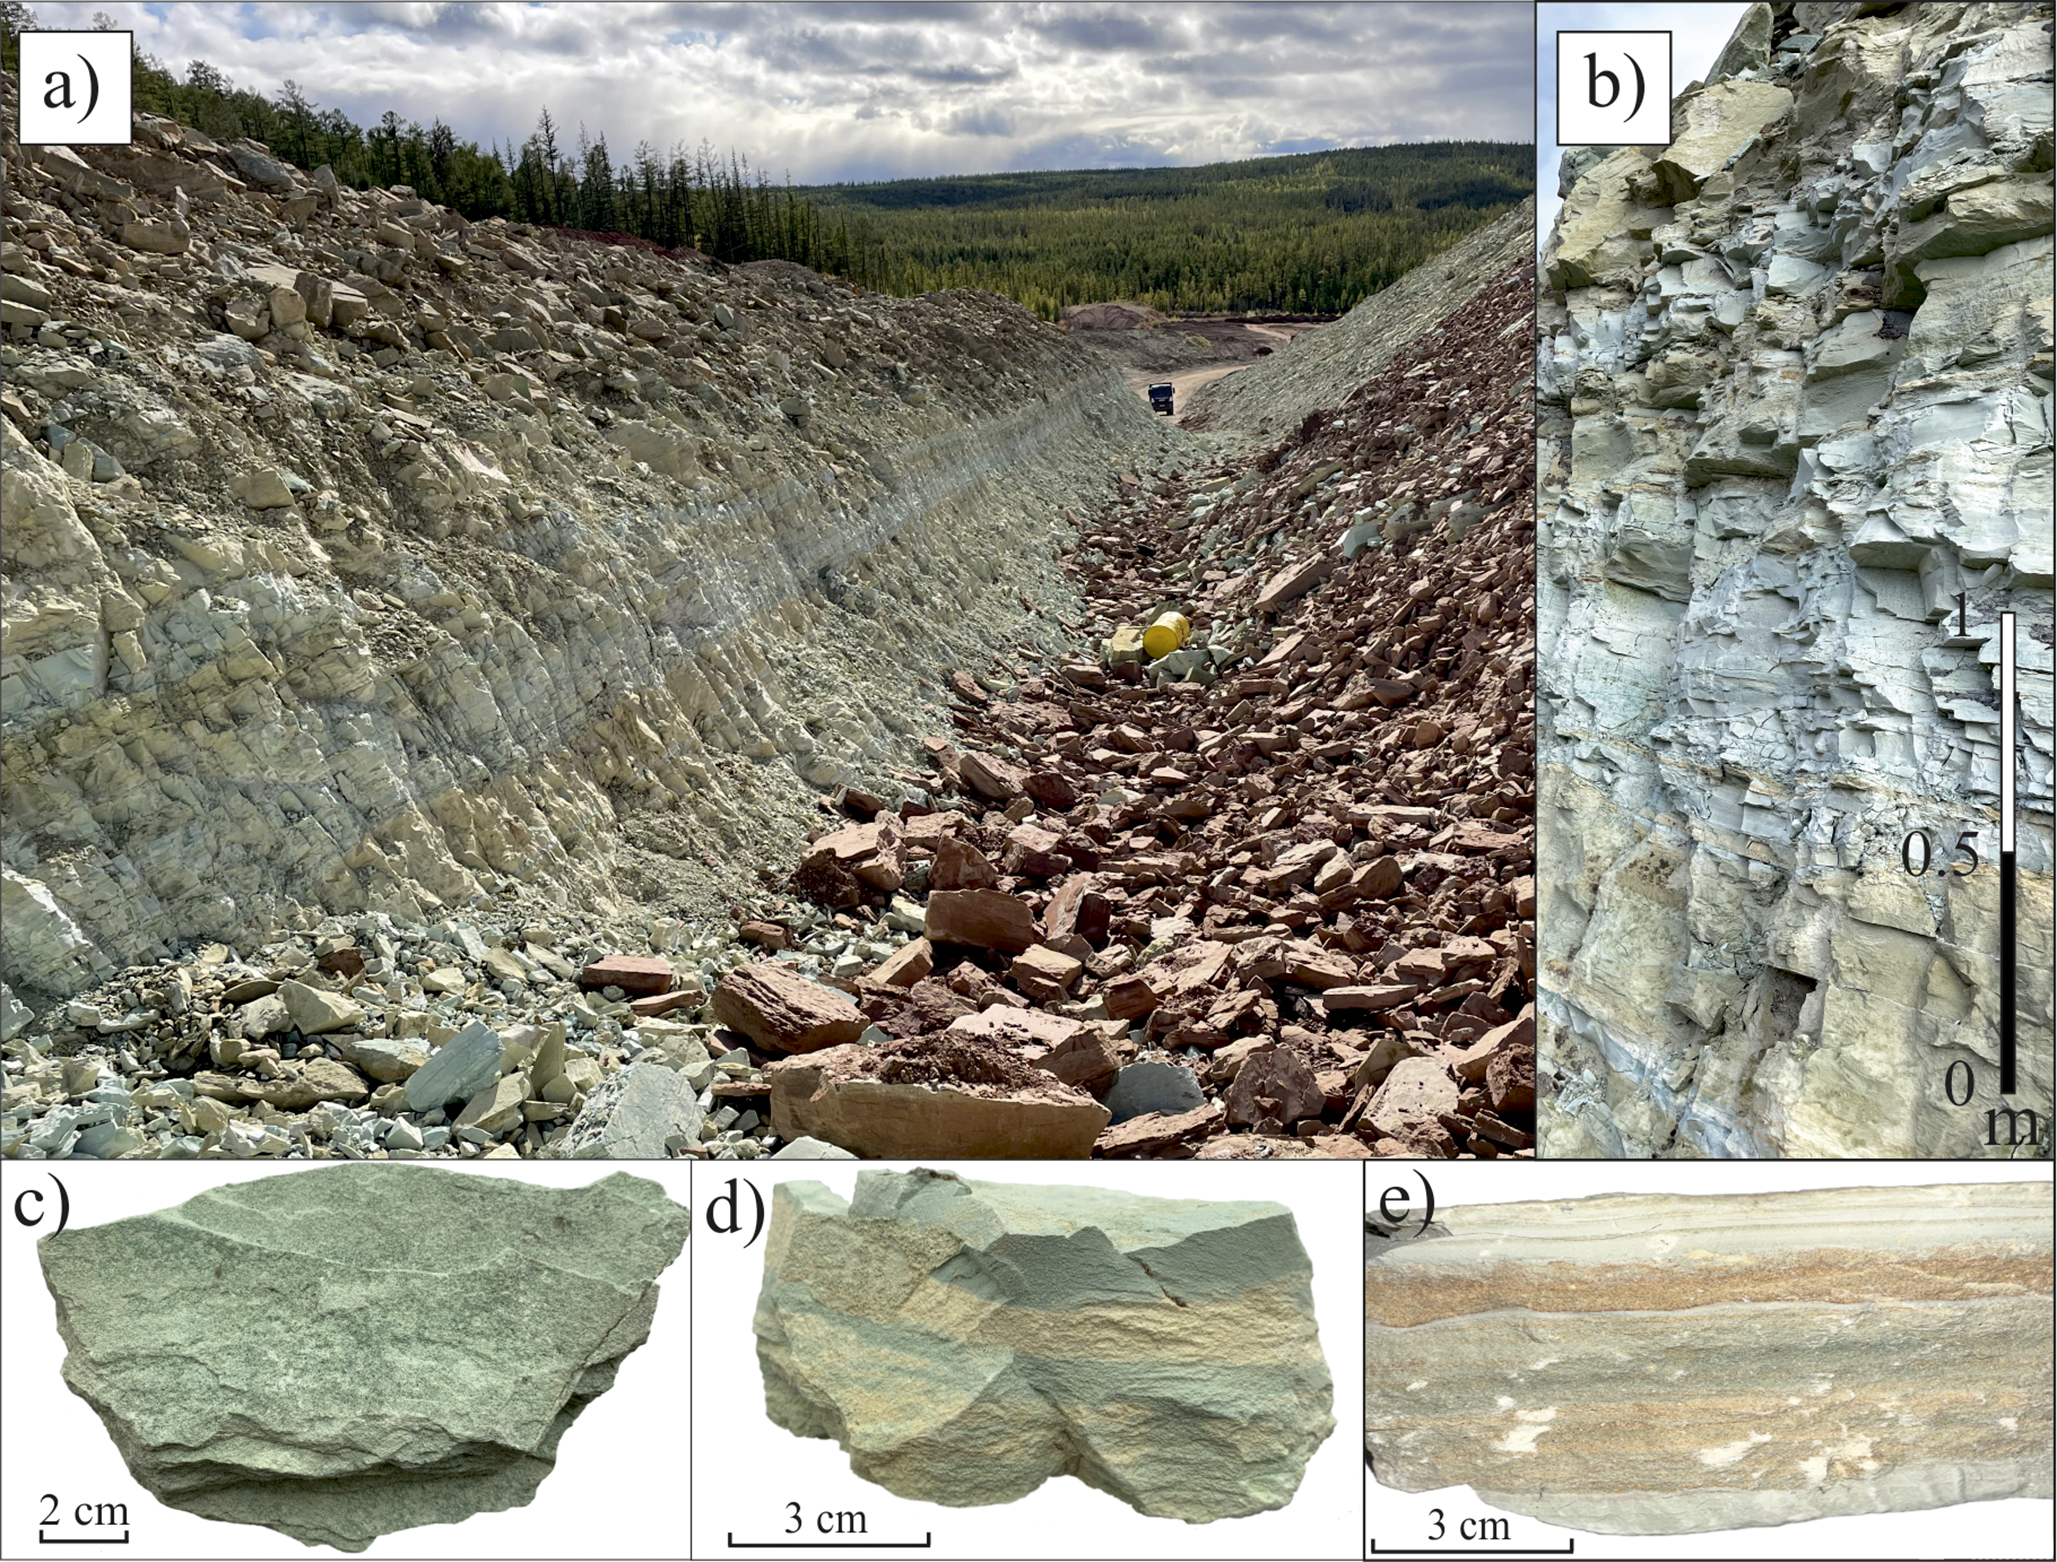
Macroscopically, zeolite samples are platy with gray-green and beige color. The textures of the rocks are uniform, massive, thin- and thick-platy (Fig. 3). There is interbedding of beige and green zeolites, as well as zeolite layers with enclosing tuffaceous siltstone (Fig. 3).
Overview of the Khonguruu deposit and photos of the samples: a = zeolite mine; b = vertical exposure of zeolite layer; с = sample of fine-grained, thin-plate zeolite of greenish color; d = interlayering of greenish and beige zeolites; е = enclosing tuffaceous siltstone.

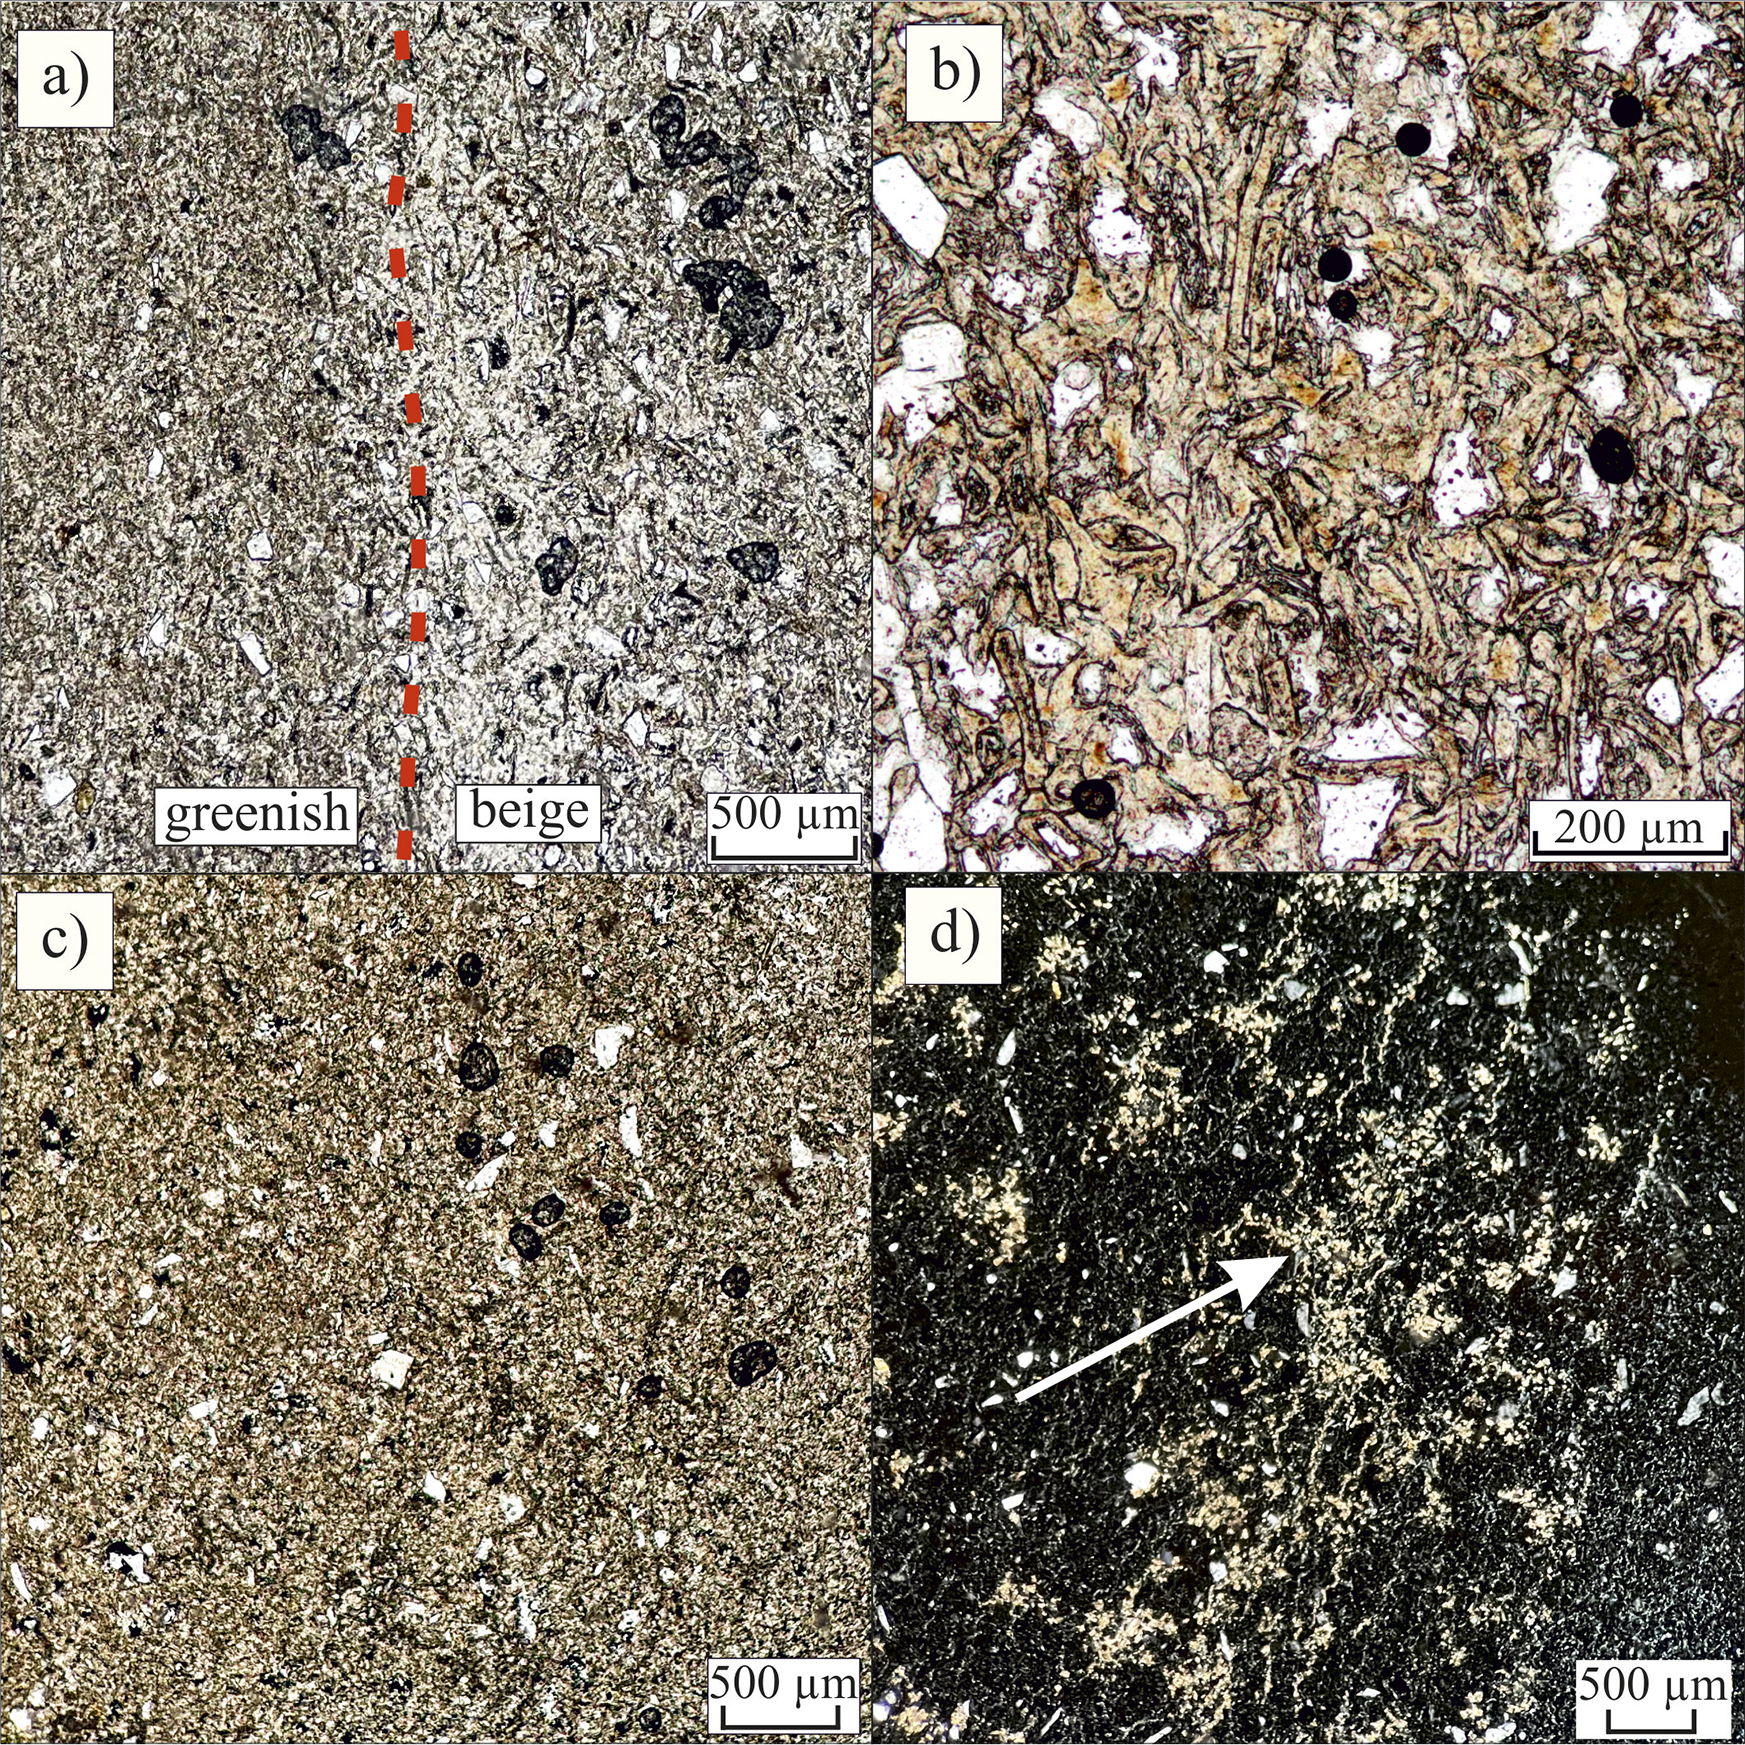
Microscopically, the rocks are vitroclastic and crystal-vitroclastic tuffs, almost completely replaced by zeolites. In samples of zeolitized tuffaceous siltstone, vitroclastic structures with relics of volcanic glass predominate (Fig. 4b). The vitroclastic tuff has been replaced by cryptocrystalline heulandite and clinoptilolite (Fig. 4c). Smectite develops along pores and cracks of zeolitized tuff (Fig. 4d).
Photomicrographs of zeolite samples under the polarized microscope: a = boundary between the green zeolite variety with a homogeneous, dense structure and the beige variety with a porous, tuffaceous structure; b = vitroclastic structure of a sample of zeolitized tuffaceous siltstone with relics of volcanic glass; c = vitroclastic tuff replaced by cryptocrystalline clinoptilolite; d = development of smectite (arrow) along pores and cracks of zeolitized tuff (crossed nicols).

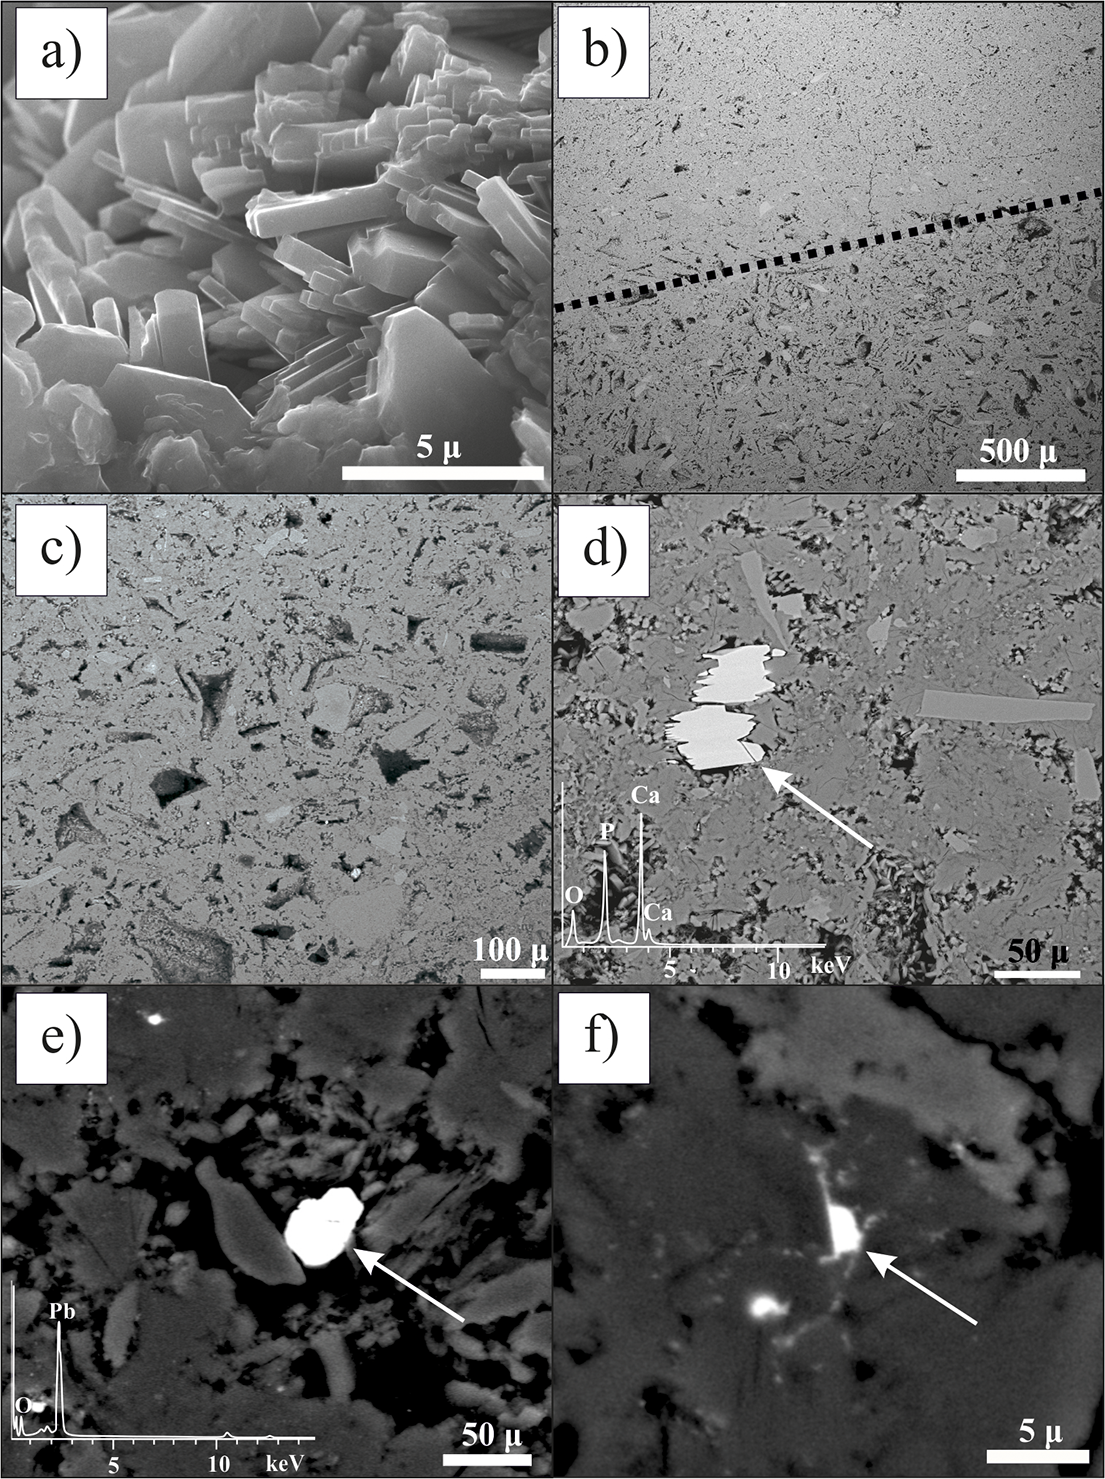
The microstructures of green and beige zeolites differ. Green varieties are mainly represented by a homogeneous dense cryptocrystalline mass. The beige variety is characterized by a porous, tuffaceous structure. Figures 4a and 5b show the boundary between beige and green zeolites.
SEM images of zeolite samples; a = well-crystallized zeolite aggregates in the pore space; b = boundary between the green zeolite variety with a homogeneous, dense structure and the beige variety with a porous structure; c = vitroclastic structure of zeolitized tuffaceous siltstone; d = apatite grain shown by the arrow; e = grain of lead oxide shown by the arrow; f = rare earth phosphates (monazite) shown by the arrow.

Scanning electron microscopy
The studies show well-crystallized zeolite aggregates in the pores and voids of the rock (Fig. 5a). The zeolites have a tabular and prismatic shape, with crystal sizes up to 10–20 μm. Characteristic transitions between beige and green verities are observed, with the beige one having a porous structure (Fig. 5b). Single grains of magnetite, zircon, apatite, rare earth phosphates (monazite), lead oxide (litharge or massicot), and other ore and non-ore minerals were also observed. Their sources were presumably the original tuffs (Fig. 5d–f; see also Supplementary material Table S1).
Mineralogical composition
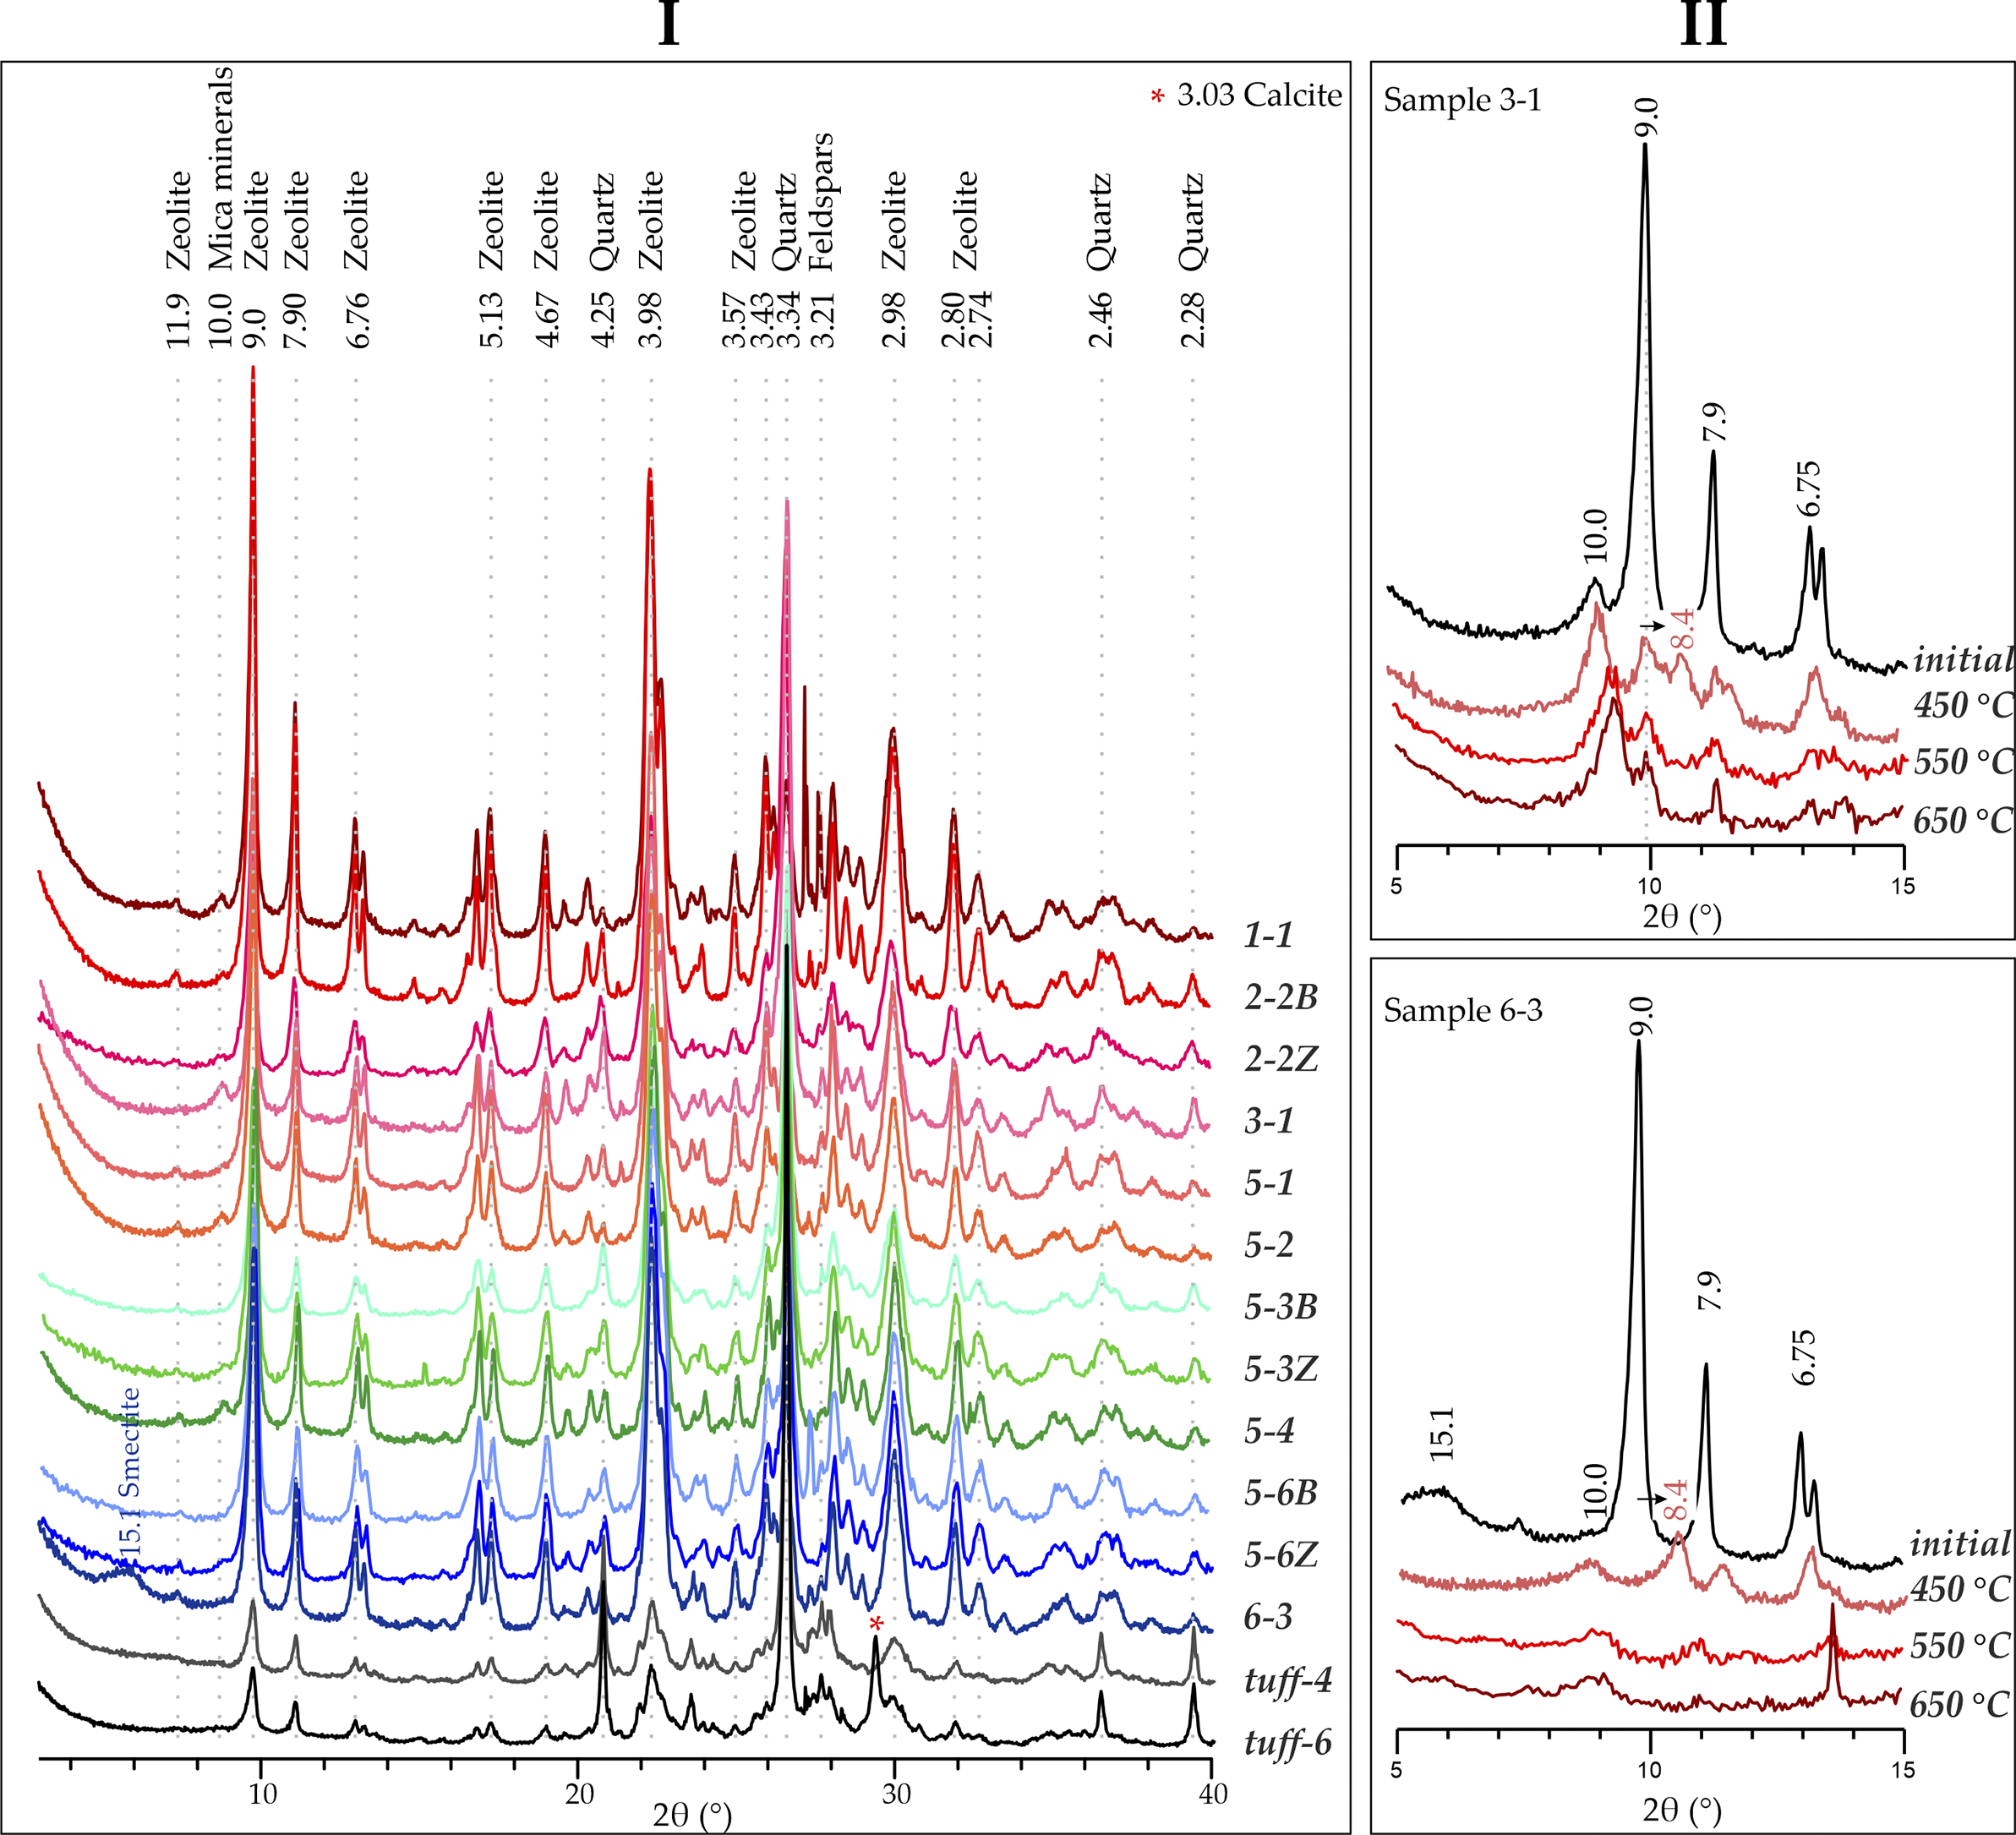
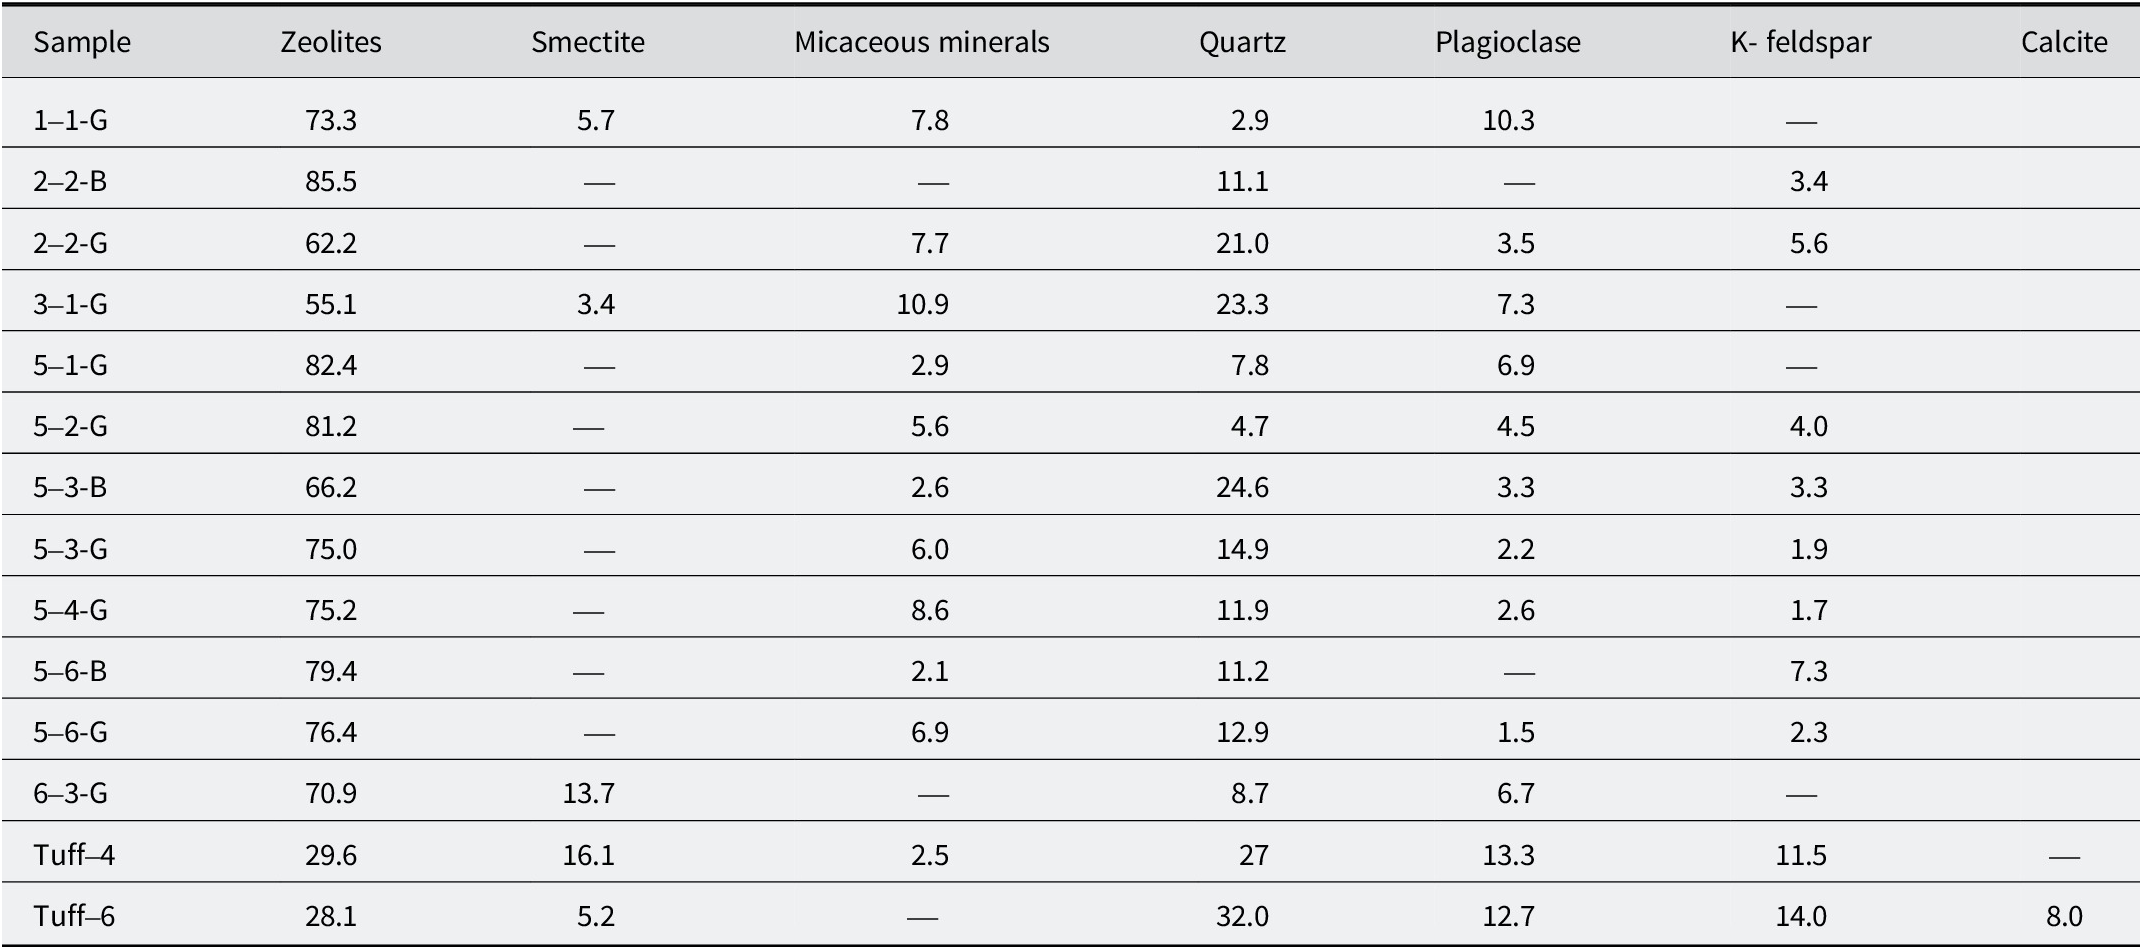
The zeolite content is 55–82% in the rocks, the zeolite belonging to the HEU group with diffraction maxima of 9.0, 7.9, 6.76, 3.98 Å, etc. (Fig. 6a; Table 1). Smectite (main peak 15.1 Å), mica minerals (10.0 Å), quartz (4.25, 3.34, 2.46, 2.28 Å) and feldspars (3.21 Å) are present as impurities.
(I) XRD patterns of the samples from the Khonguruu deposit; (II) subsections of the XRD patterns of the 3-1-G and 6-3-G samples initially and heated to 450°C, 550°C, and 650°C.

Mineralogical compositions of the zeolite samples, determined by the Rietveld approach (wt.%)

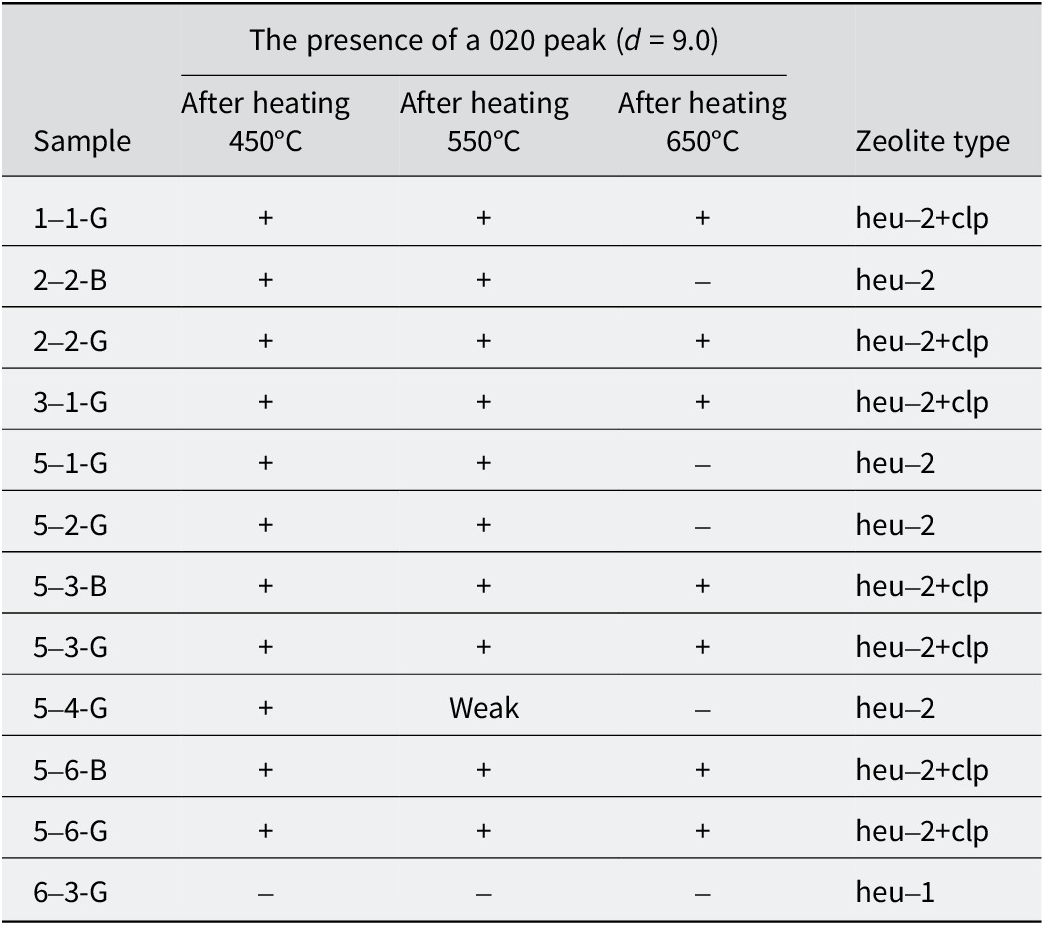
The zeolites themselves are represented by heulandite-1, heulandite-2, and to a lesser extent, clinoptilolite. The separation of the various minerals of the heulandite-clinoptilolite group was carried out according to the approach of Alietti (Reference Alietti1972) and Gottardi and Galli (Reference Gottardi and Galli1985). Most samples are characterized by the presence of a mixture of heulandite-2 and clinoptilolite (Table 2). Heulandite-2 was detected in samples 2-2B, 5-1, 5-2, and 5-4, as it was revealed by a partial shift of the peak, from 9.0 to 8.4 upon heating (Fig. 6), and complete amorphization after heating above 650°C. Heulandite-1 is present only in sample 6-3, whereby after heating at 450°C, the peak at 9.0 Å disappeared completely.
Determination of different types of HEU-group minerals based on thermal analysis and XRD data

The presence of clay minerals, especially smectite, is more characteristic of green iron-enriched samples, where they develop along fractures in the rock (Fig. 4).
Infrared spectroscopy
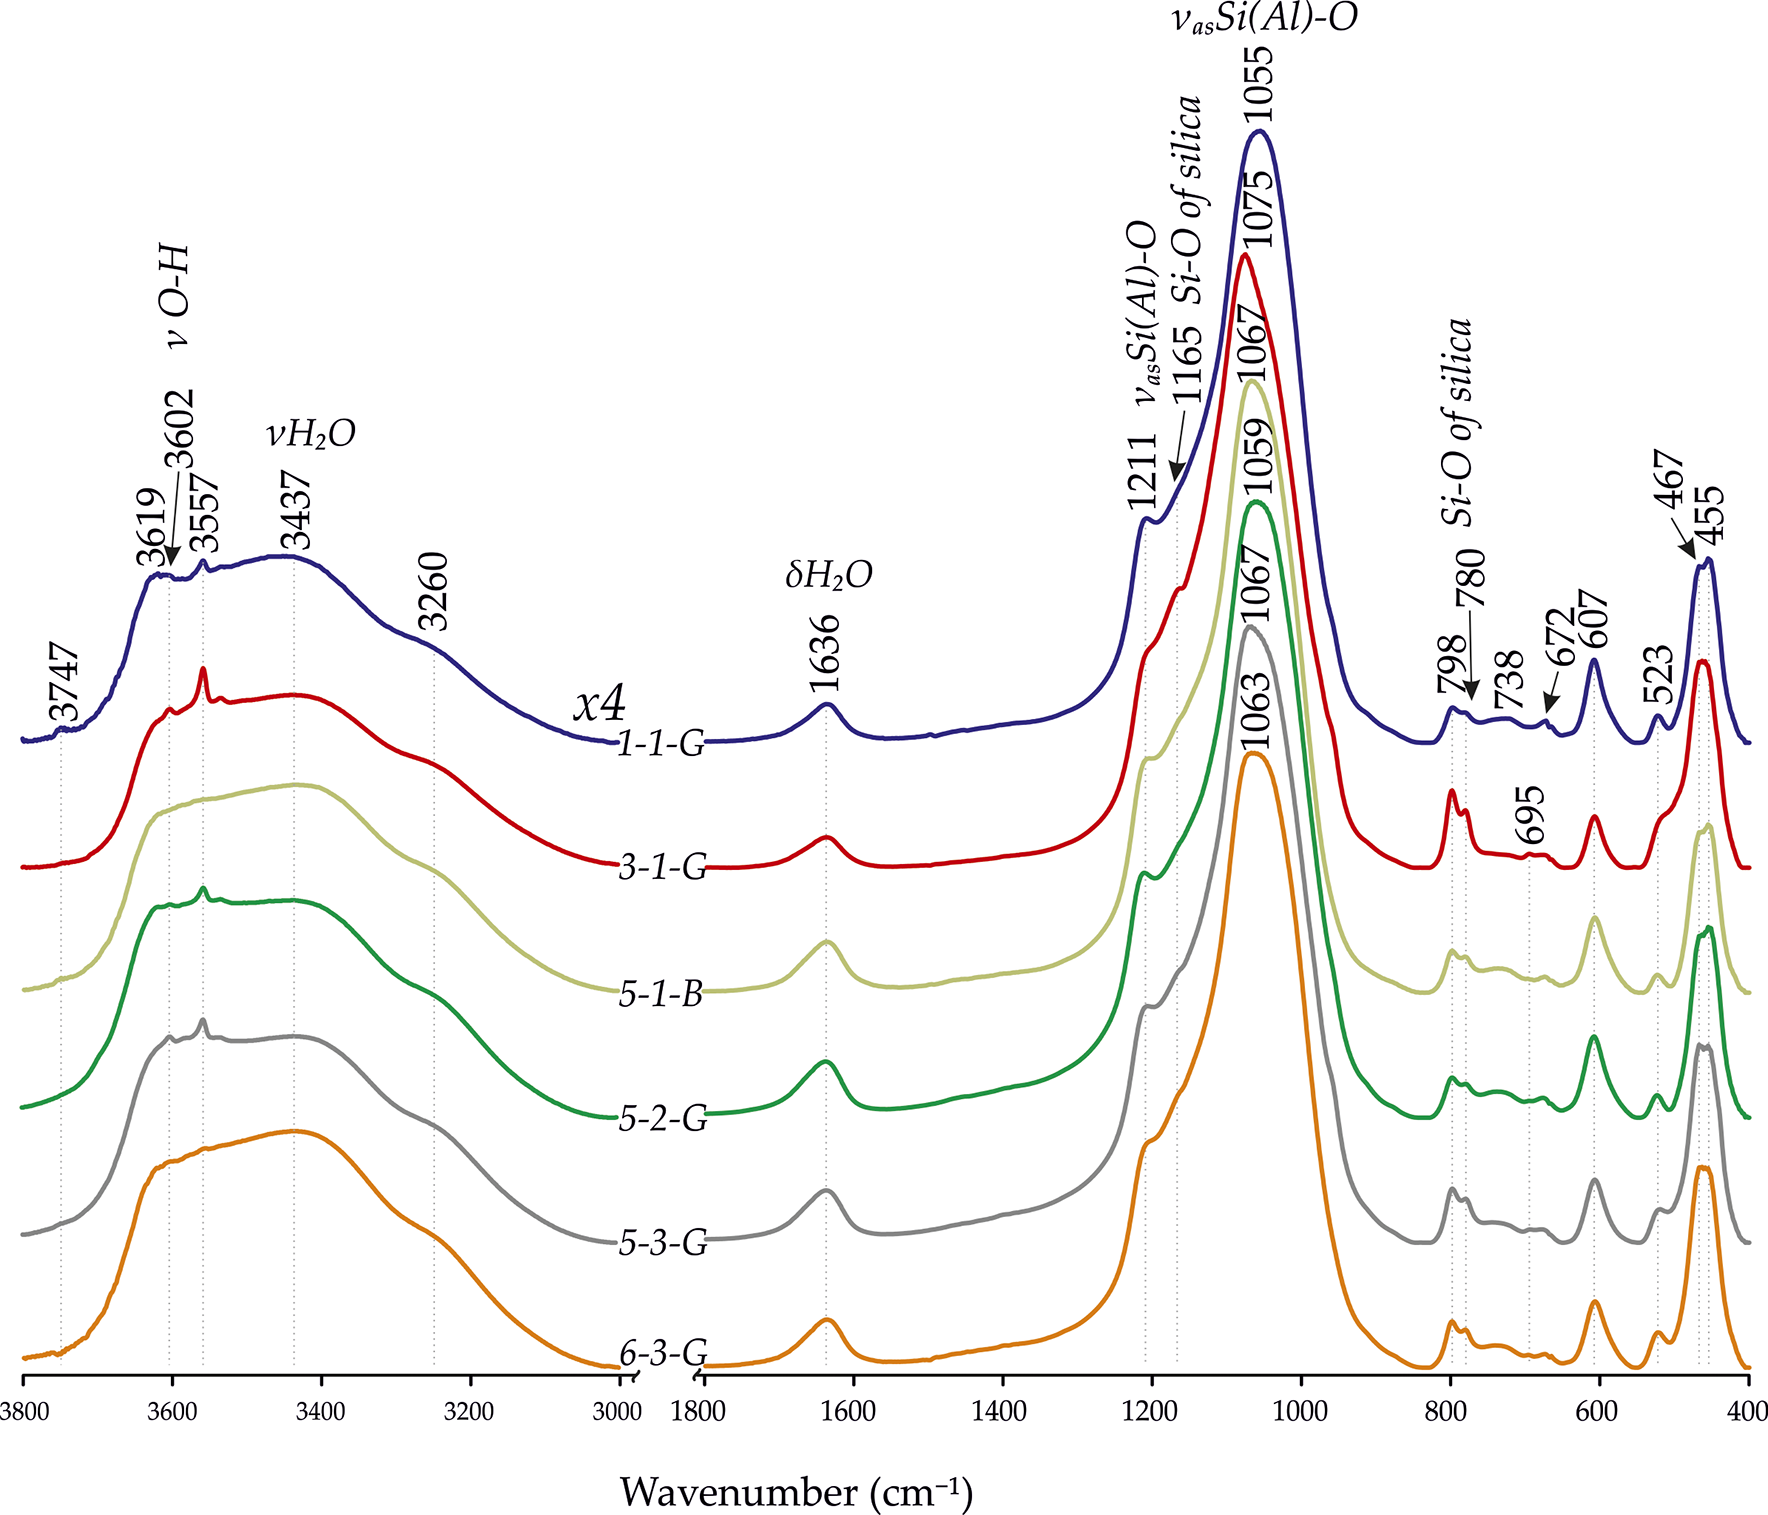
The FTIR spectra are presented in Fig. 7. The bands in the range 1600–3700 cm–1 are related to OH-stretching and bending of zeolitic water. The bands at 1055–1075 cm–1 are attibuted to internal Si(Al)-O stretching vibrations of tetrahedra, the band at 1211 cm–1 is related to internal tetrahedra asymmetric stretching, and those at 607 cm–1 and 455 cm–1 are related to the external tetrahedral double ring and to internal tetrahedral bending, respectively (Rodriguez-Fuentes et al., Reference Rodriguez-Fuentes, Ruiz-Salvador, Mir, Picazo, Quintana and Delgado1998). The maximum of the band of internal vibrations of Si(Al)-O tetrahedra shifts from 1055 to 1075 cm–1, due to increase of the quartz content and the change in the maximum of band overlapping; the greatest shift is observed for sample 3-1 with abundant quartz. The bands at 1165, 798, and 780 cm–1 are also due to Si-O vibrations of quartz and amorphous SiO2 (Madejova and Komadel, Reference Madejova, Komadel and Kloprogge2005). The band at 3557 cm–1 is related to ν FeMgOH vibrations of the ferrous variety of illite (Gates et al., Reference Gates, Kloprogge, Madejova and Bergaya2017).
FTIR spectra of the zeolite samples.

Thermal analysis
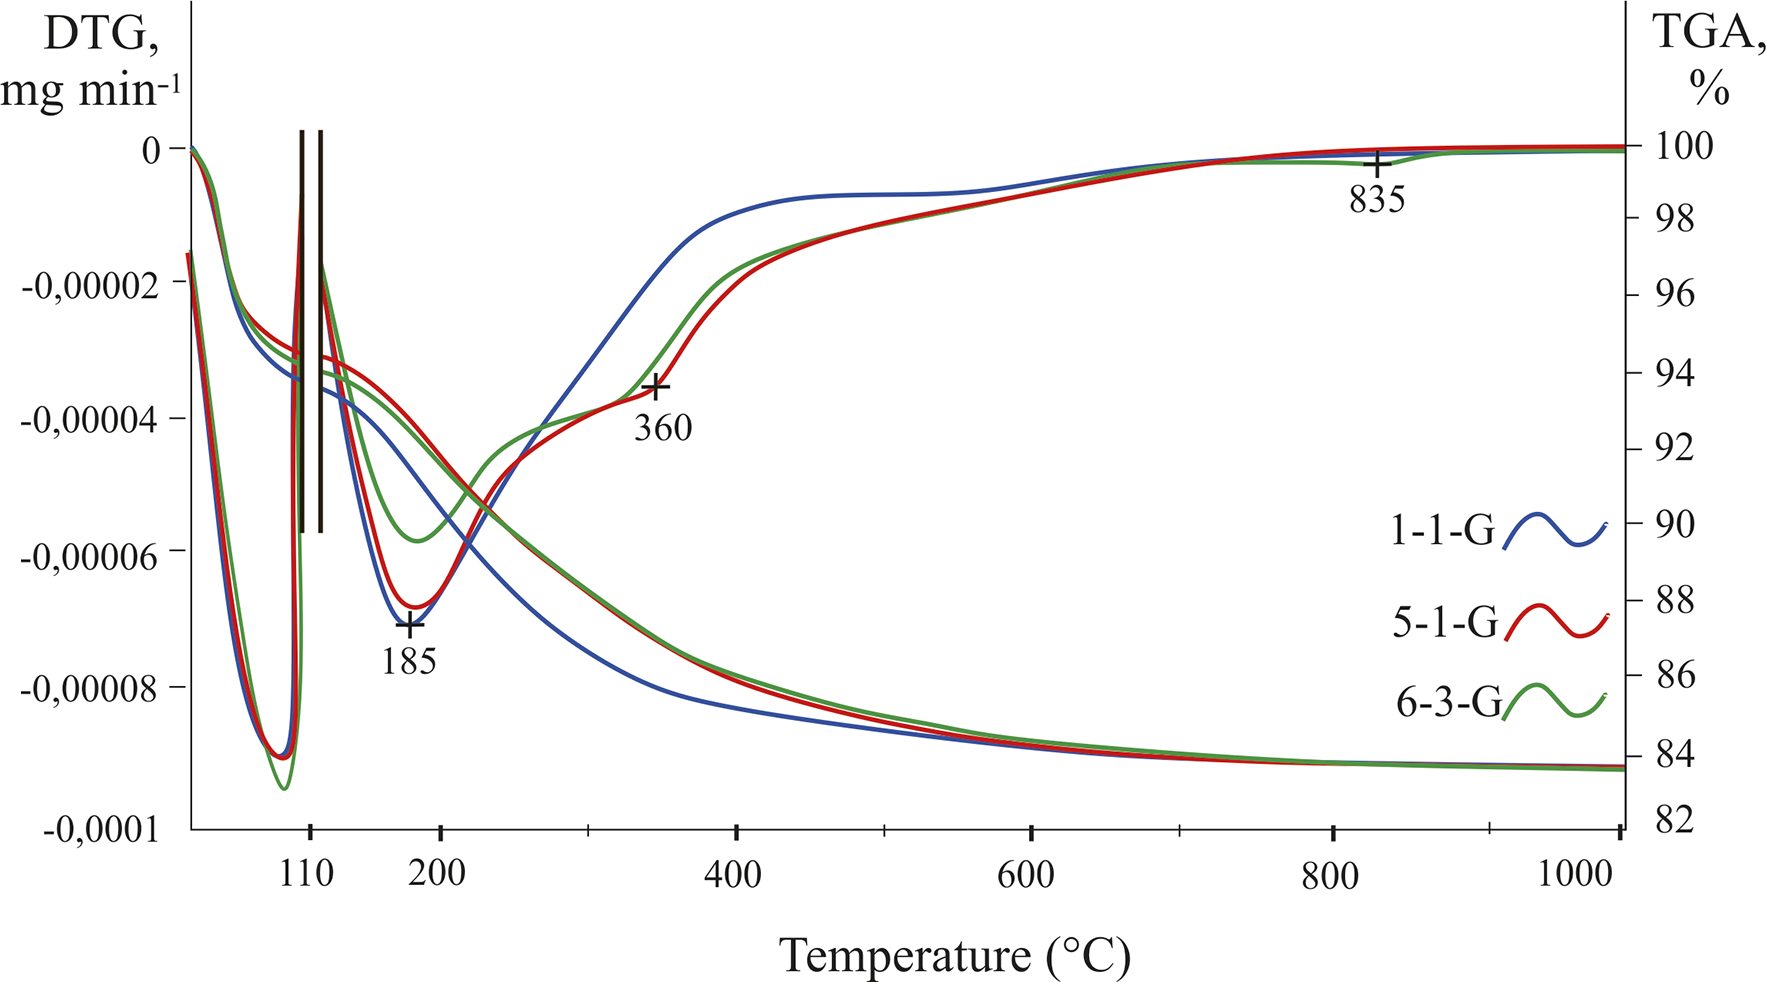
The thermal analysis showed several endothermic events associated primarily with HEU group minerals, and to a lesser extent with associated minerals – smectite, illite, and quartz (Fig. 8).
DTA-DTG curves of the zeolite samples.

The first endothermic peak in the region of 100–120°C is associated with the dehydration of weakly bound water, from both the surfaces of minerals and the zeolite channels and the smectite interlayer (Fig. 8). The endothermic effect at ~185°C is associated with the removal of the bulk of water from the zeolite channels and, in some cases, from the smectite interlayer. At approximately 230°C, an endothermic reaction begins, reaching its maximum at 360°C, and is associated with tightly bound zeolitic water and structural rearrangements in heulandite-1 and heulandite-2 (Mumpton, Reference Mumpton1960; Merkle and Slaughter, Reference Merkle and Slaughter1968; Esenli and Kumbasara, Reference Esenli and Kumbasar1994; Foldvari, Reference Foldvari2011). As sample 1-1-G is the most thermally stable variety, which was confirmed by firing experiments for 24 h (Table 2), this sample does not show a thermal event in this temperature range. At temperatures above 700°C, the destruction of the clinoptilolite structure begins. The distinct event at 835°C is most evident in sample 6-3-G, which contains the maximum amount of smectite and might be associated with amorphization of the smectite.
Chemical composition
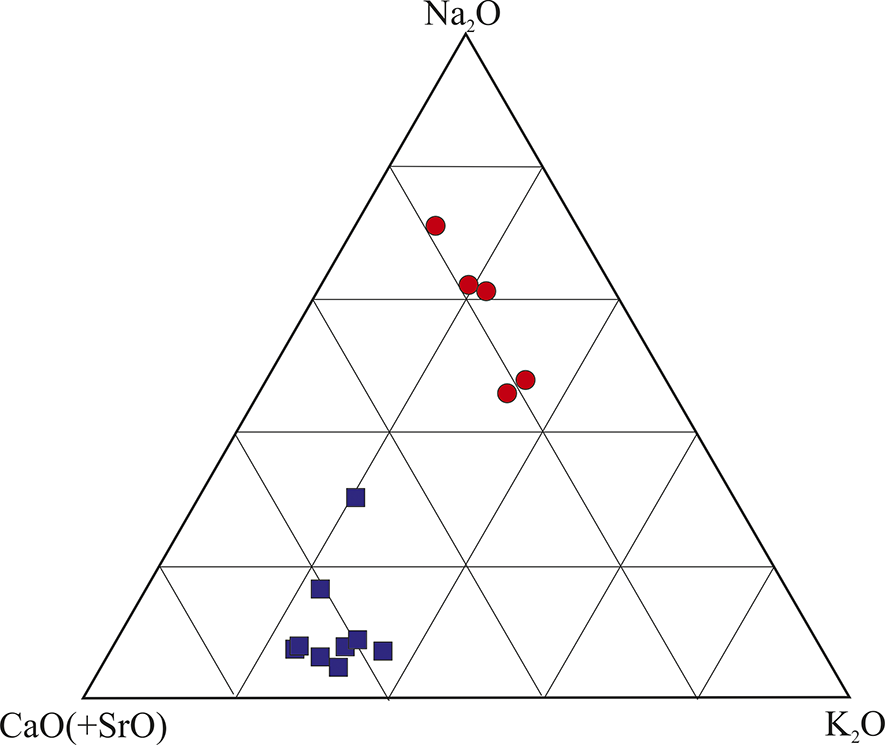
Based on their bulk chemical composition, discrete alkaline and alkaline earth varieties are distinguished (Fig. 9). Alkaline varieties of zeolites, with an increased sodium and potassium content, are confined to the southeastern block of the deposit, where raw material is currently being mined (Fig. 2; Table 3). In contrast, the northwestern block is represented by alkaline-earth varieties with a predominance of calcium as the main extraframework cation.
Ternary diagram of CaO, SrO, Na2O, and K2O distribution in zeolite-rich rocks. Red circles = alkaline varieties of zeolites, blue squares = alkaline earth.

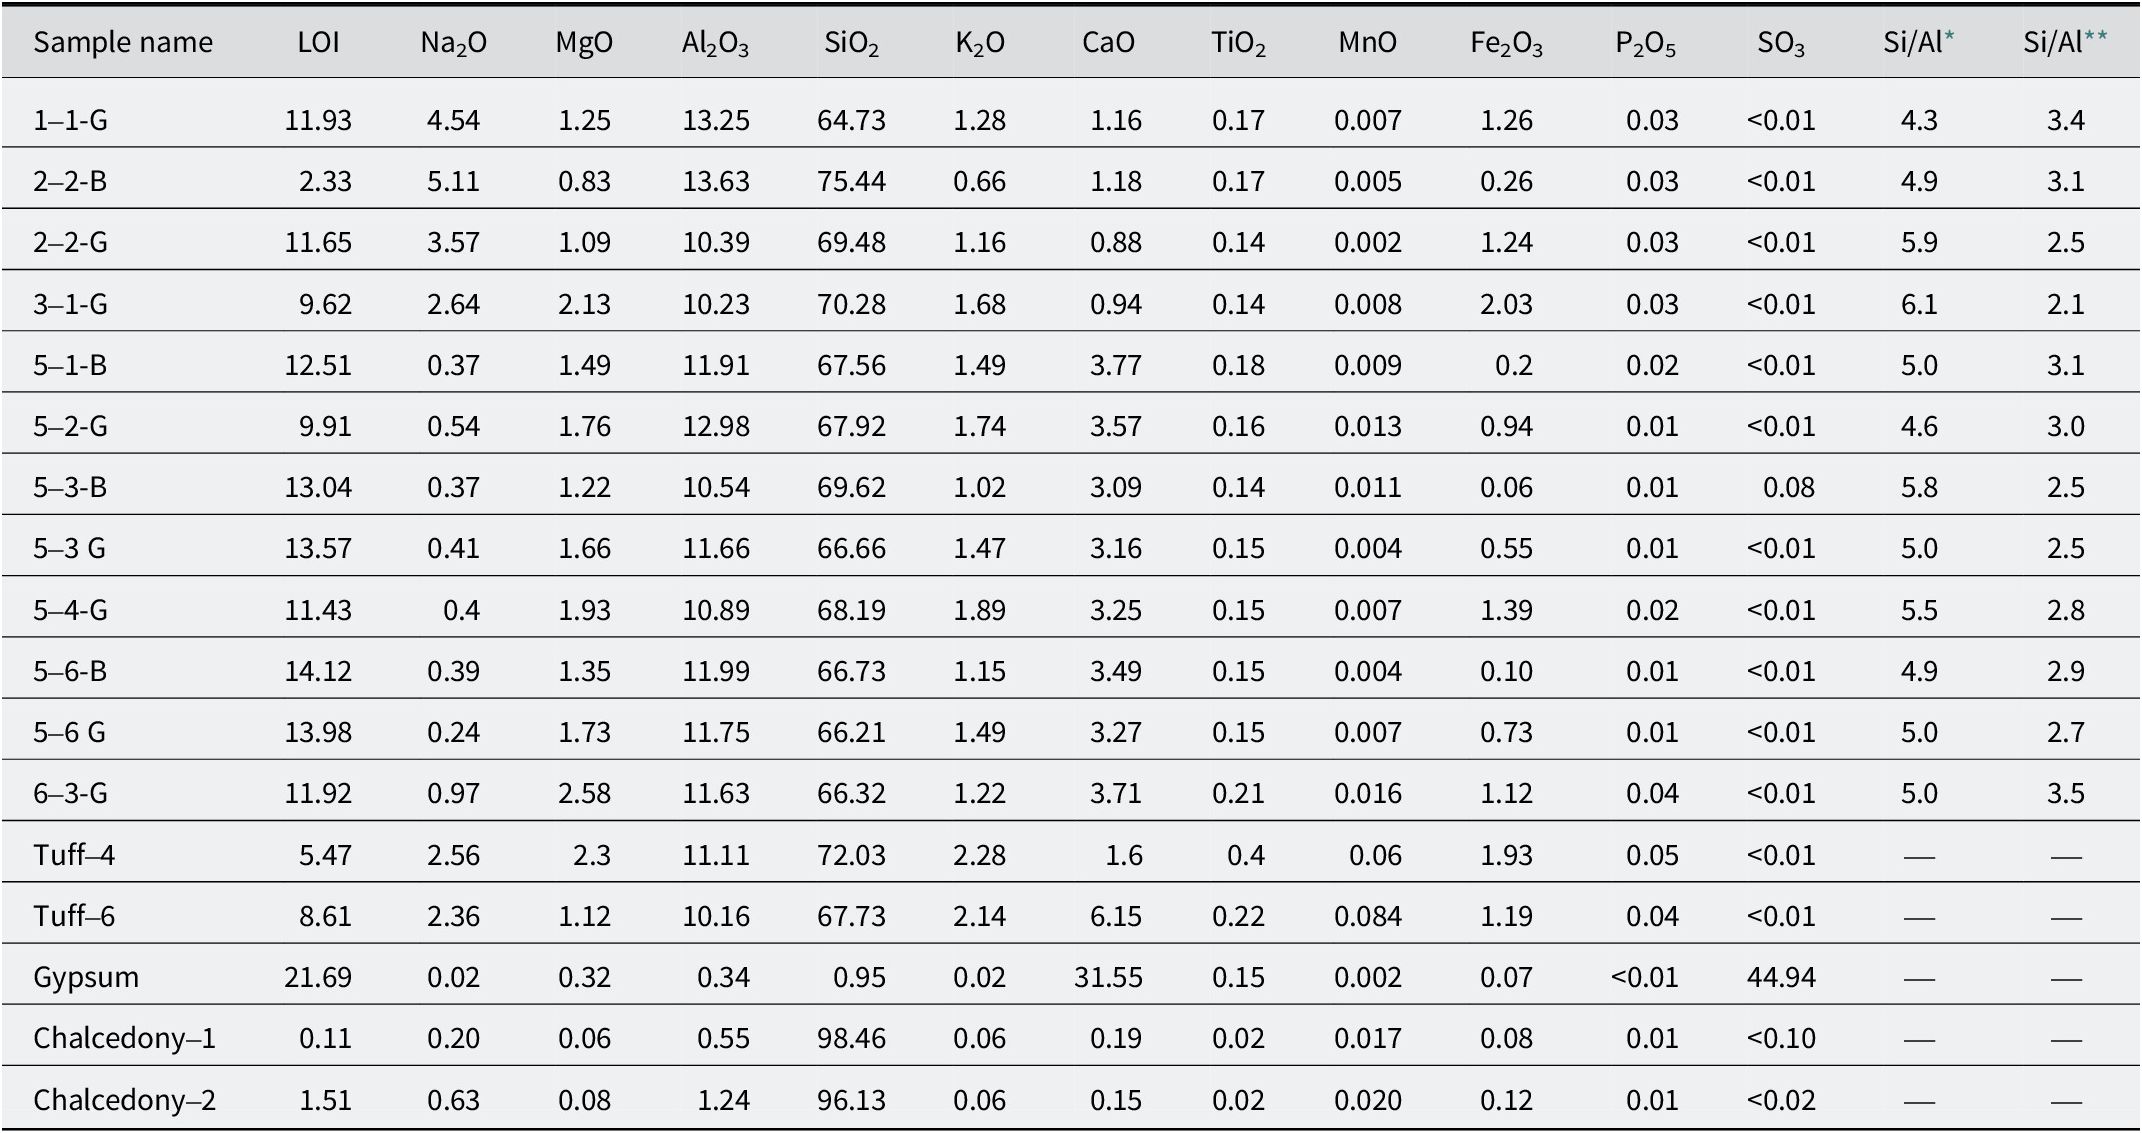
Major element chemical composition of the zeolite rocks (wt.%)

* Calculation for pure zeolite after subtracting impurity phases;
** Calculation for pure zeolite after subtracting impurity phases and extracted amorphous silica.
The color of zeolites depends directly on the Fe2O3 content. The green varieties have Fe2O3 contents of 0.5–2 wt.% and the beige varieties have Fe2O3 contents of <0.3 wt.%.
The zeolites of the Khonguruu deposit are characterized by an increased Sr content relative to typical zeolite compositions (Alietti, Reference Alietti1972; Boles, Reference Boles1972), mainly exchangeable in the zeolite channels (see Table S2 in the Supplementary material). Moreover, the high Sr contents, up to 0.2%, are not associated with a specific HEU-type and are found in both alkaline and alkaline earth types. The source of strontium remains controversial. On the one hand, strontium is distributed unevenly along both the strike and the dip of the layers, and unlike sodium and calcium, it lacks clear zoning, suggesting its connection to secondary processes after the formation of the zeolite layers. On the other hand, the presence of strontium in gypsum deposits located near the deposit may be considered as evidence for the initial presence of strontium in coastal seawater, where the volcanic material accumulated.
The Si/Al ratio in the bulk composition of the samples ranged from 4.3 to 6, indicating the presence of high-Si zeolites. However, these values are not typical for heulandite. Recalculation of the chemical composition after subtraction of impurity minerals did not significantly affect the result (4.3–6.1). Boles (Reference Boles1972) reported Si/Al ratios for heulandite and clinoptilolite of 2.75–3.25 and 4.25–5.25, respectively. Zhao et al. (Reference Zhao, Cleare, Oliver, Ingram, Cook, Szostak and Kevan1998) reported a Si/Al ratio of <4 for a synthetic heulandite, and Bish and Boak (Reference Bish and Boak2001) calculated a Si/Al ratio of 2.6–2.9 for a Sr-heulandite.
This discrepancy can be explained by the fact that the zeolite samples contain amorphous SiO2, as evidenced by the abundant cracks and fractures penetrating the zeolite beds and filled with chalcedony. Figure S1a shows a crust of light-gray siliceous material filling a crack of a tabular zeolite. Figure S1b shows a larger aggregate of dark cherry chalcedony filling a crack in the zeolite bed. The SiO2 content in these samples was 98% and 96%, respectively (Table 3). Thus, it is suggested that after the zeolite formation Si-rich fluids circulated through the cracks and pores of the zeolites, precipitating quartz and increasing the SiO2 content of the rocks.
In order to test this assumption, a series of studies on leaching of amorphous silica from zeolite samples was conducted. The degree of leaching of silicon-oxygen anions from mineral and synthetic silicate phases, both amorphous and crystalline, depends significantly on the following factors: water/solid ratio, type and concentration of the alkaline agent (pH value), intensity and duration of mechanical action, and temperature of the reaction (Marantos et al., Reference Marantos, Christidis and Ulmanu2011). In this regard, experimental conditions were selected carefully, so as to avoid dissolution of crystalline forms of silicon dioxide (or to cause minimal dissolution), while all amorphous forms of SiO2 were dissolved. At the same time, in order to accelerate the chemical treatment and improve the reaction rates, experimental conditions included elevated temperature (90°С), medium alkalinity (1 M NaOH), a sufficiently short duration of treatment (1 h) and a high water/solid ratio (1% dispersion). When the leached amorphous silica is factored out, the Si/Al ratio decreases from 4.3–6.1 to 2.1–3.5, which is closer to the literature data (Table 3) (Boles, Reference Boles1972; Zhao et al., Reference Zhao, Cleare, Oliver, Ingram, Cook, Szostak and Kevan1998; https://webmineral.com). Data on the amount of amorphous silica is used to compare Si/Al ratios and calculate structural formulae.
Specific surface area and porosity of zeolites
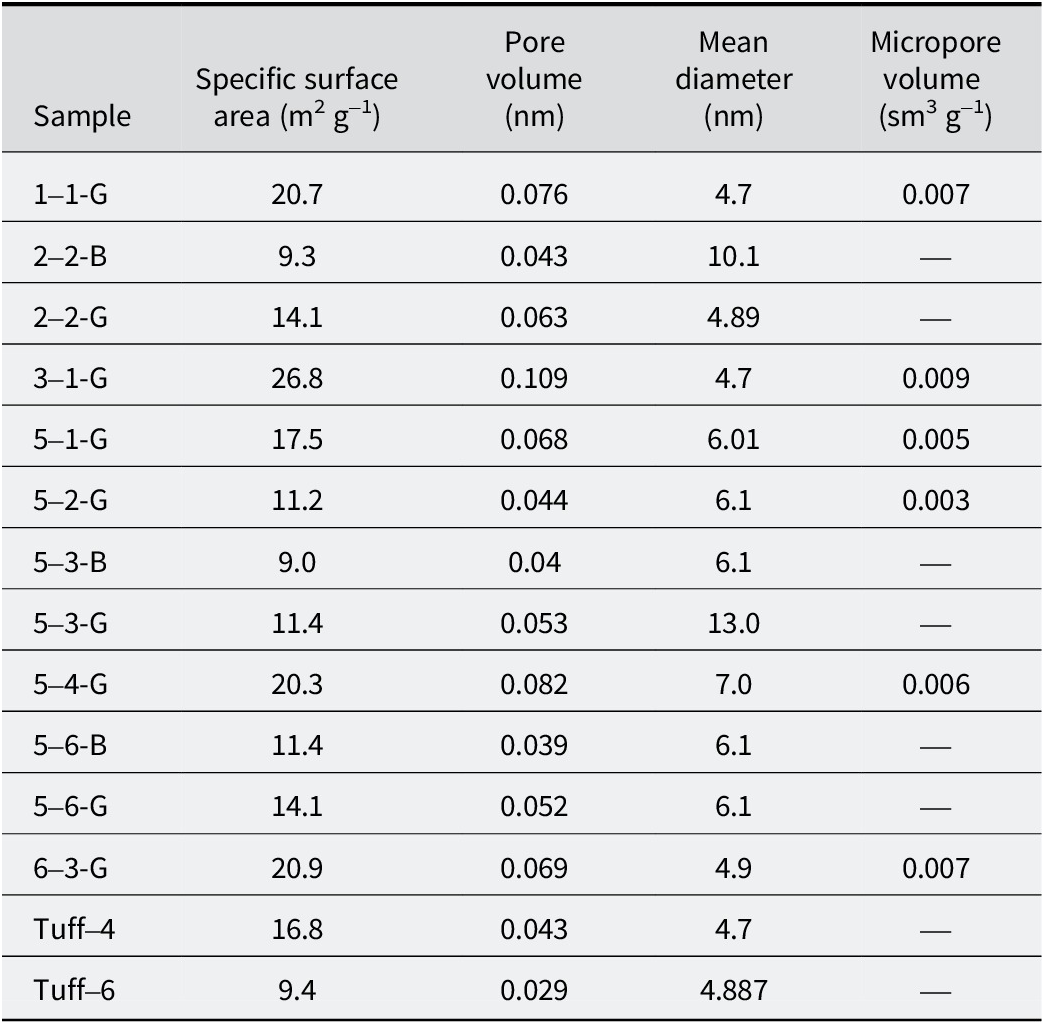
The specific surface area of zeolite from the Khonguruu deposit ranges from 9.3 to 26.8 m2 g–1 (Table 4). The main surface area is accounted for by macropores (>50 nm) and mesopores (2–50 nm), and their total volume is 84% of the total porosity. Micropores (<2 nm) are absent in approximately half of the samples, and their volume in the remaining samples is insignificant and ranges from 10 to 15%. The average pore diameter is 6.4 nm.
Textural properties of studied mineral sorbents

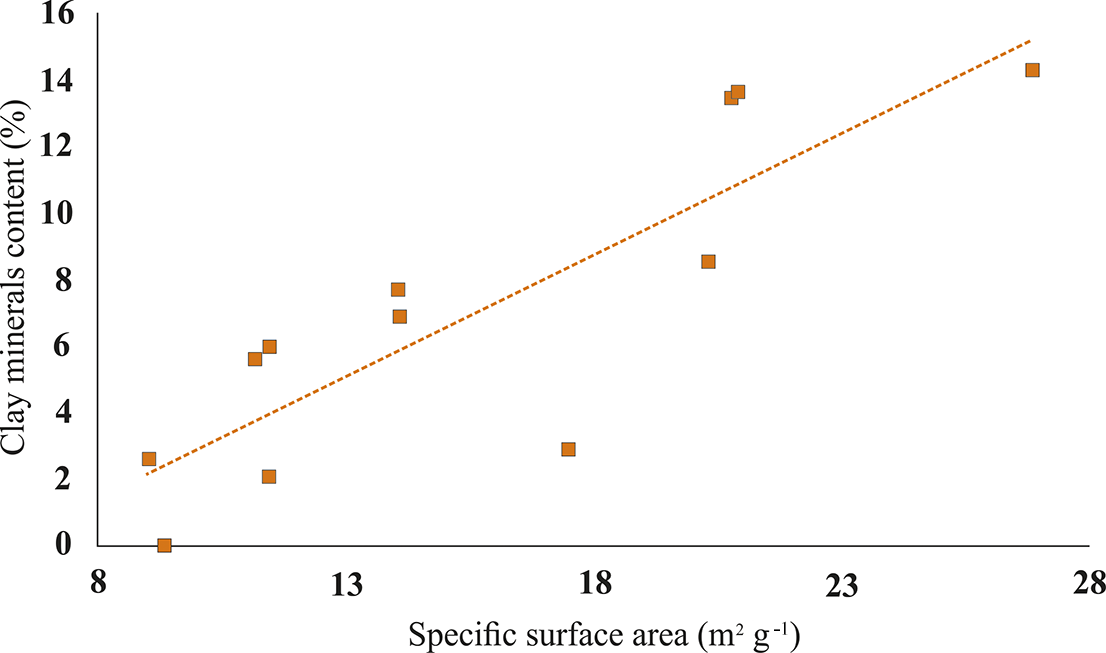
There is a direct correlation between the specific surface area and the abundance of clay minerals in the samples (Fig. 10). Based on this correlation, it can be concluded that the presence of smectite and illite impurities makes a significant contribution to the specific surface area.
Specific surface area vs abundance of clay mineral in the zeolite samples.

Cation exchange capacity
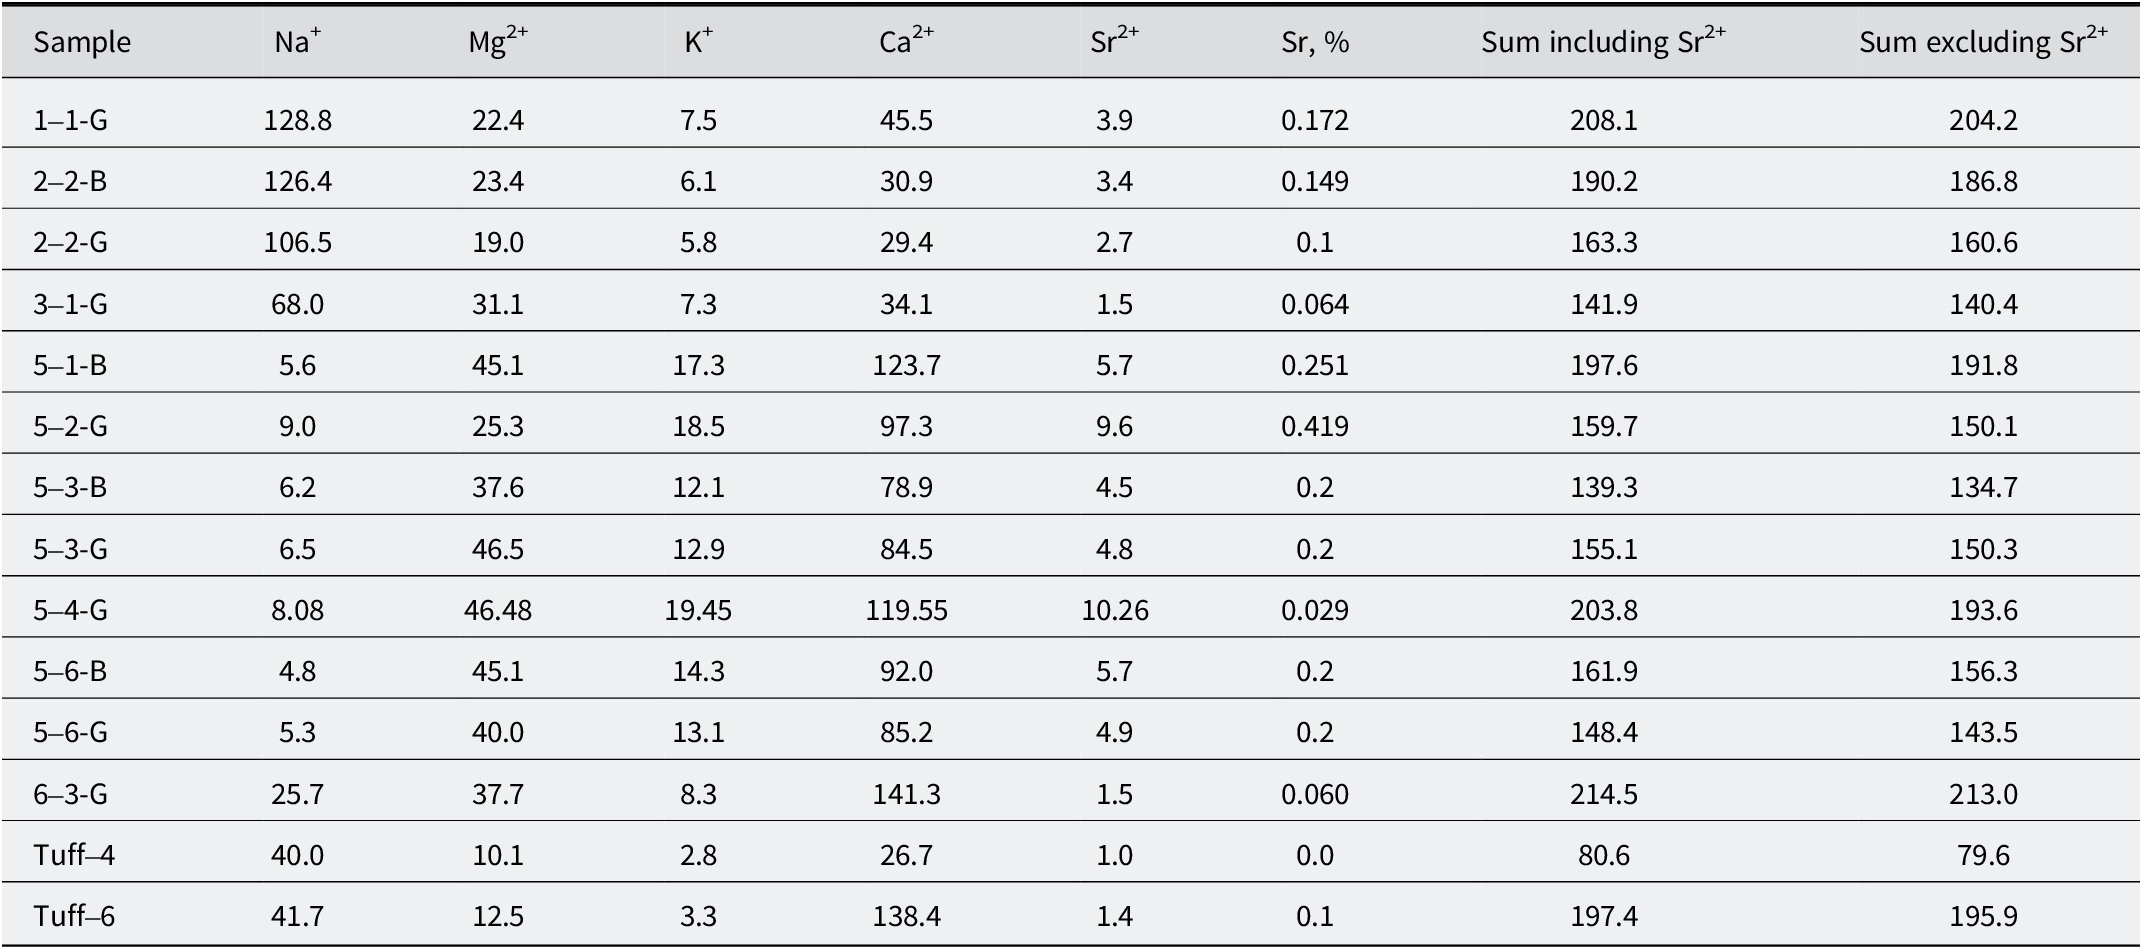
The CEC of zeolite-rich rocks from the Khonguruu deposit ranges from 139.3 to 214.5 cmolc kg–1 including Sr2+ and 134.7 to 213 cmolc kg–1 excluding Sr2+ (Table 5). According to the composition of exchangeable cations, alkaline (Na-K) and alkaline-earth (Mg-Ca) zeolites are distinguished. As described above, the alkaline type of zeolite is confined to the southeastern block of the deposit.
Cation exchange capacity of the zeolite samples (cmolc kg–1)

The increased value of CEC for the Tuff-6 sample is associated with the admixture of carbonates and the dissolution of calcium ions during the saturation procedure with ammonium chloride (Dohrmann, Reference Dohrmann2006).
Structural formulae
An attempt to calculate the structural formulae of different types of zeolite was made. The formulae were calculated for three samples containing different types of heulandite: heulandite-2+clinoptilolite (1-1-G), heulandite-2 (5-2-G), and heulandite-1 (6-3-G).
When calculating the structural formulae, a complex methodology was used, including data processing from chemical analysis (XRF method), mineral/phase composition (quantitative XRD), as well as data on the amorphous silica content.
The structural formulae of pure zeolites were calculated by adjusting the data on the chemical composition of the bulk samples, taking into account the quantitative XRD and the determined amorphous silica content. For each impurity mineral, based on the known average structural formulae, mass contents of oxides, and loss on ignition (LOI) of the mineral, the amount of oxides and LOI per phase were calculated and subtracted from the initial bulk amounts of oxides and LOI. After that the remaining oxide content was normalized to 100%. When amorphous silica was determined, its abundance was subtracted from the total amount of SiO2.
To calculate the formulae, the mass contents of oxides were converted to molar contents, and the LOI value was converted to the molar content of water. The molar contents of oxides were normalized to 1 (by the sum of the molar fractions of aluminum and iron oxides). For each mineral, the molar ratios of Si(IV) oxide to the sum of Fe(III) and Al(III) oxides were calculated. The results are listed in Table 6.
Structural formulae of the zeolite samples

Sorption properties
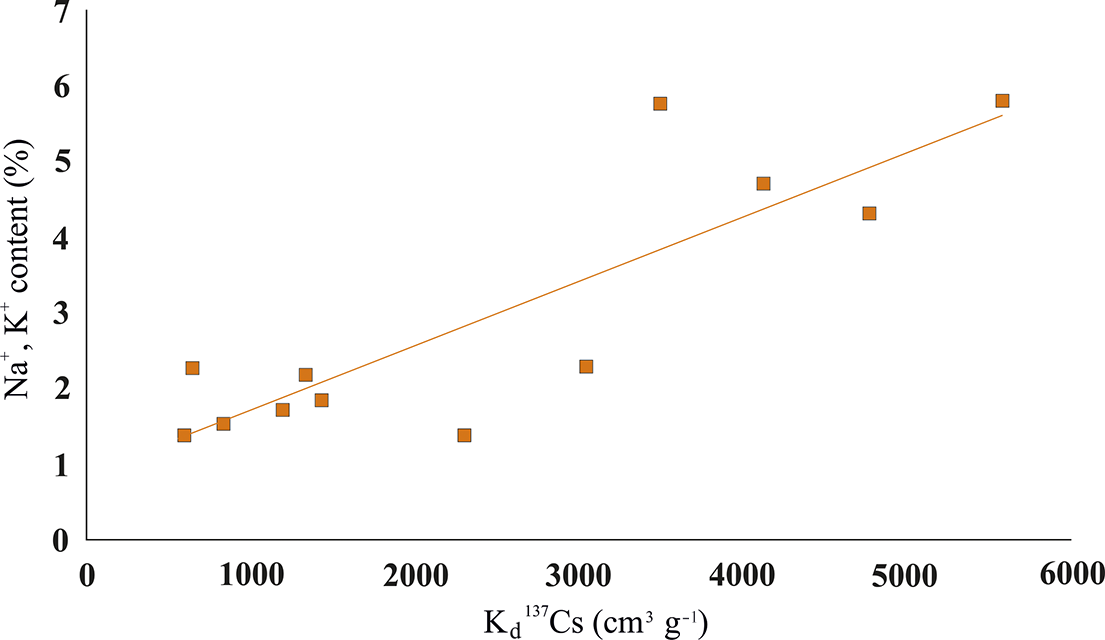
The alkaline zeolites with mainly K and Na extraframework cations showed maximum sorption of Cs radioisotopes (Table S3 in the Supplementary material; see also Fig. 11), whereas zeolites with exchangeable Ca, Mg, and Sr displayed reduced sorption activity. The main mechanism of cesium sorption is ion exchange (El-Kamash, Reference El-Kamash2008; Milyutin et al., Reference Milyutin, Nekrasova, Belousov and Krupskaya2021). Sodium and K cations are more easily replaced during the exchange reaction, which causes this dependence. Large hydrated divalent metal cations are more strongly bound to the surfaces of the channels due to stronger Coulomb attraction. In addition, ion exchange can be sterically hintered due to blocking vacant positions in the zeolite channels.
Dependence of the distribution coefficients (Kd) of the Cs and content of Na and K in zeolite samples.

The sorption of metals could be also affected by β- and γ-radiation. When clinoptilolite is sufficiently irradiated, structural changes occur in it. The selectivity of cesium under these conditions may increase due to the increased mobility of exchange cations as a result of water radiolysis (Moraetis et al., Reference Moraetis, Christidis and Perdikatsis2007).
History of geological development
Considering the conditions of zeolite formation in Russia, it is worth noting that the main deposit types are represented by volcanogenic-sedimentary, hydrothermal, and sedimentary types. Volcanogenic-sedimentary and hydrothermal types are quite common and are structurally confined to the marginal parts of platforms, folded belts, and rift zones, and are formed during periods of increased volcanic activity (Christidis, Reference Christidis2011; Marantos et al., Reference Marantos, Christidis and Ulmanu2011; Belousov et al., Reference Belousov, Kailachakov and Rumyantseva2024a). In the first case, zeolites are formed mainly in marine basins from pyroclastic material, and in the second, they are formed on the slopes of paleovolcanoes due to the action of low-temperature waters on silica-rich volcanic rocks, such as perlite. The example of zeolites of hydrothermal genesis is the Yagodninskoye deposit, located on the Kamchatka Peninsula, which is geologically associated with the island-arc system (Belousov et al., Reference Belousov, Rumyantseva and Kailachakov2024b). The formation of sedimentary deposits is primarily associated with the transformation of amorphous chemobiogenic silica (diatoms, tripoli), as well as terrigenous material and clay minerals in marine platform settings (Marantos et al., Reference Marantos, Christidis and Ulmanu2011). The Khotynets deposit of zeolite-containing tripoli, located in central Russia, belongs to this type (Belousov et al., Reference Belousov, Karelina, Morozov, Rudmin, Milyutin, Nekrasova, Rumyantseva and Krupskaya2023). The amounts of zeolite group minerals in sedimentary deposits typically do not exceed 30–40%, while in volcanogenic deposits they average 60–70%. Depending on the water composition, both alkaline and alkaline earth types can be formed.
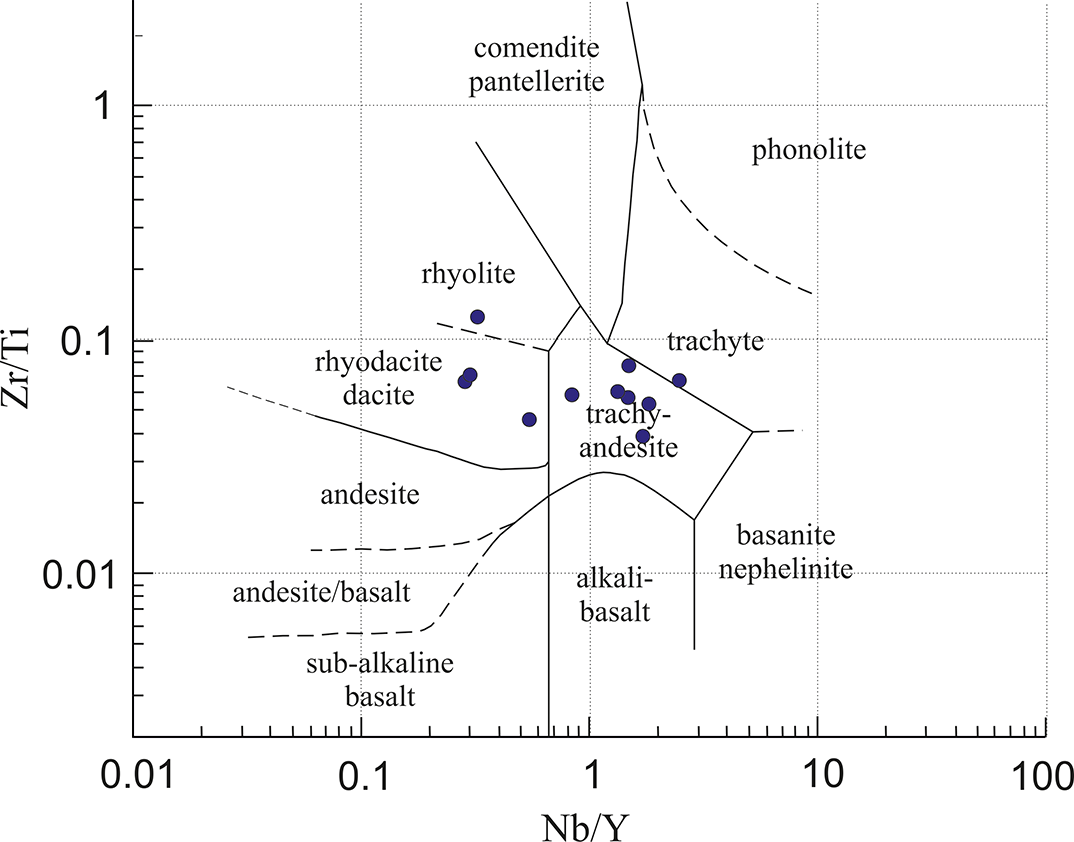
One of the objectives of this study was to establish the conditions for the formation of zeolites at the Khonguruu deposit. The presence of interbedded layers of unaltered tuffaceous sandstones, zeolites, and marine sediments such as marls, limestones, and dolomites in the deposit section indicates that these zeolites have a volcanogenic-sedimentary origin and were formed by alteration of volcanic ash material in coastal sea waters. Also, tuffaceous textures, accessory opaque minerals (magnetite, galena), and non-metallic heavy minerals (zircon, monazite, apatite) minerals, characteristic of igneous activity, are present in the zeolite samples. To establish the composition of parent rocks of the zeolites, ratios of immobile trace elements (Ti, Nb, Zr, Y) were used (Winchester and Floyd, Reference Winchester and Floyd1977; Huff et al., Reference Huff, Merriman, Morgan and Roberts1993). Both zeolites and the tuffs enclosing them were analyzed. Projection of the rock compositions on the diagrams showed a trachyandesitic composition, and, to a lesser extent, acidic (dacitic, rhyodacitic) composition (Fig. 12).
Projection of the Khonguruu zeolites on the diagram of Winchester and Floyd (Reference Winchester and Floyd1977).

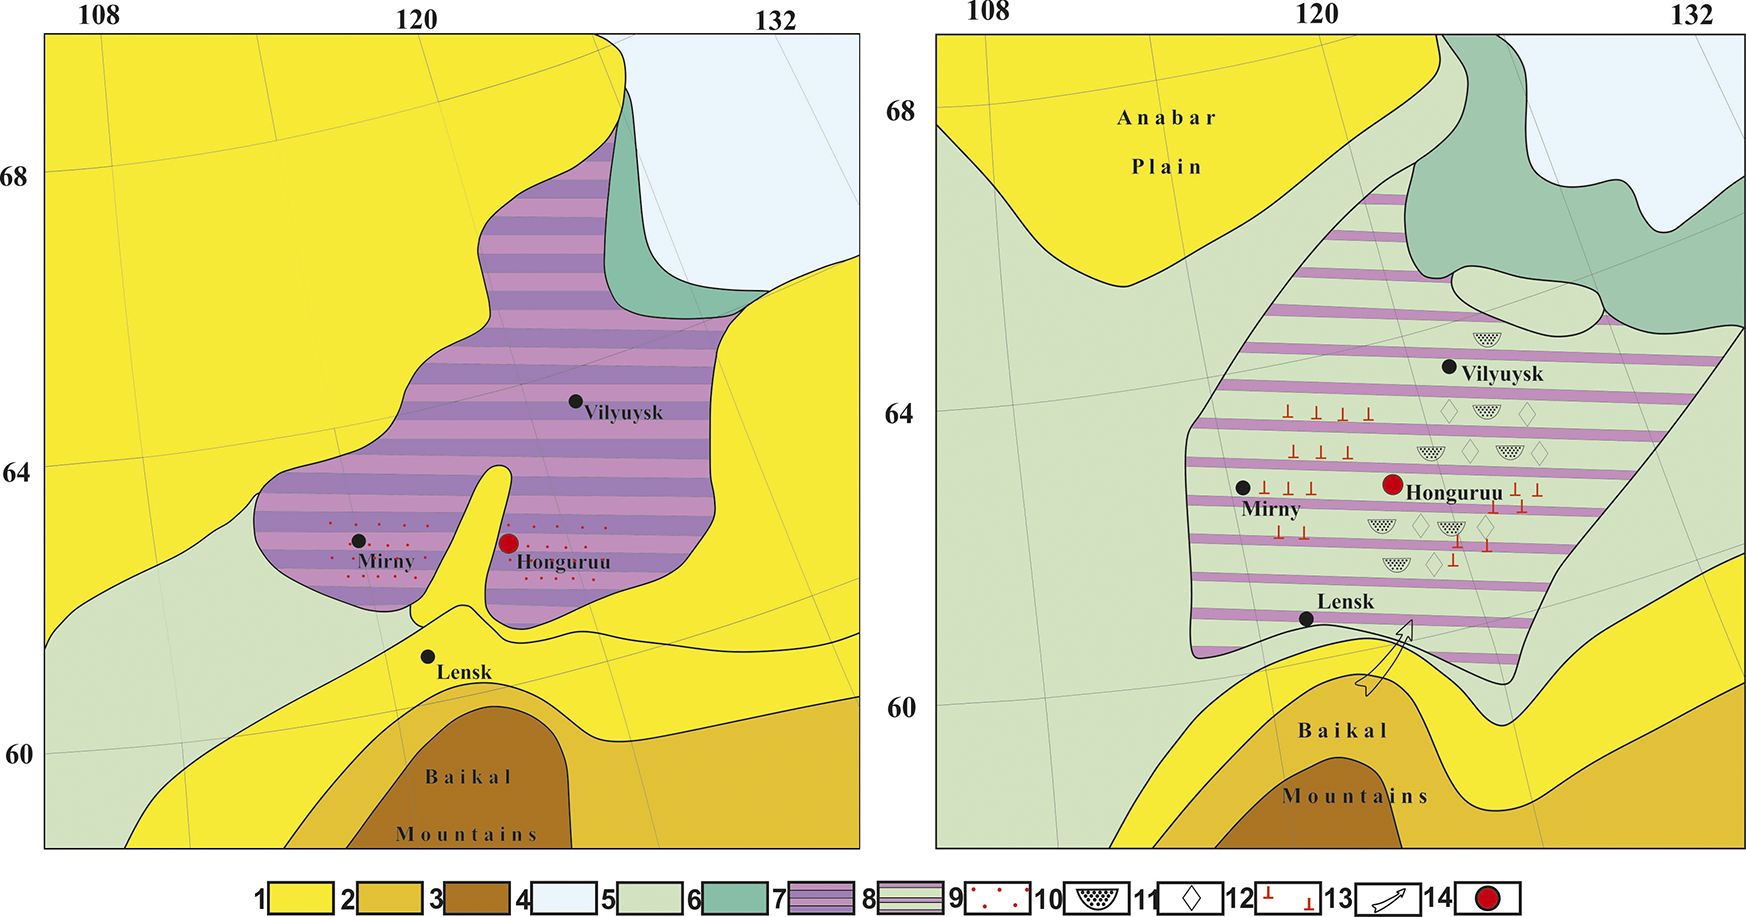
A study of paleogeographic maps (Pozner, Reference Pozner1969) showed that the study area was a platform-type sea during the Middle Paleozoic. The area of the deposit is represented by a bay with alternating conditions of low and high salinity within the zone of volcanic ash distribution (Fig. 13). In the south the territory was limited by the Baikal Mountains, which provided terrigenous sediments. In the Famennian the sea regressed. The area of the deposit turned into a coastal plain, occasionally flooded by seawater with alternating conditions of high and low salinity. Deposits of anhydrite, gypsum, and rock salt occur along the periphery.
Paleotectonic settings of the Khonguruu deposit area in Tournai (left) and Famennian (right) stage. Key: 1 = hilly plain; 2 = elevated plain, plateau; 3 = high mountains; 4 = shallow water zone; 5 = low-lying accumulative plain; 6 = coastal plain occasionally flooded by the sea; 7 = inland sea, lake, bay with alternating conditions of low and high salinity; 8 = coastal plain occasionally flooded by sea waters with alternating conditions of high and low salinity; 9 = volcanic ash distribution zone; 10 = rock salt; 11 = anhydrites and gypsum; 12 = pyroclastic material of basic (alkaline) composition; 13 = direction of removal of detrital and terrigenous material; 14 = Khonguruu deposit.

The beginning of active differentiation of tectonic movements dates back to the end of the Late Devonian–beginning of the Early Carboniferous. It was accompanied by volcanic activity of acidic affinities, which is unusual for platform magmatism. The source of volcanic material would have been in the vicinity of the study area (Chumakov, Reference Chumakov1959), probably volcanoes confined to faults in the crystalline basement, which bounded the Suntar uplift.
According to Chumakov (Reference Chumakov1959) and based on the general geological history of the area, the first movements of salt masses were associated with intensive differentiated movements of the crystalline basement at the Upper Devonian–Lower Carboniferous boundary. It can be assumed that these movements have led to the development of a series of cracks within the zeolite layers at the post-diagenetic stage, through which silicon-saturated solutions circulated. The intensity of these movements is evidenced by the manifestations of volcanic activity, the greatest activity of which, judging by the amount of tuffaceous material in the studied section, occurred at the end of the Devonian–beginning of the Carboniferous.
Summary and conclusion
The Khonguruu deposit is located 22 km east of Kempendyai village in the Suntarsky district. Structurally, the deposit is located on the southeastern edge of the Taas-Tuus salt-dome anticline structure. The deposit is composed of four layers of zeolitized tuffs belonging to the Devonian volcanogenic-sedimentary rocks of the Kempendyai suite (D3km) and the Upper Devonian–Lower Carboniferous terrigenous rocks of the Kurunguryakh suite (D3-C1kr).
For the first time, detailed studies of the mineral composition of zeolites were conducted at this deposit. The presence of amorphous silica in the samples and its influence on the results of other analytical studies were also demonstrated. This information is not only of scientific importance but also expands the industrial potential of this Khonguruu zeolite deposit.
The rocks consist of 55–80% zeolite group minerals. The zeolites are represented by three types of minerals – heulandite-1, heulandite-2 and, to a lesser extent, clinoptilolite. Most of the samples are a mixture of heulandite-2 and clinoptilolite. Heulandite-1 is less common and is typical of weathered samples located in the near-surface zone. Smectite, quartz, plagioclase, and micaceous minerals are present as impurities; calcite was detected in only one sample.
Macroscopically, green and beige varieties of the zeolites are distinguished according to color. The green variety is represented by dense tuffs almost completely replaced by cryptocrystalline zeolites, whereas the beige one is more porous with a tuffaceous structure. The CEC of zeolites ranged from 140 to 204 cmolc kg–1. Based on the composition of the exchangeable cations, alkaline and alkaline-earth zeolites can be distinguished. The zeolites of this deposit contain abundant exchangeable Sr in the zeolite channels. The specific surface area of the Khonguruu zeolites range from 9.3 to 26.8 m2 g–1. There is a direct correlation between the specific surface area and the presence of clay minerals in the samples. All the zeolite samples contain amorphous silica, as evidenced by the widespread development of cracks and fractures crosscutting the zeolite beds and filled with chalcedony, which formed by secondary processes.
To study the possibility of industrial applications of these zeolites as a sorbent for the purification of wastewater contaminated with radionuclides, additional experiments on sorption of cesium were conducted. Alkaline zeolites have the highest sorption capacity for cesium, while sorption of cesium on alkaline-earth varieties is limited by the presence of large cations of calcium and strontium, which are more strongly bound to the surface of the channels due to Coulomb attraction.
The zeolites of the Khonguruu deposit have a volcanogenic-sedimentary origin and were formed from ash materials of intermediate and acidic compositions in coastal sea waters with alternating conditions of low and high salinities.
Supplementary material
The supplementary material for this article can be found at http://doi.org/10.1017/cmn.2026.10023.
Author contribution
P. Belousov: field work, processing of received analytical data, project administration, writing the article; A. Rumyantseva: field work, petrographic research, article design; G. Christidis: processing of received analytical data, writing the article; P. Kailachakov: preparation of graphic materials; T. Koroleva: XRD and FTIR analysis; B. Pokidko: CEC analysis; V. Milyutin and V. Kaptakov: sorption experiments; A. Zhuravlev: sample preparation, graphic material preparation; V. Krupskaya: XRD analysis and processing of received analytical data.
Acknowledgements
The authors express their gratitude to Dr Tyupina E.A. for the measurements of specific surface area and porosity, and to the General Director of Suntarzeolite LLC Popov P.M. for assistance in conducting fieldwork at the Khonguruu deposit.
Financial support
Field work at the Khonguruu deposit was carried out with the financial support of the Russian Science Foundation, project no. 22-77-10050. Analytical work on the study of zeolite samples was carried out within the framework of the basic theme of the IGEM RAS.
Competing interests
The authors of this work declare that they have no competing interests.
Data availability statement
Data will be made available on request