Introduction
Late-life anxiety is an increasingly relevant psychiatric condition. With increasing numbers of older adults, anxiety will become an increasing cause of health care utilization contributing to elevated personal and societal costs (Wolitzky-Taylor et al., Reference Wolitzky-Taylor, Castriotta, Lenze, Stanley and Craske2010). Unfortunately, the detection of anxiety disorders in late life is complicated by cognitive decline, newly emergent changes in life circumstances, high medical comorbidity, and a symptom presentation that is markedly different from younger age groups (Magni and DeLeo, Reference Magni and DeLeo1984; Kogan et al., Reference Kogan, Edelstein and McKee2000; Cully et al., Reference Cully2006; Seignourel et al., Reference Seignourel, Kunik, Snow, Wilson and Stanley2008; Wolitzky-Taylor et al., Reference Wolitzky-Taylor, Castriotta, Lenze, Stanley and Craske2010; Therrien and Hunsley, Reference Therrien and Hunsley2012). For many of the above reasons, anxiety disorders in late life are more likely to go unnoticed and untreated relative to anxiety in younger populations. Assessing the presence and severity of clinical anxiety in the elderly is an important challenge for researchers and clinicians alike. However, relatively little is known about the assessment of anxiety in older adults (Ayers et al., Reference Ayers, Sorrell, Thorp and Wetherell2007).
Self-report measures are by far the most common method of assessment of anxiety (Alwahhabi, Reference Alwahhabi2003; Dennis et al., Reference Dennis, Boddington and Funnell2007). Self-report inventories are easily administered and limit patient/participant burden. Approximately 12 different anxiety measures have been identified as commonly used for the assessment of anxiety in older adults (Therrien and Hunsley, Reference Therrien and Hunsley2012). Most of these measures were originally developed and validated in college samples and therefore lack norms and sufficient psychometric evidence for use with older adults. Additionally, many of these measures fail to capture the unique phenomenology of anxiety in the elderly (Edelstein et al., Reference Edelstein2008). For example, an overabundance of somatic items can obfuscate differences between medical and psychological causes of anxiety in this population (Therrien and Hunsley, Reference Therrien and Hunsley2012). Moreover, instruments developed in younger populations should be normed with samples of older adults, providing age-appropriate norms for this population. It is well known that the clinical expression and severity of anxiety symptoms may change with age (Wolitzky-Taylor et al., Reference Wolitzky-Taylor, Castriotta, Lenze, Stanley and Craske2010). Another important issue for the assessment of late-life anxiety is the frequent comorbidity with other mental disorders (Kogan et al., Reference Kogan, Edelstein and McKee2000). Particularly, the high comorbidity of anxiety and depression among younger adults (Mineka et al., Reference Mineka, Watson and Clark1998) becomes even more impressive in older adults, with approximately half of depressed older adults also meeting criteria for an anxiety disorder (Beekman et al., Reference Beekman, de Beurs, van Balkom, Deeg, van Dyck and van Tilburg2000). Thus, anxiety instruments able to disentangle symptoms of anxiety and depression are especially needed among elderly samples.
To address many of these limitations some researchers have investigated the psychometric properties of existing anxiety questionnaires in older adults (such as the abbreviated Penn State Worry Questionnaire (Hopko et al., Reference Hopko2003; Crittendon and Hopko, Reference Crittendon and Hopko2006; Nuevo et al., Reference Nuevo, Mackintosh, Gatz, Montorio and Wetherell2007; Wuthrich et al., Reference Wuthrich, Johnco and Knight2014) and the Geriatric Anxiety Inventory-short form (Byrne and Pachana, Reference Byrne and Pachana2011)). Additionally, new measures have been created specifically for use with older adults (e.g. Geriatric Anxiety Inventory; Pachana et al., Reference Pachana, Byrne, Siddle, Koloski, Harley and Arnold2007, Adult Manifest Anxiety Scale-Elderly Version; Reynolds et al., Reference Reynolds, Richmond and Lowe2003, Geriatric Anxiety Scale; Segal et al., Reference Segal, June, Payne, Coolidge and Yochim2010).
Despite the strengths of modified and newly developed measures for use in older adults (e.g. adequate internal consistency, strong convergent validity), these measures present several limitations which may restrict their clinical utility in specific groups of older adults. For example, some of these scales exhibit poor discrimination between anxiety and depression or health-related variables. Some of the aforementioned measures use dichotomous response formats, which can provides less information (when compared to dimensional rating) regarding the severity of symptoms. Finally, many anxiety measures exhibit poor reliability for items assessing physical or sleep disturbances in the elderly, potentially due to difficulty in differentiating anxiety from medical disorders and elevated prevalence of sleep difficulties in later life (Foley et al., Reference Foley, Ancoli-Israel, Britz and Walsh2004; Crittendon and Hopko, Reference Crittendon and Hopko2006; Andrew and Dulin, Reference Andrew and Dulin2007; Byrne et al., Reference Byrne, Pachana, Arnold, Chalk and Appadurai2008; Diefenbach et al., Reference Diefenbach, Tolin, Meunier and Gilliam2009; Segal et al., Reference Segal, June, Payne, Coolidge and Yochim2010; Yochim et al., Reference Yochim, Mueller, June and Segal2011; Gould et al., Reference Gould, Segal, Yochim, Pachana, Byrne and Beaudreau2014; Johnco et al., Reference Johnco, Knight, Tadic and Wuthrich2014; Mueller, Reference Mueller2014). Moreover, geriatric anxiety measures cannot be used for investigating anxiety in younger age groups, a particular challenge for studies investigating anxiety across the lifespan. While age-specific measures have their benefits, the availability of general anxiety questionnaires with age-based norms can be preferable to age-specific instruments. Consequently, examination of the psychometric properties in currently available measures of anxiety when used with older adults (in lieu of revising these instruments for age-specific use) is helpful for many of the aforementioned reasons.
The STICSA (Ree et al., Reference Ree, French, Macleod and Locke2008) was recently developed to overcome several limitations issues associated with Spielberger's State-Trait Anxiety Inventory (STAI; Spielberger et al., Reference Spielberger, Gorsuch, Lushene, Vagg and Jacobs1983; Kennedy et al., Reference Kennedy, Schwab, Morris and Beldia2001; Therrien and Hunsley, Reference Therrien and Hunsley2012). To date, the STICSA has been shown to have excellent psychometric properties in both nonclinical and clinical samples of adults (Gros et al., Reference Gros, Antony, Simms and McCabe2007; Ree et al., Reference Ree, French, Macleod and Locke2008; Gros et al., Reference Gros, Simms and Antony2010; Van Dam et al., Reference Van Dam, Gros, Earleywine and Antony2013) and to differentiate anxiety from depression better than other commonly used anxiety measures (e.g. the STAI; Gros et al., Reference Gros, Antony, Simms and McCabe2007). The fact that the STICSA assesses cognitive and somatic dimensions of anxiety, and particularly that it can differentiate anxiety and depression, makes it an attractive tool for assessing anxiety in the elderly.
To our knowledge, no previous studies have investigated the psychometric properties of the STICSA in older adults. Accordingly, our aims were to assess the factor structure and discriminant validity of the Italian version of the STICSA in a sample of middle-aged and older adults. We predicted confirmation of the original four-factor structure (e.g. state vs. trait and cognitive vs. somatic dimensions). Concurrent and discriminant validity were investigated by administering two self-report measures of depression and a measure of quality of life, the latter assessing mental and physical health functioning. Our hypotheses were that: (1) cognitive and somatic subscales of the STICSA are correlated reciprocally more strongly than they are correlated with measures of depression; (2) the STICSA correlates more strongly with mental health functioning than with physical health functioning, indicating the ability of STICSA scores to discriminate between anxiety and physical health issues.
Additionally, we assessed whether age (older adults – 65 years and older – vs. middle-aged adults – 50–64 years old) and sex had an effect on STICSA scores. While there are no clear-cut boundaries between adulthood and late adulthood, 65 years is a common cutoff used for “old age” (Federal Interagency Forum on Aging-Related Statistics, 2012; World Health Organisation, 2014), corresponding with the age at which one can begin to receive pension benefits in several Western countries. We hypothesized a significant effect of sex, consistent with studies indicating increased risk among older women for an anxiety disorder (Wolitzky-Taylor et al., Reference Wolitzky-Taylor, Castriotta, Lenze, Stanley and Craske2010), as well as with higher scores on trait anxiety among older women relative to men (Bergua et al., Reference Bergua2012).
Methods
Participants
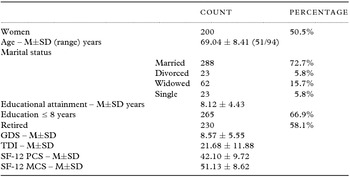
Participants were 396 community-dwelling middle-aged and elderly adults (196 men). Mean age of the sample was 69.04 years (SD = 8.41; 69.08 ± 8.21 and 69.01 ± 8.62, respectively, for men and women; t(394) = 0.08; p = 0.94). Just under 65% (64.8%) of the sample was 65 years or older. Sociodemographic characteristics of the sample are listed in Table 1. No clinical diagnoses were provided. However, according to the previously reported cut-off scores of the STICSA (Van Dam et al., Reference Van Dam, Gros, Earleywine and Antony2013), 30.8% (n = 122) of the participants met criteria for clinical anxiety (STICSA Trait scale total score > 43), while 5.3% (n = 21) of the participants met criteria for the possible presence of anxiety disorders (STICSA Trait scale total score > 40).
Descriptive statistics of the sample (N = 396)

Note. TDI = teate depression inventory; GDS = geriatric depression scale; PCS = SF-12 physical composite score; MCS = SF-12 mental composite score.
The sample was recruited through advertisements (flyers, newspapers, and online ads) posted for established community groups (senior centers, retirement communities, and church groups, which focused on older adults). Study participants contributed voluntarily and anonymously; no honorarium was given for completing the assessments. All participants provided written, informed consent. The study was approved by the local institutional review board.
Measures
All participants were administered Italian versions of the STICSA, the Teate Depression Inventory (TDI; Balsamo and Saggino, Reference Balsamo and Saggino2013; Reference Balsamo and Saggino2014; Balsamo et al., Reference Balsamo, Giampaglia and Saggino2014), the Geriatric Depression Scale (GDS; Yesavage et al., Reference Yesavage1982), and the short-form-12 (SF-12) Health Survey (Ware et al., Reference Ware, Kosinski and Keller1996). All the respondents completed paper-and-pencil versions of the questionnaires in a fixed order (a sociodemographic checklist, the GDS, the STICSA, the SF-12, and the TDI) on site at within established community groups. The protocol was administered by licensed psychologists who had a four-hour training wherein the objectives of the research, characteristics of the instruments administered, and information about common issues in psychological assessment among older adults (e.g. the effects of visual impairment or cognitive deficits on psychological testing) was explained. Since participants anonymously completed the assessments, those who scored highly on the depression and anxiety scales did not receive advice regarding psychological treatment. The STICSA is a 21-item measure designed to assess cognitive (e.g. “I feel agonized over my problems,” “I think that others won't approve of me”) and somatic (e.g. “My heart beats fast,” “My muscles are tense”) symptoms. It can be administered in both trait and state variations. In the trait-anxiety subscale, the individual rates how often a statement is true in general, whereas in the state-anxiety subscale she/he rates how she/he feels at the moment of assessment. In total, the overall scale is made up of four subscales: State–Somatic (SS), Trait–Somatic (TS), State–Cognitive (SC), and Trait–Cognitive (TC). Each statement is rated on a four-point Likert-type scale from 1 (not at all) to 4 (very much so). Items of the STICSA were translated into Italian according to standard procedures of forward- and back-translation (van de Vijver and Tanzer, Reference van de Vijver and Tanzer1997). The translation was performed first from English into Italian and then from Italian into English by two independent bilingual professionals. The translators were two independent bilingual psychologists with previous experience in the cross-cultural validation of mental health measures. The back-translated version of the STICSA was submitted and approved by the author of the original scale (M. Ree, personal communication, February 04, 2013), who did not find any discrepancy in comparison to the original English version.
The GDS is a 30-item self-report questionnaire designed to measure depression in a geriatric population. Items represent symptoms of depression commonly seen in the elderly across affective (e.g. sadness, apathy, crying) and cognitive domains (e.g. thoughts of hopelessness, helplessness, guilt, worthlessness). The GDS does not assess somatic symptoms of depression (e.g. disturbances in energy level, appetite, sleep, sexual interest), which may confer less discriminability between depression and health conditions (Smarr and Keefer, Reference Smarr and Keefer2011). Respondents rate each item on a dichotomous (yes/no) scale and the total score ranges between 0 and 30, with higher scores indicating more severe depression. In the present sample, Cronbach's α was 0.84.
The TDI is a new 21-item self-report instrument designed to assess major depressive disorder as specified by the latest editions of the DSM (DSM-IV-TR and DSM-V; American Psychiatric Association, 2000; 2013) (Balsamo and Saggino, Reference Balsamo and Saggino2013). It was developed via Rasch logistic analysis of responses, within the framework of item response theory (Rasch, Reference Rasch1980; Andrich, Reference Andrich1995), in order to overcome inherent psychometric weaknesses of existing measures of depression, including the BDI-II (Balsamo and Saggino, Reference Balsamo and Saggino2007). Each item is rated on a five-point Likert-type scale, ranging from 0 (always) to 4 (never). A small but growing literature suggests that the TDI has strong psychometric properties in both clinical and nonclinical samples, including an excellent Person Separation Index, no evidence of bias due to item-trait interaction, good discriminant and convergent validity, and control of major response sets (Balsamo and Saggino, Reference Balsamo and Saggino2013, Reference Balsamo and Saggino2014; Balsamo et al., Reference Balsamo, Romanelli, Innamorati, Ciccarese, carlucci and Saggino2013, Reference Balsamo, Giampaglia and Saggino2014; Innamorati et al., Reference Innamorati2013). In a recent study, three cut-off scores were recommended in terms of sensitivity, specificity, and classification accuracy for screening for varying levels (minimal, mild, moderate, and severe) of depression severity in a group of patients diagnosed with major depressive disorder (Balsamo and Saggino, Reference Balsamo and Saggino2014). In the present sample, Cronbach's α was 0.88.
The SF-12 is a 12-item SF of the SF-36 (Ware and Sherbourne, Reference Ware and Sherbourne1992). The SF-12 was developed for the Medical Outcomes Study (Stewart and Ware, Reference Stewart and Ware1992), a multi-year study of patients with chronic conditions. The instrument was designed to reduce respondent burden while achieving minimum standards of precision for purposes of group comparisons involving multiple health dimensions. The SF-12 assesses health-related quality of life in the last four weeks and covers the same health domains as the original SF-36 with one or two questions per domain, and provides two composite scores of physical (PCS) and mental health (MCS). Internal consistency coefficients were 0.80 and 0.77 for PCS and MCS, respectively.
Statistical analysis
We conducted confirmatory factor analysis (CFA) using the statistical package LISREL 8.7 (Jöreskog and Sörbom, Reference Jöreskog and Sörbom2006). All analyses were conducted using asymptotic covariance matrices and robust maximum-likelihood estimation methods because the distributions of some model variables deviated from normality.
We tested four possible factor models underlying items of the STICSA: (1) one-factor model in which all (both state and trait, as well as both cognitive and somatic) items were forced to load on a single higher order factor (Model 1); (2) two-factor model in which items across the state and trait scales loaded on either cognitive or somatic factors (Model 2); (3) two-factor model in which items loaded on either state or trait factors (Model 3); and (4) four-factor model in which State-Cognitive (STICSA-SC), State-Somatic (STICSA-SS), Trait-Cognitive (STICSA-TC), and Trait-Somatic factors (STICSA-TS) were directly modeled (Model 4).
The fit of each model was assessed by means of the following goodness-of-fit indices: (1) the Satorra–Bentler chi-squared (SB χ2) statistic and its degree of freedom; (2) the root mean square error of approximation (RMSEA) and its 90% confidence interval (90% CI); (3) the Non-Normed Fit Index (NNFI); (4) the comparative fit index (CFI); and (5) the standardized root mean square residuals (SRMR). In the present study, we considered NNFI, and CFI values of 0.90 and above to reflect adequate fit and values of 0.95 and above to indicate excellent fit. RMSEA and SRMR values of 0.08 or less were considered to reflect adequate fit; values of 0.06 or less were considered to reflect good fit (Browne and Cudek, Reference Browne, Cudek and Long1993; Hu and Bentler, Reference Hu and Bentler1999).
To investigate the psychometric properties of the STICSA, we assessed internal consistency of its scales using Cronbach's α indices. The concurrent and discriminant validity of the STICSA and its factor subscales were examined through Pearson's correlation coefficients. We compared the pairs of correlation coefficients in the analysis of discriminant validity using the approach recommended by Meng et al. (Reference Meng, Rosenthal and Rubin1992). A multivariate general linear model (GLM) was used to assess the effect of age (middle-aged adults vs. older adults) and sex (males vs. females) on STICSA scores. Wilks’ lambda (λ) and the partial eta squared (η2) are reported as measures of multivariate effect and effect size, respectively.
Results
Confirmatory factor analysis
Goodness-of-fit statistics for all tested structural models are presented in Table 2. The SB χ2 goodness-of-fit tests were significant for each of the CFA models (SB χ2 ranged from 3,992.55, df = 819, to 2,713.13, df = 813, p < 0.001). When we investigated the nested models with scaled difference in χ2 tests (Satorra and Bentler, Reference Satorra, Bentler, von Eye and Clogg1994; Crawford and Henry, Reference Crawford and Henry2003; Brown, Reference Brown2006), Model 4 demonstrated significantly better fit compared to Model 1 [Δχ2 (6, N = 396) = 935.95, p < 0.001], and both of the two-factor models [Model 2, Δχ2 (5, N = 396) = 130.28, and Model 3, Δχ2 (5, N = 396) = 823.03 (p < 0.001)].
Fit indices for the structural models (N = 396)

*p < 0.001.
Note. SB χ2 = satorra and bentler chi-squared test; df = degrees of freedom, NNFI = Non-Normed fit index; CFI = comparative fit index; SRMR = standardized root mean square residual; RMSEA = root-mean-square error of approximation; 90% CI = 90% confidence interval of RMSEA.
Since the utility of the χ 2 goodness-of-fit test has been questioned, probably due to its sensitivity to large sample sizes (Hu and Bentler, Reference Hu and Bentler1998; Kahn, Reference Kahn2006; Kline, Reference Kline2011), we calculated additional fit indices to support the fit of the models. According to other goodness-of-fit indices, Model 1 and Model 3 generally provided inadequate fit to the observed response data. In contrast, Model 4 yielded adequate-to-excellent fit across all fit indices. A similar pattern was found for Model 2, which demonstrated adequate fit to the data. Taken together, these results support both the state-trait and cognitive-somatic distinctions implied by the STICSA item pool and instruction sets. Further, the four-factor model seemed to best fit the data, showing the lowest RMSEA value (RMSEA = 0.077; 90% CI: 0.074–0.080), closest to the criterion value of best fit of 0.05 (Schermelleh-Engel et al., Reference Schermelleh-Engel, Moosbrugger and Müller2003).
Reliability and validity analysis
All subscales of the STICSA had high internal consistency, with Cronbach's α coefficients of 0.87 and 0.86, respectively for the STICSA-TS and the STICSA-TC, and 0.90 and 0.86, respectively for the STICSA-SS and the STICSA-SC. Cronbach's α coefficients were equal to 0.92 and 0.91, respectively for the STICSA-S and the STICSA-T. In addition, the average inter-item correlations ranged between 0.38 (for the STICSA-TC and the STICSA-TS) and 0.45 (for the STICSA-SS), with STICSA-SC exhibiting an average inter-item correlation of 0.39.
Concurrent and discriminant validity of the STICSA
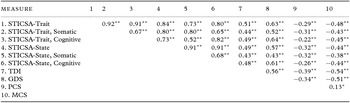
To investigate the concurrent and discriminant validity of the STICSA, we computed correlations among the STICSA dimensions and with measures of depression and health-related quality of life (see Table 3).
Correlations among the STICSA, measures of depression, and the SF-12 composite scores (N = 396)

**p < 0.01; *p < 0.05.
Note. STICSA = state-trait inventory for cognitive and somatic anxiety; TDI = teate depression inventory; GDS = geriatric depression scale; PCS = SF-12 physical composite score; MCS = SF-12 mental composite score.
Relationships between cognitive and somatic anxiety, and depression
Compared to the somatic scale, the STICSA cognitive scale displayed a significantly higher correlation with the GDS both for the trait scale (Z = 3.77, p < 0.01) and for the state scale (Z = 5.41, p < 0.01). No significant differences were detected in the magnitude of the correlations among the STICSA cognitive scale with the TDI compared to the somatic scale, for state (Z = –1.42, p = 0.08) or trait anxiety (Z = –1.44, p = 0.08).
Relationships between cognitive and somatic anxiety, and physical well-being
The STICSA somatic scale displayed a significantly higher correlation with the SF-12 PCS compared with the cognitive scale for trait anxiety (Z = 3.77; p < 0.01), but not for state anxiety (Z = 1.57; p = 0.06).
Relationship of cognitive and somatic anxiety relative to relationship among
Depression measures
All anxiety dimension correlations with depression were weaker than the correlation between measures of depression (r = 0.56), with the sole exception of the cognitive dimension of the STICSA and the GDS.
Relationship of anxiety dimensions with well-being
The correlations among the STICSA subscales and the SF-12 composite scores were all negative, indicating that more severe anxiety was associated with lower quality of life. Comparison of the STICSA with the mental and physical health subscales of the SF-12 revealed that STICSA dimensions/subscales were significantly more correlated with the SF-12 MCS than with the SF-12 PCS (Z between −2.02 [p < 0.05] and −2.99 [p < 0.001]), except for the STICSA-SS (Z = −0.99; p = 0.16), suggesting the STICSA measures anxiety independently from physical health (Table 3).
Differences between sex and age classes
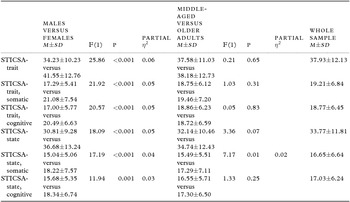
Descriptive statistics for the STICSA by sex (males vs. females) and age group (middle-aged vs. older adults) are listed in Table 4. Multivariate analyses revealed a significant effect of age (Wilks’ λ = 0.97, F(5, 384) = 3.76, p < 0.05, partial η2 = 0.05) and sex (Wilks’ λ = 0.93, F(5, 384) = 5.74, p < 0.01, partial η2 = 0.07), but no interaction (Wilks’ λ = 0.98, F(5, 384) = 1.93, p = 0.09, partial η2 = 0.02). Men and women differed on all the dimensions of the STICSA (p < 0.001), with women reporting higher scores (partial η2 ranging from 0.03 to 0.05). Age groups differed only on the STICSA-SS, with older adults reporting higher scores than middle-aged adults (partial η2 = 0.02).
Descriptive statistics broken down by sex (men vs. women) and age class (middle-aged vs. older adults)

Multivariate statistics: Sex: Wilks’ λ = 0.93; F(5;384) = 5.74; p < 0.01; partial η2 = 0.07. Age: Wilks’ λ = 0.95; F(5;384) = 3.76; p < 0.05; partial η2 = 0.05. Sex * Age: Wilks’ λ = 0.98; F(5;384) = 1.93; p = 0.09; partial η2 = 0.02.
Discussion
Some anxiety measures have acceptable psychometric evidence for measuring anxiety in older adults, although the majority may not necessarily differentiate from depression sufficiently well (Dennis et al., Reference Dennis, Boddington and Funnell2007; Therrien and Hunsley, Reference Therrien and Hunsley2012). Given the recent establishment of the STICSA as a promising instrument in the assessment of anxiety for its ability to differentiate anxiety from depression, our general aim was to investigate whether it showed psychometric properties sufficient to justify its use in older adults.
In our sample of middle-aged and older adults, the original four-factor structure yielded adequate-to-excellent fit according to established standards in the field (Hu and Bentler, Reference Hu and Bentler1999). These findings provide support for the distinctions between state and trait forms of anxiety and between cognitive and somatic anxiety, extending previous findings in younger samples (Gros et al., Reference Gros, Antony, Simms and McCabe2007; Ree et al., Reference Ree, French, Macleod and Locke2008; Gros et al., Reference Gros, Simms and Antony2010; Van Dam et al., Reference Van Dam, Gros, Earleywine and Antony2013). All dimensions of the STICSA have been found to have excellent internal consistency as reported in previous psychometric analyses carried out in younger samples (Gros et al., Reference Gros, Antony, Simms and McCabe2007; Ree et al., Reference Ree, French, Macleod and Locke2008). As regards the investigation on the concurrent and discriminant validity, according to one first hypothesis, the magnitude of the correlations between the cognitive and somatic subscales of the STICSA would have to be higher than either subscales’ correlation with two depression measures, the GDS and the TDI. Previous work has suggested that the STICSA shows promise discriminating anxiety from depression (Gros et al., Reference Gros, Antony, Simms and McCabe2007). In the present study, the correlation among depression measures was higher than correlations between anxiety and depression with the exception of cognitive anxiety (trait and state) and overall trait anxiety with the GDS. Not surprisingly, cognitive anxiety may be associated with measures of depression more strongly than somatic anxiety. While items derived from cognitive dimensions of anxiety (e.g. “I think the worst will happen,” “I feel agonized over my problems”) likely overlap with aspects also common in depressive states, items derived from somatic dimensions of anxiety (e.g. “My heart beats fast,” “My muscles are tense”) likely tap the presence of physiological hyperarousal, which is more uniquely characteristic of anxiety. Despite some overlap with depressive symptoms, cognitive anxiety is an important component of many anxiety disorders (Van Dam et al., Reference Van Dam, Gros, Earleywine and Antony2013). Correlations between cognitive anxiety and the GDS were above 0.60 (0.61–0.64), and they were higher than the correlation between the two measures of depression (0.56). However, these effect sizes were comparable to those reported by Gros et al. (Reference Gros, Antony, Simms and McCabe2007), who obtained correlations of 0.59–0.64 between cognitive anxiety and depression, as measured with the Depression Anxiety Stress scales (DASS; Lovibond and Lovibond, Reference Lovibond and Lovibond1995). While these figures denote a partially limited ability to discriminate cognitive anxiety symptoms from depression, Gros et al. (Reference Gros, Antony, Simms and McCabe2007) reported correlations even higher between the STAI and depression (ranging between 0.64 and 0.68).
Also, the elevated correlation between the GDS and the cognitive scales of the STICSA could be due to the fact that the GDS only measures cognitive and affective aspects of depression (not somatic/physical).
According to our second hypothesis, the STICSA would have to be more strongly correlated with mental health functioning than physical health functioning, as measured with the SF-12. We found trait somatic anxiety was more correlated with mental health functioning than with physical health functioning, as assessed by the SF-12. This finding supports the hypothesis that the STICSA might assess anxiety at least partially independently from the presence of physical health limitations, despite a heavy reliance on somatic items. Consistent with this pattern of correlations, the multivariate GLM indicated a partial independence of the STICSA from age: although older adults are affected more frequently by medical conditions, multivariate analyses indicated a significant, but weak effect of age, with middle-aged adults and older adults showing meaningful differences only for state somatic anxiety. These results are important because the detection of anxiety in older adults is generally complicated by the high frequency of medical disorders present in this age group. Several studies suggest that between 80% and 86% of adults aged 65 years and older have at least one significant medical condition (Dawson et al., Reference Dawson, Kline, Wiancko and Wells1986; Naughton et al., Reference Naughton, Feely and Bennett2007). Since somatic anxiety may be misidentified as a physical symptom and/or may be resultant from a medical condition, appropriate identification of somatic anxiety in the elderly is critical (Therrien and Hunsley, Reference Therrien and Hunsley2012).
As anxiety appears to have meaningful differences in demographics, between-group analyses for sex were conducted to explore the extent of these differences. Sex had a significant impact on all dimensions of the STICSA in the present sample, with effect sizes greater for trait anxiety than for state anxiety. Compared with males, females reported higher scores on all dimensions of the STICSA, consistent with increased risk among women for an anxiety disorder in older age (Wolitzky-Taylor et al., Reference Wolitzky-Taylor, Castriotta, Lenze, Stanley and Craske2010), as well as with higher scores on the STAI trait subscale among older women relative to male peers (Bergua et al., Reference Bergua2012). Higher STICSA scores for females, compared with males, have also been reported in younger samples (Van Dam et al., Reference Van Dam, Gros, Earleywine and Antony2013).
Limitations and strengths
Several limitations of this study should be addressed in future studies. First, we did not screen the sample for the presence of anxiety disorders thorough diagnostic interviews, and did not assess the ability of the STICSA to discriminate between individuals with anxiety disorders and healthy controls. Second, we did not assess the validity of the STICSA relative to the STAI or other existing measures of anxiety (especially those specifically devised to be used with older adults) (e.g. the Geriatric Mental State Examination; Copeland et al., Reference Copeland, Kelleher, Duckworth and Smith1976). Third, we did not assess whether scores on the STICSA were affected by social desirability or the presence of memory impairment and cognitive deficits.
Despite these limitations, our study has several strengths: it is the first study investigating the psychometric properties of the STICSA in a sample of older adults and the first study evaluating the Italian version of this measure, to our knowledge. Furthermore, we also administered to our sample the SF-12, which shed light on the ability of the STICSA in detecting anxiety symptoms while simultaneously assessing for the presence of physical health symptoms.
Conclusion
In conclusion, the STICSA is a promising measure of general anxiety, which provides a more specific assessment of cognitive and somatic anxiety symptoms among older adults. Together, the present findings support its reliability and validity as a measure of state and trait anxiety in a geriatric population. Nevertheless, our data suggest that the STICSA may have some limitations in discriminating between anxiety and depression. Further studies to investigate its properties relative to other geriatric anxiety measures are necessary. The STICSA may be particularly attractive for researchers and clinicians working with older adults because of its relatively weak association with physical health.
Conflict of interest
None.
Description of authors’ roles
M. Balsamo and M. Innamorati contributed equally to the design of the study and supervision of data collection. M. Balsamo, M. Innamorati, and N.T. Van Dam all contributed to drafting of the manuscript. M. Balsamo, M. Innamorati, and L. Carlucci performed statistical analyses. All authors have contributed to and have approved the final manuscript.