INTRODUCTION
Due to the difficulty, time requirement and cost of wet chemistry analytical methods, leaf chlorophyll meters have become widely used by scientists and agronomists since their introduction to the market in the 1990s. These instruments are employed for several purposes, such as for monitoring the nutritional status of plants (Wood et al. Reference Wood, Reeves, Duffield and Edmisten1992; Cartelat et al. Reference Cartelat, Cerovic, Goulas, Meyer, Lelarge, Prioul, Barbottin, Jeuffroy, Gate, Agati and Moya2005; Yu et al. Reference Yu, Wu and Wang2010), assessing the presence of pathogens (Carretero et al. Reference Carretero, Bancal and Miralles2011) or even predicting the final crop yield (Arregui et al. Reference Arregui, Lasa, Lafarga, Irañeta, Baroja and Quemada2006; Tremblay et al. Reference Tremblay, Wang and Bélec2009). Many of these applications are based on the assumption of a strong relationship between leaf chlorophyll and nitrogen (N) (Ercoli et al. Reference Ercoli, Mariotti, Masoni and Massantini1993), although this is not always the case, since many factors other than N may influence chlorophyll concentration such as water status, variety, etc. (Alchanatis et al. Reference Alchanatis, Schmilovitch and Meron2005; Shaver et al. Reference Shaver, Khosla and Westfall2011). Several models have been introduced into the market since the appearance of the Minolta SPAD-501, subsequently replaced by the SPAD-502 (both Konica-Minolta, Tokyo, Japan). They include the Hydro N-tester (Konica-Minolta, Tokyo, Japan), CCM-200 (Opti-Sciences, Hudson, NH), CL-01 (Hansatech, King's Lynn, UK), TYS-3N (Zhejiang Top instrument Co., China) and Dualex 4 Scientific (FORCE-A, Orsay, France). The Minolta SPAD-502 is still the most widely used, as suggested by a search of the SCOPUS database (Elsevier, Netherlands), reporting about 1000 hits for SPAD, 26 for Dualex, 10 for CCM-200 and 6 for CL-01.
The SPAD-502 (hereafter SPAD) has two light-emitting diodes active at 650 and 940 nm, which emit red and infrared light onto the upper surface of a leaf. The light that passes through the leaf strikes a receptor, which provides a measurement of leaf transmittance at 650 nm (affected by leaf chlorophyll) and at 940 nm (reference not sensitive to chlorophyll).
The Dualex 4 Scientific (Dualex hereafter) is comparatively innovative in respect to other meters, since it provides not only an estimate of leaf chlorophyll, but also of the concentration of flavonoids in the leaf epidermis. Chlorophyll a+b is estimated, similarly to SPAD, from measurements of transmittance, although in the near infrared (NIR) at 710 and 850 nm. Flavonoids are determined by comparing the chlorophyll fluorescence induced by red and ultra-violet light, since the latter waveband is mainly absorbed by flavonoids in the leaf epidermis. It has been shown that the ratio between chlorophyll and flavonoids, called the nitrogen balance index (NBI) in the instrument, is a useful indicator of plant N status (Cartelat et al. Reference Cartelat, Cerovic, Goulas, Meyer, Lelarge, Prioul, Barbottin, Jeuffroy, Gate, Agati and Moya2005). The present work does not consider flavonoid estimation and concentrates only on the chlorophyll index provided by Dualex in order to compare it with SPAD and spectral reflectance measurements.
In most circumstances the knowledge of a relative indication of chlorophyll concentration, such as that provided by SPAD or Dualex, is sufficient, although in other instances the estimation of absolute leaf chlorophyll values is needed, for example in more physiologically based studies, or in the context of validation of remote sensing data. In such cases a calibration between chlorophyll meter values and actual chlorophyll concentration is mandatory (Yu et al. Reference Yu, Wu and Wang2010; Cerovic et al. Reference Cerovic, Masdoumier, Ghozlen and Latouche2012).
Calibration is affected by different issues, including chloroplast movement in response to light and temperature (Nauš et al. Reference Nauš, Prokopová, Rebíček and Spundová2010), extraction method, solvents used and even the characteristics of the spectrophotometer (Wellburn Reference Wellburn1994; Coste et al. Reference Coste, Baraloto, Leroy, Marcon, Renaud, Richardson, Roggy, Schimann, Uddling and Hérault2010).
Ritchie (Reference Ritchie2006) reported the advantages and disadvantages of different solvents ordinarily used for chlorophyll extraction. Ethanol is a much safer solvent than the more commonly used acetone or methanol (Wright et al. Reference Wright, Jeffrey, Mantoura, Jeffrey, Mantoura and Wright1997). However, there are considerable practical, safety and economic advantages in using ethanol as the solvent for chlorophyll extraction and assay (Ritchie Reference Ritchie2006); therefore, it was decided to employ ethanol in the present study. Very few chlorophyll meter calibrations are available in which extraction by ethanol was performed (Coste et al. Reference Coste, Baraloto, Leroy, Marcon, Renaud, Richardson, Roggy, Schimann, Uddling and Hérault2010; Cerovic et al. Reference Cerovic, Masdoumier, Ghozlen and Latouche2012), so comparison with calibration curves provided by previous studies may not be possible.
Additionally, to the current authors’ knowledge, only one paper (Cerovic et al. Reference Cerovic, Masdoumier, Ghozlen and Latouche2012) has been published reporting calibration equations for the Dualex. Because of the increasing use of the Dualex (Coste et al. Reference Coste, Baraloto, Leroy, Marcon, Renaud, Richardson, Roggy, Schimann, Uddling and Hérault2010 and references therein) there is an urgent need for independent evaluation and calibration studies as well as comparisons with more widely used instruments such as the SPAD, and to other chlorophyll estimation methods such as those based on leaf reflectance measurements. The latter could become increasingly accessible, due to developments of less expensive and smaller scanning instruments, and are typically used in the context of remote sensing for the purpose of estimating leaf chlorophyll, with the eventual aim of up-scaling to the whole canopy.
A comparison of the accuracy of reflectance-based measurements relative to that provided by the handheld chlorophyll meters should take into account the difference between leaf reflectance and transmittance measurements, respectively, provided by these instruments. Additionally, the indices provided by the chlorophyll meters are calculated from equations containing specific coefficients withheld by the manufacturers (Markwell et al. Reference Markwell, Osterman and Mitchell1995; Coste et al. Reference Coste, Baraloto, Leroy, Marcon, Renaud, Richardson, Roggy, Schimann, Uddling and Hérault2010; Cerovic et al. Reference Cerovic, Masdoumier, Ghozlen and Latouche2012). For example, the measured chlorophyll value M provided by the Dualex is computed as:
 $$M = k[(t_{850} /t_{710} )-1] + c$$
and by the SPAD as:
 $$M = k[\log (t_{940} )-\log (t_{650} )] + c$$
where k and c are withheld coefficients and t 850, t 710, t 940 and t 650 are leaf transmittance values at the respective wavelengths (subscripts) obtained by the ratio between a measurement carried out with a leaf between the light source (light-emitting diode) and the detector, and one without the leaf.
The object of the present work was to evaluate the accuracy of SPAD and Dualex meters as compared to leaf spectral reflectance information, either in the form of indices, or exploiting the full leaf spectral information, for quantitative leaf chlorophyll estimation. In addition to the use of an experimental dataset collected for such purpose, a physically based leaf reflectance and transmittance model, PROSPECT, was employed to assess theoretical differences among the meters and spectral reflectance measurements.
MATERIALS AND METHODS
Plant material and measurements
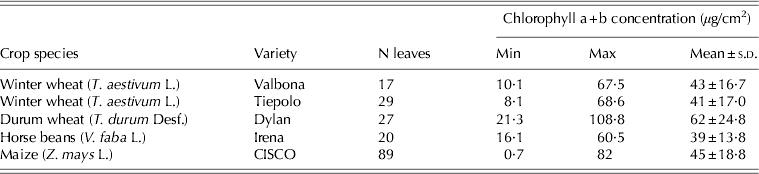
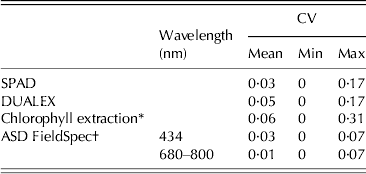
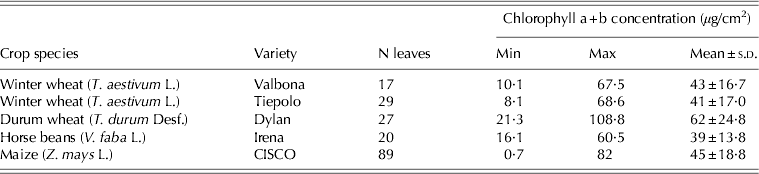
Leaf samplings and optical measurements were carried out in the field at the Maccarese S.p.A. farm (41°52′N, 12°13′E, 3 m a.s.l.) near Rome (Italy) on 4 May 2012 and on 24 September 2012, collecting a total of 182 leaves of different crop species and varieties (Table 1). The leaves were selected from different plants in each field, irrespective of their position on the plant, in order to sample a wide range of chlorophyll concentrations by visual assessment of leaf colour. Leaves were detached from the plants and optical measurements were immediately carried out at the side of the field. On the measurement dates, durum and winter wheat were at around the booting stage (BBCH code 41; Lancashire et al. Reference Lancashire, Bleiholder, van den Boom, Langeluddeke, Stauss, Weber and Witzenberger1991), faba bean at the end of flowering (BBCH code 69; Lancashire et al. Reference Lancashire, Bleiholder, van den Boom, Langeluddeke, Stauss, Weber and Witzenberger1991) and maize at the early milk stage (BBCH code 73; Lancashire et al. Reference Lancashire, Bleiholder, van den Boom, Langeluddeke, Stauss, Weber and Witzenberger1991). For each leaf, measurements were acquired on a small area (c. 1 cm2) on the central part of the adaxial surface, taking three sequential repeat readings each, at the same spot, using the Dualex, SPAD (for maize samples only) and Analytical Spectral Devices FieldSpec Fr Pro spectroradiometer (ASD Inc., Boulder, CO, USA). This last covers a spectral range of 350–2500 nm and was equipped with the ASD high-intensity contact probe having a 100 W quartz-halogen lamp and a spot size of reflectance measurement of c. 10 mm. The contact probe has a fixed spatial relationship between the detector fibre optic cable and the light source, allowing the measurement of a directional radiance value. Thus it provides a sample of the bidirectional reflectance factor, unlike integrating spheres that allow the measurements of reflectance over the entire hemisphere. Radiance measurements acquired with the contact probe using an integration time of 50 ms were converted into absolute reflectance by using a NIST calibrated panel (Spectralon– reference standard, S/N 5221 – Sphere Optics Inc., Durham, NH USA) to derive absolute reflectance spectra. White and dark reference data were obtained before each leaf measurement. Finally, the average of the three values acquired by the Dualex, SPAD or FieldSpec was used and the coefficients of variation among the three repeat measurements were employed to assess the technical error of the measurements (Table 2).
Characteristics of experimental dataset acquired during the present study
Statistics of the coefficients of variation (CV) observed for each type of optical reading and chlorophyll extractions from three repeat measurements performed for each leaf
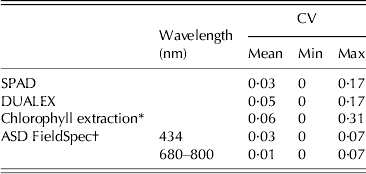
* Repeat spectrophotometer readings of the same extract.
† The CVs are computed only for the wavebands used in the calculations of the spectral indices.
The leaf area that included the three repeat measurements per leaf was then punched, collecting two adjacent leaf disks with an area of 0·6 cm2, which were immediately wrapped in aluminium foil, refrigerated, taken to the laboratory and then stored at −80 °C until analysis. Leaf disks were then thawed, weighed and chlorophyll extraction was carried out in the dark by grinding with sand glass and a glass stick using 95% ethanol as a solvent, leaving to extract for 1 h. Samples were then centrifuged at room temperature at 13 000 rpm, the supernatant collected and absorbance at 664·2 and 648·6 nm was measured with a Helios alpha UV/VIS spectrophotometer (Thermo Scientific) (Minocha et al. Reference Minocha, Martinez, Lyons and Long2009). The equation provided by Lichtenthaler (Reference Lichtenthaler1987) was used to determine chlorophyll a+b:
 $$C_{{\rm a} + {\rm b}} = 5 {\cdot} 24A_{664 {\cdot} 2} + 22 {\cdot} 24A_{648 {\cdot} 6} $$
where C a+b is the chlorophyll a+b concentration (μg/ml), and A 664·2 and A 648·6 are absorbance values measured at the specified wavelengths. From each chlorophyll extraction by ethanol three subsamples were obtained and the average values of the three spectrophotometer readings were then employed (Table 2).
Spectral indices and partial least squares regression
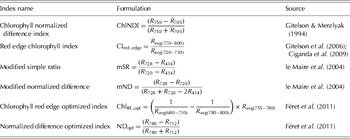
The reflectance spectra acquired on the current dataset were used to assess the performance of a selected number of spectral reflectance indices. A very large number of indices have been proposed specifically for the estimation of the chlorophyll concentration, both at the leaf and at the canopy scale, as reviewed for example by Haboudane et al. (Reference Haboudane, Miller, Tremblay, Zarco-Tejada and Dextraze2002), Bannari et al. (Reference Bannari, Khurshidt, Staenz and Schwarz2007) and Wu et al. (Reference Wu, Niu, Tang and Huang2008), so that the choice of the indices to test is rather difficult. It was decided to select only those indices that had been calibrated and validated over extensive datasets and had been reported in the literature to be particularly successful for the estimation of chlorophyll at the leaf scale (Table 3).
Spectral reflectance indices used in the present work

The performance of these indices was compared to that obtained by SPAD and DUALEX using direct measurements and model simulations (see the following section). The performance of calibration equations proposed in the literature was also evaluated and reported as having general validity, having been developed on extensive datasets. In particular, the equations tested were those proposed by: Cerovic et al. (Reference Cerovic, Masdoumier, Ghozlen and Latouche2012) for the estimation of chlorophyll from Dualex and SPAD measurements; Ciganda et al. (Reference Ciganda, Gitelson and Schepers2009) for the estimation of chlorophyll from the CIred_edge index; Richardson et al. (Reference Richardson, Duigan and Berlyn2002) for the estimation of chlorophyll from the ChlNDI index; Féret et al. (Reference Féret, François, Gitelson, Asner, Barry, Panigada, Richardson and Jacquemoud2011) for the estimation of chlorophyll from the NDopt and ChlRE_opt indices.
Additionally, the partial least square regression (PLSR) technique was employed to test the usefulness of exploiting the full spectral information. This multivariate calibration technique allows the information from the whole spectrum to be synthesized into a restricted number of factors having the best linear relationship with the variable being estimated (Mevik et al. Reference Mevik, Wehrens and Liland2013). Leave-one-out cross-validation was employed to select the number of factors for the calibration models. The number of PLSR factors was chosen by observing the RMSE and the Akaike Information Criterion (AIC) trends and by selecting the number of factors that minimized the RMSE but avoided overfitting. Partial least squares regression was carried out using the pls package (Mevik & Wehrens Reference Mevik and Wehrens2007; Mevik et al. Reference Mevik, Wehrens and Liland2013) in R (R Development Core Team 2011).
PROSPECT-4 model synthetic database
In order to compare spectral information based on reflectance or transmittance excluding experimental error influences, simulations by the PROSPECT model (Jacquemoud & Baret Reference Jacquemoud and Baret1990) were used. Although the use of such a model entails the introduction of additional uncertainties, deriving from model assumptions and the difference between what is measured and what is simulated, especially in terms of view angle geometry, such an exercise can provide useful information by allowing a comparison of reflectance and transmittance indices on an equal basis. In the last 20 years, PROSPECT has become the reference model to simulate leaf reflectance and transmittance in the optical domain (Jacquemoud et al. Reference Jacquemoud, Verhoef, Baret, Bacour, Zarco-Tejada, Asner, François and Ustin2009), using as inputs leaf biophysical and biochemical properties. Several versions of the model have been released since its first appearance in 1990, corresponding to the introduction of additional leaf constituents, such as cellulose and lignin (Fourty et al. Reference Fourty, Baret, Jacquemoud, Schmuck and Verdebout1996; Jacquemoud et al. Reference Jacquemoud, Ustin, Verdebout, Schmuck, Andreoli and Hosgood1996, Reference Jacquemoud, Verhoef, Baret, Bacour, Zarco-Tejada, Asner, François and Ustin2009; Baret & Fourty Reference Baret and Fourty1997), increased spectral resolution and range (le Maire et al. Reference le Maire, François and Dufrêne2004; Féret et al. Reference Féret, François, Asner, Gitelson, Martin, Bidel, Ustin, le Maire and Jacquemoud2008) and account of leaf surface directional reflectance (Bousquet et al. Reference Bousquet, Lachérade, Jacquemoud and Moya2005) and chlorophyll a fluorescence emission (Pedrós et al. Reference Pedrós, Goulas, Jacquemoud, Louis and Moya2010).
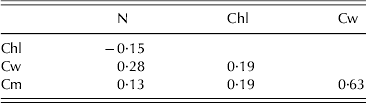
In the present work, PROSPECT-4 (Féret et al. Reference Féret, François, Asner, Gitelson, Martin, Bidel, Ustin, le Maire and Jacquemoud2008) was used to build a synthetic database through the simulation of reflectance and transmittance spectra corresponding to a wide range of leaf properties (Table 4). PROSPECT-4 simulates leaf directional–hemispherical reflectance and transmittance from 400 to 2500 nm with four input variables: chlorophyll, dry weight per leaf surface area (Cm), equivalent water thickness (Cw) and the leaf structure parameter N (Féret et al. Reference Féret, François, Asner, Gitelson, Martin, Bidel, Ustin, le Maire and Jacquemoud2008). Féret et al. (Reference Féret, François, Gitelson, Asner, Barry, Panigada, Richardson and Jacquemoud2011) have shown that it is quite important to simulate leaves having a realistic combination of biophysical and biochemical properties. A latin hypercube sampling (McKay et al. Reference McKay, Beckman and Conover1979), i.e. a stratified-random procedure, was used to provide an efficient way of sampling input variable from their frequency distributions. A multivariate normal distribution of the randomly selected PROSPECT input variables was employed, with the means and sd reported in Table 4. Latin hypercube sampling is based on the assumption that the variables are independent of each other, but in reality some input variables might be correlated (Féret et al. Reference Féret, François, Gitelson, Asner, Barry, Panigada, Richardson and Jacquemoud2011). Random pairing of correlated variables could result in impossible combinations. Hence, the method proposed by Iman & Conover (Reference Iman and Conover1982) was adopted in the present work for taking into account correlations among the variables, by restricting the way the variables are paired based on the rank correlation of some target values. The method is based on the Cholesky decomposition of the correlation matrix (Minasny & McBratney Reference Minasny and McBratney2002). The correlation matrix of the variables reported by Féret et al. (Reference Féret, François, Gitelson, Asner, Barry, Panigada, Richardson and Jacquemoud2011), obtained from very extensive databases of leaf properties measured in several plant species (Table 5), was used. A synthetic database containing 1296 PROSPECT-4 simulations was generated.
Statistical distributions used for the multivariate normal distribution extraction of inputs for the PROSPECT-4 simulations

N, leaf structure parameter; Chl, chlorophyll content; Cw, equivalent water thickness; Cm, dry weight per leaf area.
Correlation matrix (from Féret et al. Reference Féret, François, Gitelson, Asner, Barry, Panigada, Richardson and Jacquemoud2011) employed in the procedure for the extraction of inputs for the PROSPECT-4 simulations
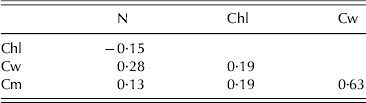
N, leaf structure parameter; Chl, chlorophyll content; Cw, equivalent water thickness; Cm, dry weight per leaf area.
Additionally the LOPEX93 database was employed (Hosgood et al. Reference Hosgood, Jacquemoud, Andreoli, Verdebout, Pedrini and Schmuck1994) to determine the relationships between leaf reflectance and transmittance at the wavelengths employed by SPAD and DUALEX. LOPEX93 includes 1938 measurements in which leaf reflectance and for some cases also transmittance, were acquired for 120 plant species, on fresh or dry leaves or stacks of leaves. For the current purposes, only those records (N=85) for which both reflectance and transmittance measurements had been carried out on single fresh leaves were extracted.
The relationships between leaf reflectance and transmittance measured at 650, 710, 840 and 950 nm were then determined using linear regression analysis. These relationships were used to convert reflectance measurements acquired on the current dataset into transmittance values for the wavelengths used by SPAD and Dualex. This allowed estimation of the parameters in Eqns (1) and (2) by numerical minimization on the measured SPAD and Dualex values, respectively. The simplex method (Lagarias et al. Reference Lagarias, Reeds, Wright and Wright1999) was used for minimization, adopting 100 replicates each time with randomly drawn initial parameter values.
Data analysis
Linear and quadratic regression models were computed for all the types of data (experimental and synthetic), which were fitted using the least squares approach. The performance of each method was assessed in terms of RMSE of calibration expressed in μg/cm2 (RMSE, Eqn (4)) and the ratio of performance to deviation (RPD, Eqn (5). The equations used were
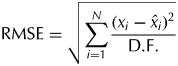 $${\rm RMSE} = \sqrt {\sum\limits_{i = 1}^N {\displaystyle{{(x_i - \hat x_i )^2} \over {{\rm D}{\rm. F}.}}}} $$
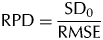 $${\rm RPD} = \displaystyle{{{\rm SD}_{\rm 0}} \over {{\rm RMSE}}}$$
where x i is a predicted value,  $\hat x_i $ a measured value, d.f. are the degrees of freedom and SD0 is the sd of the measured values. The d.f. term in Eqn (4) was computed as N−2 in the case of linear models and as N−3 for quadratic models, where N is the number of data pairs (couples of estimated and measured values). In the case of PLSR, d.f. is computed as N−Fc−1 where Fc is the number of factors used. Root mean square error is widely used to quantify the agreement of the values estimated from a model to the observed data. The RPD is a dimensionless statistic that, taking into account the sd of the observed data, allows a more effective estimation of model accuracy to be obtained. It is the ratio of the sd of the samples to the standard error in prediction (RMSE); therefore, if the error in estimation is large compared with the sd, then the model is not performing well. The ratio is widely used in the assessment of the model predictive ability in spectroscopy studies (Minasny & McBratney Reference Minasny and McBratney2008). It is generally assumed that models having RPD>2 have a high prediction capability, models with RPD between 2 and 1·4 are intermediate and models with RPD<1·4 have no prediction ability (Chang et al. Reference Chang, Laird, Mausbach and Hurburgh2001; Gomez et al. Reference Gomez, Viscarra Rossel and McBratney2008). Additionally the relative RMSE (RRMSE) was computed, expressing the estimation accuracy (Richardson et al. Reference Richardson, Duigan and Berlyn2002), as the ratio between the RMSE and the mean of the measured chlorophyll values. An advantage of the use of RRMSE is that it is independent from the units and values of the measurements, allowing easy relative comparisons. It is therefore used widely for, e.g. the evaluation of crop models (Wallach Reference Wallach, Wallach, Makowski and Jones2006).
All statistical analyses were carried out using the R software (R Development Core Team 2011).
RESULTS
SPAD and DUALEX calibration and inter-comparison
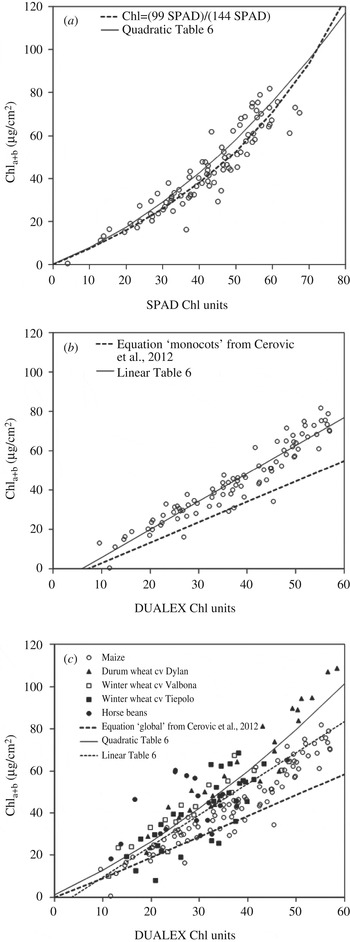
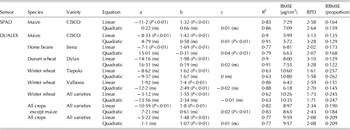
The relationship between measured leaf chlorophyll and the SPAD readings appeared to be curvilinear (Fig. 1(a)), as also found by several other authors (Markwell et al. Reference Markwell, Osterman and Mitchell1995; Coste et al. Reference Coste, Baraloto, Leroy, Marcon, Renaud, Richardson, Roggy, Schimann, Uddling and Hérault2010; Cerovic et al. Reference Cerovic, Masdoumier, Ghozlen and Latouche2012). However, for the current data limited to maize, the use of a second-order polynomial, in the place of a linear equation, provided only a marginal increase of R 2 and the other statistics (Table 6). Moreover, the intercept and the first-order coefficient of the quadratic equation were not significantly different from zero, similar to Castelli et al. (Reference Castelli, Contillo and Miceli1996). Given the large number of calibration studies that have been performed for the SPAD (Markwell et al. Reference Markwell, Osterman and Mitchell1995; Cartelat et al. Reference Cartelat, Cerovic, Goulas, Meyer, Lelarge, Prioul, Barbottin, Jeuffroy, Gate, Agati and Moya2005; Uddling et al. Reference Uddling, Gelang-Alfredsson, Piikki and Pleijel2007), Cerovic et al. (Reference Cerovic, Masdoumier, Ghozlen and Latouche2012) proposed a ‘consensus equation’ in the form of a homographic function:
 $${\rm chlorophyll} = (99 \times {\rm SPAD})/(144-{\rm SPAD})$$
Relationships between index values and leaf chlorophyll for (a) SPAD (only maize), (b) DUALEX (only maize) and (c) DUALEX (all crops). The continuous lines indicate the equations reported in Table 6 (quadratic for (a), linear for (b) and quadratic for (c)) and the dashed lines respectively (a) the SPAD ‘consensus equation’ (Cerovic et al. Reference Cerovic, Masdoumier, Ghozlen and Latouche2012), (b) the Dualex calibration equation for monocots reported in Cerovic et al. (Reference Cerovic, Masdoumier, Ghozlen and Latouche2012), (c) the ‘global’ Dualex calibration equation reported by Cerovic et al. (Reference Cerovic, Masdoumier, Ghozlen and Latouche2012). The dotted line in (c) shows the linear equation of Table 6.

Calibration models for the SPAD and DUALEX sensors (P<0·001 for all models) on the dataset of Table 1. The coefficients correspond to the relationship Chlorophyll=a+b×index for the linear model and Chlorophyll=a+b×index+c×index2 for the quadratic model. Significance of the coefficients is reported

This equation fitted the current data quite well (Fig. 1(a)), providing an RMSE of 7·25 μg/cm2, an RPD of 2·59 and an RRMSE of 0·16, thus confirming its robustness as a general calibration equation.
For the Dualex, a linear equation provided quite a good fit for the dataset of maize leaves (Fig. 1(b)), whereas the quadratic equation only marginally improved the statistics (Table 6). The performance of the Dualex seemed slightly better than that of the SPAD for this dataset. However, the Dualex calibration equations proposed by Cerovic et al. (Reference Cerovic, Masdoumier, Ghozlen and Latouche2012) did not fit the current data very well. This was true for both the version proposed for monocots (Fig. 1(b)) and the ‘general’ version, tested on the dataset including all the species (Fig. 1(c)). The calibration models for the different plant species, obtained using the Dualex, showed notable differences depending on the crop species and variety (Table 6). Durum wheat and maize provided the best results, whereas the winter wheat cvar. Tiepolo yielded less satisfactory results, partly compensated by the other cultivar, Valbona, when all the winter wheat was pooled together.
A quadratic equation provided better RPD and RRMSE than the linear model for the dataset including all the species except maize, whereas the linear model seemed adequate when maize was also included (Fig. 1(c) and Table 6).
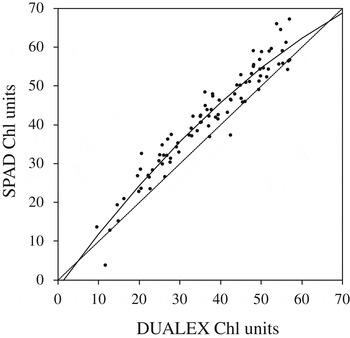
The relationship between SPAD and Dualex readings for maize (Fig. 2) was best fitted by a quadratic polynomial (R 2=0·93, P<0·001), with all coefficients significantly different from zero (P<0·05). The resulting equation, corresponds very well to the shape of the relationship reported in the supporting material by Cerovic et al. (Reference Cerovic, Masdoumier, Ghozlen and Latouche2012):
 $$\eqalign{{\rm SPAD}\hskip-1pt =\hskip-1pt -\hskip-1pt1 {\cdot} 963\hskip-1pt +\hskip-1pt 1 {\cdot} 435\hskip-1pt \times\hskip-1pt {\rm Dualex}\hskip-1pt-\hskip-1pt0 {\cdot} 006\hskip-1pt \times\hskip-1pt {\rm Dualex}^2 $$
Inter-comparison between SPAD and Dualex readings collected on maize leaves. The continuous line is Eqn (7) reported in the text and the dashed line is the 1 : 1 line.

From this relationship it appears that SPAD gives generally higher readings than Dualex, particularly at intermediate chlorophyll concentrations (Fig. 2).
Performance of reflectance indices and PLSR on the experimental database
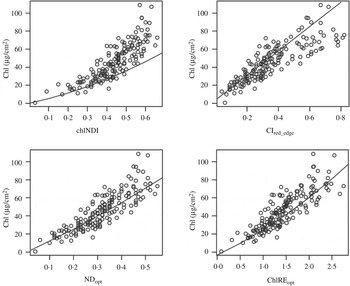
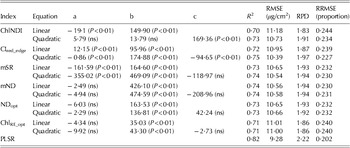
The performance of the spectral reflectance indices listed in Table 3 was evaluated in the same manner as for SPAD and Dualex, although only the results for the set including all the species pooled together are reported here, for brevity. The results (Table 7) show that in general, reflectance indices performed slightly worse than the chlorophyll meters (Table 6), whereas the PLSR technique, in which the information from the whole spectrum was synthesized into 14 factors and explained 0·97 of the chlorophyll total variance, gave the best results. Wavelength loadings in the violet, red and NIR regions provided the highest weights for the 14 factors of the PLSR model. The quadratic relationship obtained by the CIred_edge performed better than the others, almost equalled by the modified simple ratio (mSR) and the modified normalized difference (mND), both proposed by le Maire et al. (Reference le Maire, François and Dufrêne2004) after a process of systematic exploration of all possible combinations of wavelengths. It should be noted that the equations reported in Table 7 are only valid for the specific dataset used. The difficulty in the transferability of empirical predictive models between different sets and studies is illustrated by Fig. 3, in which calibration equations of four indices, from ‘general purpose’ calibration equations proposed in the literature, are plotted over our experimental dataset. A quite good fit occurs for ChlRE_opt and NDopt (Fig. 3), providing an RMSE of 11·2 μg/cm2 for both and an RPD of 1·84 and 1·83, respectively. These two indices were calibrated by Féret et al. (Reference Féret, François, Gitelson, Asner, Barry, Panigada, Richardson and Jacquemoud2011) over a large dataset. Conversely, the ChlNDI equation, calibrated using only paper birch (Betula papyrifera) leaves (Richardson et al. Reference Richardson, Duigan and Berlyn2002), provided an insufficient RPD value (1·01) with the current experimental data. The CIred_edge, although calibrated only on maize leaves by Ciganda et al. (Reference Ciganda, Gitelson and Schepers2009), showed intermediate value of RPD (1·45) and RMSE (14·2 μg/cm2).
Relationships between vegetation indices and leaf chlorophyll proposed as ‘general purpose’ predictive models in the literature. Points are from the current experimental dataset and lines are predictive models derived from the literature. Sources: ChlNDI: Richardson et al. Reference Richardson, Duigan and Berlyn2002; CIred_edge: Ciganda et al. Reference Ciganda, Gitelson and Schepers2009; NDopt: Féret et al. Reference Féret, François, Gitelson, Asner, Barry, Panigada, Richardson and Jacquemoud2011; ChlRE_opt: Féret et al. Reference Féret, François, Gitelson, Asner, Barry, Panigada, Richardson and Jacquemoud2011.

Results of the calibration models for the reflectance indices and the PLSR on the experimental dataset of Table 1. The coefficients correspond to the relationship chlorophyll=a+b×index for the linear model and chlorophyll=a+b×index+c×index2 for the quadratic model. Significance of the coefficients is reported

Comparison of reflectance and transmittance indices by means of a synthetic database
The calibration models reported in the preceding sections are influenced by the experimental error occurring throughout all the process, from leaf sampling to chlorophyll extraction (Table 2), and by the limited size of the experimental dataset. Therefore a theoretical comparison between reflectance (indices) and transmittance (SPAD and Dualex) measurements was attempted using a synthetic database generated by the PROSPECT-4 model. Before realistic SPAD and Dualex pseudo-indices could be calculated from the simulated transmittances, the unknown coefficients of Eqns (1) and (2) had to be estimated. Significant linear relationships (P<0·01) were found between reflectance and transmittance values measured in the LOPEX93 database at all the wavelengths used by SPAD and Dualex, with R 2 values of 0·96 for 650 nm, 0·70 for 940 nm, 0·71 for 850 nm and 0·90 for 710 nm. These relationships were used to estimate transmittance values from the reflectance spectra acquired on the current experimental database. Estimated transmittances were finally employed for the estimation of the coefficients of Eqns (1) and (2) by unconstrained non-linear optimization as detailed in the ‘Materials and Methods’ section. Values of 48·3 and 23·5 for k and −2·22 and 5·33 for c were obtained for SPAD and Dualex, respectively.
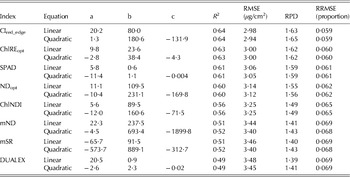
The indices calculated from PROSPECT-4 simulated reflectance and transmittance were related to their corresponding chlorophyll concentration. When tested on the synthetic dataset, all the indices showed intermediate estimation accuracy, according to the RPD thresholds suggested by Chang et al. (Reference Chang, Laird, Mausbach and Hurburgh2001) and reported in the section ‘Data analysis’ in the present paper, with RPD always higher than 1·4 and low RMSE values, ranging from 2·94 to 3·48 μg/cm2 (Table 8). CIred_edge and ChlRE_opt gave the best results, with RPD values respectively of 1·65 (quadratic equation) and 1·62 (both models), and RMSE⩽3 μg/cm2. In most circumstances, the quadratic equations did not provide improvements in the statistics. In general, indices simulating SPAD and Dualex using transmittance data performed similarly to the indices based on reflectance.
Results of the calibration models for the reflectance indices and the PLSR on the synthetic dataset simulated by PROSPECT. The coefficients correspond to the relationship chlorophyll=a+b×index for the linear model and chlorophyll=a+b×index+c×index2 for the quadratic model

(a) CIred _edge , ChlREopt, NDopt, ChlNDI, mND and mSR: spectral reflectance chlorophyll indices as defined in Table 3
DISCUSSION
The use of narrow-band vegetation indices, or full spectral information, to estimate chlorophyll concentration at the leaf scale currently requires the use of expensive and often bulky equipment, usually limiting the ease of data acquisition in the field. Only recently have portable devices been developed, mainly targeted at industrial or food science applications, which allow the acquisition of reflectance values in a wide range of wavelengths, allowing in some cases full spectral scans. The spectral range of most of the instruments on the market does not yet cover all the wavebands useful for chlorophyll concentration estimation. For example, the Phazir 2400 (Polychromix, Inc., Wilmington, MA, USA) is limited to NIR between 1600 and 2400 nm (Sánchez et al. Reference Sánchez, De La Haba, Benítez-López, Fernández-Novales, Garrido-Varo and Pérez-Marín2012), whereas the Fruit Quality Analyser FQA-NIR gun (FANTEC Inc., Japan) covers the region between 600 and 1100 nm with a resolution of 2 nm (Feng et al. Reference Feng, McGlone, Currie, Clark and Jordan2011). In addition to the spectral characteristics of the sensors, the main limitations of these devices are represented by the high cost and the weight: the FQA-NIR gun and Phazir 2400 weigh 750 and 1700 g, respectively (as compared to c. 200 g for DUALEX and SPAD). In this regard, the use of portable chlorophyll meters (SPAD or Dualex) is still considerably more practical, but on the other hand, the estimation accuracy has sometimes been reported to be lower than that obtained from the specific leaf chlorophyll spectral indices (Richardson et al. Reference Richardson, Duigan and Berlyn2002; le Marie et al. Reference le Maire, François and Dufrêne2004).
In the present work, the calibration models obtained on experimental data for SPAD (only on maize) and Dualex (on four crops) showed, in most cases, intermediate or high estimation accuracy, with RPD and RMSE values even slightly better than those achieved using spectral reflectance indices. Only when the full spectral information was exploited by the PLSR technique did the chlorophyll estimation accuracy improve remarkably. The CIred_edge index proved to be the best reflectance index to assess chlorophyll concentration on the current experimental dataset, providing an RMSE of c. 10 μg/cm2 and an RPD of 2. Other researchers obtained similarly good results with CIred_edge, for example Imanishi et al. (Reference Imanishi, Nakayama, Suzuki, Imanishi, Ueda, Morimoto and Yoneda2010) reported an RMSE from 2·5 to 4·1 μg/cm2 using CIred_edge to estimate chlorophyll concentration of two flowering cherries, whereas Ciganda et al. (Reference Ciganda, Gitelson and Schepers2009) achieved an RMSE of 37·5 μg/cm2 for maize. In general, better performances from reflectance indices were obtained from laboratory measurements performed using an integrating sphere (le Maire et al. Reference le Maire, François and Dufrêne2004), i.e. acquiring whole hemisphere reflectance. For example, le Maire et al. (Reference le Maire, François and Dufrêne2004) obtained an RMSE of 2·86 μg/cm2 with ChlNDI index, 1·87 with mND and 1·88 with mSR. Maccioni et al. (Reference Maccioni, Agati and Mazzinghi2001) have shown that, in contrast to hemispherical reflectance measurements, directional leaf reflectance may not correlate well with chlorophyll concentration. This is mainly due to the external reflectance at the leaf epidermis. In field situations, the use of integrating spheres is not possible, and measurements are also influenced by the sensitivity of directional reflectance measurements, such as those performed in the present work, to the anisotropic behaviour of leaf surface reflectance factors (Comar et al. Reference Comar, Baret, Viénot, Yan and De Solan2012).
The precision of leaf reflectance measurements seemed higher than that of SPAD or Dualex, whereas a larger uncertainty was due to leaf chlorophyll extraction and analysis procedures.
The encouraging results obtained with the SPAD ‘consensus’ equation suggest the possibility of developing a similar general purpose equation for Dualex. However, there are not yet enough experimental calibrations in the literature, due to the recent appearance on the market of this instrument. Indeed the only model available (Cerovic et al. Reference Cerovic, Masdoumier, Ghozlen and Latouche2012) showed considerable underestimation of chlorophyll on the data used in the present paper. This could be possibly explained by the difference in chlorophyll extraction solvent employed, i.e. ethanol in the present work v. acetone by Cerovic et al. (Reference Cerovic, Masdoumier, Ghozlen and Latouche2012). Chlorophyll extraction by ethanol has been reported to be significantly higher than by acetone (Minocha et al. Reference Minocha, Martinez, Lyons and Long2009; Féret et al. Reference Féret, François, Gitelson, Asner, Barry, Panigada, Richardson and Jacquemoud2011).
Cerovic et al. (Reference Cerovic, Masdoumier, Ghozlen and Latouche2012) highlighted the linearity of Dualex, as compared to the curvilinear response of SPAD. The non-linear response of SPAD was attributed to the ‘sieve effect’, resulting from non-uniform distribution of chlorophyll in the leaf and in particular to the increase of chlorophyll density in chloroplasts, which is more evident in high-chlorophyll leaves (Terashima & Saeki Reference Terashima and Saeki1983; Monje & Bugbee Reference Monje and Bugbee1992; Castelli et al. Reference Castelli, Contillo and Miceli1996; Richardson et al. Reference Richardson, Duigan and Berlyn2002). The non-linearity of the SPAD response to chlorophyll seems confirmed, in the present work, by the good fit with the homographic ‘consensus equation’, whereas a different shape was highlighted of the chlorophyll response between SPAD and Dualex, the latter having a more linear response.
The use of a synthetic dataset, such as that generated in the present work by PROSPECT-4, allows simulation of a broad variability of leaf biochemical and biophysical properties influencing the spectral reflectance and transmittance of the leaf. Such synthetic data avoid confounding effects due to experimental errors, but uncertainties resulting from the simplifying assumptions contained in the model are introduced. Nevertheless, several authors have used sets generated by models in order to provide increased robustness to the calibration equations (le Maire et al. Reference le Maire, François and Dufrêne2004; Féret et al. Reference Féret, François, Gitelson, Asner, Barry, Panigada, Richardson and Jacquemoud2011). Simulations were used in the present work, in an attempt to compare different indices in the absence of experimental error. Intermediate estimation accuracy (in terms of RPD values) for SPAD, Dualex and all the vegetation indices was obtained. The calibration of indices on the synthetic dataset brought about lower R 2 values of the calibration equations, but also considerably lower RMSE and RRMSE, as compared to the case when the experimental dataset was employed. This is expected, since in the synthetic database a larger variability of leaf properties was introduced, greatly increasing the scatter of the data as compared to the experimental dataset. RMSE is lower in the synthetic dataset because of the absence of experimental error.
CONCLUSIONS
The present study illustrates some of the issues involved in quantitative leaf chlorophyll concentration estimation using currently available indirect methods. There is a need to increase calibration and inter-comparison studies for the different instruments commonly used for this aim, in order to obtain generally applicable equations for leaf chlorophyll estimation of different crop species. For such purpose, the specificity of calibrations can be attenuated when a large dataset including several species is used or when a large number of studies allows some synthesis to be performed. Concerning the latter approach, a homographic equation proposed for SPAD by Cerovic et al. (Reference Cerovic, Masdoumier, Ghozlen and Latouche2012) on the basis of eight published sources, fitted the current experimental dataset obtained on four crop species well, confirming its general validity, whereas the linear models proposed for the Dualex (only calibrated on the data of Cerovic et al. (Reference Cerovic, Masdoumier, Ghozlen and Latouche2012)) underestimated actual chlorophyll concentration.
Narrow-band spectral reflectance indices did not produce better results than those obtained by SPAD and Dualex for the current experimental dataset, obtained in the field using directional spectral measurements albeit standardized through constant illumination source and target geometry. The use of an integrating sphere to obtain hemispherical reflectances could have yielded better results for spectral indices (Maccioni et al. Reference Maccioni, Agati and Mazzinghi2001; le Maire et al. Reference le Maire, François and Dufrêne2004), although this is more suitable to a laboratory setting. The creation of a synthetic database, generated by the physically based PROSPECT-4 model simulating hemispherical reflectance and transmittance, allowed comparison of the performances of the reflectance indices and the chlorophyll meters for a wider range of leaf properties and confirmed the substantial equivalence of reflectance-based and transmittance-based (i.e. pseudo-SPAD and Dualex) indices. Among the indices, the CIred_edge provided the best performances. However, the PLSR technique, exploiting the full spectrum, performed generally better than either leaf meters or narrow-band reflectance indices, both on experimental and synthetic datasets.
Since, for field applications, the use of handheld chlorophyll meters is considerably more convenient than the technology currently required for the acquisition of spectral indices, or full scans, it is likely that the use of the former will continue. The introduction on the market of devices having other capabilities in addition of the estimation of leaf chlorophyll, such as the Dualex, providing a flavonoid index and the NBI, as well as improved data-logging capabilities, might probably further encourage the use of such instruments for leaf-scale applications.
The research has been partly funded by the Italian Space Agency (ASI) with grant number I/019/11/10 (PRISMA Mission). The authors would like to thank the staff of the Maccarese SpA farm for their kind assistance and Professor R. Valentini for the loan of the ASD spectroradiometer. We also thank the Editor and the reviewers for the helpful suggestions for improving the manuscript.