INTRODUCTION
The decrease of above-ground net primary productivity (ANPP) and tree stature with increasing altitude in tropical montane forests is poorly understood. Several explanations for low growth and stature of trees at high altitudes are given in the literature: (1) Low photosynthesis due to persistent cloudiness and thus low radiation input (Bruijnzeel & Veneklaas Reference BRUIJNZEEL and VENEKLAAS1998) or due to low temperatures (Kitayama & Aiba Reference KITAYAMA and AIBA2002); (2) direct impact of low temperatures on growth (Hoch & Körner Reference HOCH and KÖRNER2003); (3) exposure to strong winds (Cordero Reference CORDERO1999, Lawton Reference LAWTON1982); (4) low nutrient availability due to water-saturated soils, low temperatures and high concentrations of phenolic compounds in soils leading to low decomposition and mineralization rates (Bruijnzeel et al. Reference BRUIJNZEEL, WATERLOO, PROCTOR, KUITERS and KOTTERINK1993, Edwards & Grubb Reference EDWARDS and GRUBB1977, Tanner et al. Reference TANNER, VITOUSEK and CUEVAS1998); (5) low nutrient uptake capacity due to reduced root respiration or transpiration (Bruijnzeel & Veneklaas Reference BRUIJNZEEL and VENEKLAAS1998).
Correlations between plant growth and nutrient availability have often been observed in tropical montane forests. The exceptional high tree stature in a montane forest stand in Papua New Guinea was attributed to its nutrient-rich soil parent material (Edwards & Grubb Reference EDWARDS and GRUBB1977). In Jamaica (Tanner et al. Reference TANNER, KAPOS, FRESKOS, HEALEY and THEOBALD1990) and Hawaii (Vitousek & Farrington Reference VITOUSEK and FARRINGTON1997) trunk diameter growth and leaf production of several native tree species in montane forests were enhanced by addition of nitrogen (N) or phosphorus (P).
Tanner et al. (Reference TANNER, VITOUSEK and CUEVAS1998) hypothesized that in tropical montane forests N limitation is more common than P limitation whereas tropical lowland forests are usually P limited. The authors suggested that with regard to N, tropical montane forests appear to function more like forests from higher latitudes than like tropical lowland forests. This suggestion is based on the observation that boreal and temperate forests tend to be strongly N deficient, whereas tropical forests on old soils (primarily tropical lowland forests) tend to be P deficient (McGroddy et al. Reference MCGRODDY, DAUFRESNE and HEDIN2004, Reich & Oleksyn Reference REICH and OLEKSYN2004, Vitousek et al. Reference VITOUSEK, WALKER, WHITEAKER and MATSON1993).
The nutritional status of plants is governed both by chemical and spatial nutrient availability to plant roots (Jungk Reference JUNGK, Waisel, Eshel and Kafkafi2002). Chemical nutrient availability in tropical montane forests may be affected by parent material, weathering intensity, cation exchange capacity, the rates of litter decomposition, or extracellular phosphatase activity (Kitayama & Aiba Reference KITAYAMA and AIBA2002, Treseder & Vitousek Reference TRESEDER and VITOUSEK2001, Wilcke et al. in press). Spatial nutrient availability is dependent on the exploitation of soil by roots or mycorrhizal hyphae and the mobility of the respective nutrient in soil. It is likely to be high in the densely rooted organic layers of tropical montane forests (Hertel et al. Reference HERTEL, LEUSCHNER and HOLSCHER2003, Vance & Nadkarni Reference VANCE and NADKARNI1992) and may be further enhanced by high abundance of mycorrhizal fungi (Kottke et al. Reference KOTTKE, BECK, OBERWINKLER, HOMEIER and NEILL2004, Treseder & Vitousek Reference TRESEDER and VITOUSEK2001). At high altitudes of tropical montane forests, spatial availability of nutrients in mineral soil may be decreased due to unfavourable chemical soil properties for root growth (Schrumpf et al. Reference SCHRUMPF, GUGGENBERGER, VALAREZO and ZECH2001).
Whereas the nutritional status of plants in agricultural ecosystems is comparatively easy to assess, it is often a challenge to determine the factors limiting plant growth in natural forest ecosystems (Stewart Reference STEWART2000, Vitousek & Farrington Reference VITOUSEK and FARRINGTON1997). Fertilization experiments are necessary to make definite conclusions about the limitation of ANPP by nutrients, but they are time consuming and therefore often restricted to very few nutrients. In tropical forests such experiments may further be confounded by P-fixation in soil and modest response of slow-growing species to nutrient amendment (Tanner et al. Reference TANNER, VITOUSEK and CUEVAS1998).
Determination of foliar nutrient concentrations allows a rapid examination of many nutrients. However, to assess potential growth limitation by nutrients, critical nutrient concentrations (leaf concentrations that indicate nutrient deficiency or sufficiency) have to be known. For native species of tropical montane forests critical nutrient concentrations are usually not available. A further challenge for assessment of nutrient limitation by foliar analysis in tropical montane forests is their high biodiversity. Neighbouring plant species growing in one stand may differ in the degree of growth limitation by nutrients (Tanner et al. Reference TANNER, KAPOS, FRESKOS, HEALEY and THEOBALD1990) and foliar nutrient concentrations often vary among individual species (Vitousek et al. Reference VITOUSEK, TURNER and KITAYAMA1995). Nevertheless, in several natural forest ecosystems foliar nutrient concentrations have been related to plant nutritional status (Barrick & Schoettle Reference BARRICK and SCHOETTLE1996, McGroddy et al. Reference MCGRODDY, DAUFRESNE and HEDIN2004, Tanner et al. Reference TANNER, VITOUSEK and CUEVAS1998).
In the present study we examined soil nutrient availability and foliar nutrient concentrations at different altitudes of a south Ecuadorian montane forest. The aim was to elucidate factors that may contribute to the reduction of ANPP and tree stature with increasing altitude and therefore, to obtain indications for the nutrient supply to plants. It was hypothesized (1) that adequate nutrient supply is critical at high altitudes and (2) that low nutrient supply at high altitudes is attributed to a slow mineralization rate and shallow root distribution.
STUDY SITES
Experimental work was carried out at three study sites on the fringes of the Podocarpus National Park on the eastern Andes slope in southern Ecuador. The two lower study sites (1900 m asl, S 03°58′ W 79°04′ and 2400 m asl, S 03°59′ W 79°04′) were situated in the Reserva San Francisco (RSF), the highest site (3000 m, S 04°06′ W 79°10′) was located in Cajanuma within the Podocarpus National Park. The sites were all situated on moderate slopes (27–31°).
Maximum tree heights at 1900 m and 2400 m were 19 m and 12 m, respectively (Röderstein et al. Reference RÖDERSTEIN, HERTEL and LEUSCHNER2005). About 250 to 288 tree species from 25 different families occurred in the RSF. Most frequent families were Lauraceae, Rubiaceae and Melastomataceae, and species composition differed markedly between 1900 and 2400 m (Homeier Reference HOMEIER2004). The uppermost study site in Cajanuma was located in a typical elfin forest, with a maximum tree height of 9 m (Röderstein et al. Reference RÖDERSTEIN, HERTEL and LEUSCHNER2005). Notable tree families at this site were Clusiaceae, Cunoniaceae, Aquifoliaceae and Chloranthaceae (Homeier Reference HOMEIER2004).
Within the study area, above-ground productivity decreased markedly with increasing altitude. As an estimate for annual gross leaf production, Röderstein et al. (Reference RÖDERSTEIN, HERTEL and LEUSCHNER2005) reported a decrease of average leaf litter production from 862 g m−2 y−1 at 1900 m to 433 g m−2 y−1 at 2400 m and 263 g m−2 y−1 at 3000 m. The relative annual increment in stem cross-sectional area declined from 1.26% at 1850 m to 0.63% at 2450 m (Homeier Reference HOMEIER2004).
The soils were developed on metamorphic shale, quartzite or sandstone bedrock and were classified as gleyic Cambisols according to FAO taxonomy at 1900 and 2400 m and podzols at 3000 m (S. Iost, pers. comm.). Soils were acid at all altitudes. To a depth of 0.3 m in mineral soil, pH(CaCl2) ranged between 2.9 and 3.5 at 1900 and 2400 m and between 2.7 and 2.9 at 3000 m (Soethe et al. Reference SOETHE, LEHMANN and ENGELS2006). Following the FAO taxonomy (FAO 1988), the average depth of the upper mineral soil accumulated with humus (Ah) decreased from 0.70 m at 1900 m to 0.15 m at 2400 m and 0.20 m at 3000 m. The organic layer, on average containing more than 40% C in the dry substance, was markedly deeper at 3000 m (about 0.30 m) than at the lower study sites (about 0.15 m).
The mean annual rainfall at 1900 m (1950 mm) was lower than at 2400 m (5000 mm) and 3000 m (4500 mm). Mean annual temperature decreased markedly from 14.9 °C at 1900 m to 12.3 °C at 2400 m and 8.6 °C at 3000 m (Röderstein et al. Reference RÖDERSTEIN, HERTEL and LEUSCHNER2005).
METHODS
Sampling
Foliar nutrient concentrations at the community level were assessed by the following procedure: (1) Mixed samples were taken to address the problem that plant species may differ in growth limitation by nutrients and foliar nutrient concentrations; (2) Samples were taken separately for the life forms trees (lignified and higher than 3 m), shrubs (lignified and with a height of 0.5–3 m) and herbs (not lignified). It should be noted that the shrub life form comprised typical shrub species as well as young trees. This means that species compositions overlapped between trees and shrubs. This classification was based on another study, where the ability for nutrient uptake was assessed separately for these life forms (Soethe et al. Reference SOETHE, LEHMANN and ENGELS2006). Species classified as herbs, however, were completely different from species classified as shrubs or trees.
In October 2004 (dry season), five locations were chosen randomly at each altitude. Ten plants per life form growing closest to each location were chosen. One to several young fully developed leaves per plant were harvested, using pruning shears for trees and shrubs. The aim was to combine similar masses of leaf material from the ten plants per location to one bulked sample. Thus, from microphyllous species (e.g. Weinmannia sp. (Cunoniaceae)) more than one leaf was harvested to compensate for the reduced weight of leaf material. From species with very large leaves (e.g. Graffenrieda emarginata (Ruiz & Pav.) Triana (Melastomataceae)), just one piece of a leaf was harvested containing leaf material from the edge to the centre of the leaf. On the day of sampling, leaf samples were dried at 50 °C.
Soil was sampled in 20 × 20-m plots established at each altitude. Twenty replicate locations per plot were sampled. Samples from the organic layer were taken with help of a frame (100 × 100-mm). Samples were divided in the upper 0.05 m of the organic layer (O1) and the rest of the organic layer (O2). Mineral soil was sampled with a soil corer (80 mm in diameter) in the depths 0.0–0.1, 0.1–0.3, 0.3–0.5 and 0.5–0.7 m. At the field station of the RSF, samples were stored at 4 °C for several weeks. Four of the 20 replicates were bulked together in each case to obtain five replicate samples per soil depth for analysis. Samples were directly air dried for further storage and transport to Germany.
For the determination of mineral N (Nmin), samples from mineral soil were taken by soil coring. Twelve randomly distributed replicate subsamples were taken at 1900 m, and nine at 2400 m and 3000 m, respectively. Three subsamples each were combined to one sample to obtain four replicates for the analysis at 1900 m and three replicates at 2400 m and 3000 m. At the field station in Ecuador, fresh soil samples were stored at 4 °C for a few days and then extracted with 12.5 mM CaCl2 (ratio soil:solution = 1:2). Thereafter, soil extracts were frozen at 20 °C. Freezing was maintained during the transport to Germany.
Chemical analyses
Chemical analyses were performed in the laboratories of the Department of Plant Nutrition and the Institute of Crop Science at the Humboldt University of Berlin, Germany. After drying at 50 °C, leaf samples and soil samples from the organic layer were ground with a flint mill (Type MM2, Retsch-GmbH and CoKG). Concentrations of total C, N and S were assessed with a CNS analyser (Vario Max CNS, Elementar Analysesysteme) using sulphadiazine as a standard. As certified reference samples for plant and soil material, CRM No. 180 and CRM No. 382 from the Community Bureau of Reference (BCR) were used. For determination of total P, K, Ca and Mg ground samples were digested with concentrated HNO3 under pressure (Heinrichs et al. Reference HEINRICHS, BRUMSACK, LOFTFIELD and KÖNIG1986). Phosphorus, K, Ca and Mg from the mineral horizons were extracted by the Mehlich III procedure (Mehlich Reference MEHLICH1984). The Mehlich III reagent composition was 0.2 M CH3COOH, 0.25 M NH4NO3, 0.015 M NH4F, 0.013 M HNO3 and 0.001 M EDTA. The extraction ratio (soil weight to extractant volume) was 1:10. Concentrations of Ca, K and Mg from leaf and soil samples were measured by flame atomic absorption spectrometry (Perkin Elmer 4100, Perkin Elmer) and P concentrations were determined with a spectral photometer (Specord 200, Analytik Jena) after using the molybdenum blue procedure (Murphy & Riley Reference MURPHY and RILEY1962). For determination of Nmin in mineral soil, nitrate concentrations in the extracts were assessed with a spectral photometer (Lambda 2S, Perkin Elmer) from the difference of the extinction at a wavelength of 210 and 275 nm (modified from Navone Reference NAVONE1964). Ammonium was measured photometrically at a wavelength of 636 nm after using the indophenol blue procedure (Bundy & Meisinger Reference BUNDY, MEISINGER and Page1994).
Assessment of growth-limiting nutrients from foliar nutrient analysis
To address the problem that critical foliar nutrient concentrations are not known for the species growing in this forest, different approaches were followed: (1) Concentration of one specific nutrient in leaves of trees was compared with critical concentrations of other tree species from literature. (2) In order to obtain further information about the relative limitation of plant growth by N and P, nutrient ratios (C:N, C:P and N:P) from leaf biomass were calculated and compared with nutrient ratios in literature.
Calculations and statistical analyses
To calculate nutrient stocks in soil, average bulk densities of each soil layer were used. Significant differences of foliar nutrient concentrations, nutrient stocks in soil and C to nutrient ratios in soil between different altitudes were assessed by ANOVA and Tukey post hoc test.
RESULTS
Nutrient concentrations in leaves
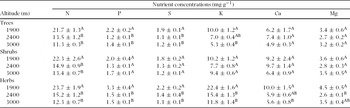
The effect of altitude on foliar nutrient concentrations of trees varied depending on the specific nutrient (Table 1). While concentrations of Ca and Mg were not affected by altitude, the concentrations of all other nutrients were lower at 2400 and 3000 m than at 1900 m. The decrease of the concentrations of N, P, S and K from 1900 m to higher altitudes ranged between 30% and 48%.
Nutrient concentrations in youngest fully developed leaves of trees, shrubs and herbs at three altitudes (n = 5). Data shown are mean ± standard error. Altitudes that do not share upper-case letters differ significantly at P < 0.05 by Tukey multiple comparison tests.

Nutrient concentrations in leaves of shrubs and herbs were similar to those in leaves of trees with the exception of higher P concentrations in herbs at 1900 m and higher K concentrations in herbs at all altitudes (Table 1). The effect of altitude on foliar nutrient concentration of shrubs and herbs was similar to that on foliar nutrient concentration of trees. The concentration of N, P and S were markedly lower at 2400 and 3000 m than at 1900 m. The concentrations of K decreased at higher altitudes in herbs but not in shrubs. The concentrations of Ca and Mg were significantly reduced only in herbs at 2400 m and 3000 m, respectively.
Nutrients in the organic layer
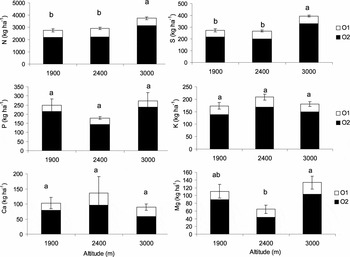
There was no uniform effect of altitude on total nutrient stocks in the organic layer (Figure 1). The stocks of N, S and Mg were significantly affected by altitude, whereby the largest stocks were found at 3000 m. The stocks of P, K and Ca were not significantly affected by altitude.
Total nutrient stocks in the upper 0.05 m (O1) and the rest (O2) of the organic layer at three altitudes (mean and SE, n = 5). Different lower-case letters indicate significant differences in nutrient stocks between altitudes (Tukey test, P < 0.05).

Nutrients in mineral soil
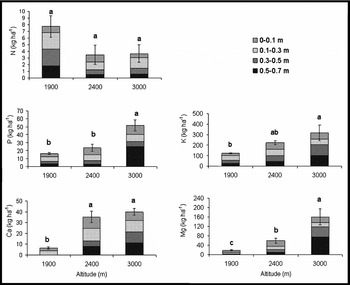
In mineral soil, stocks of Nmin in the upper 0.7 m were not significantly different between altitudes (Figure 2). The proportion of NO−3 in total Nmin stocks ranged between 24% and 84%, irrespectively of soil depth and altitude. The stocks of Mehlich III-extractable P, K, Ca and Mg increased markedly with increasing altitude. This was especially pronounced in the deeper soil layers below 0.3 m.
Stocks of Nmin (n = 3–4) and Mehlich III-extractable nutrients (n = 5) in different depths of mineral soil at three altitudes (shown are mean and SE). Different lower-case letters indicate significant differences in nutrient stocks between altitudes (ANOVA, Tukey test, P < 0.05).

Nutrient ratios in leaves and soil substrate
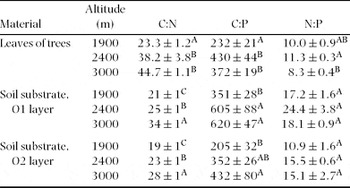
With increasing altitude, there was a marked increase of C:N and C:P ratios in tree leaves, resulting in significantly higher C to nutrient ratios at 2400 and 3000 m than at 1900 m (Table 2). Highest C:N ratios occurred at 3000 m and highest C:P ratios at 2400 m. Accordingly, N:P ratios were significantly higher at 2400 m than at 3000 m.
Nutrient ratios (weight to weight) in leaves of trees and in substrate of the organic layers (n = 5). Data shown are mean ± SE; different upper case letters show significant differences between altitudes (Tukey-test, P < 0.05).
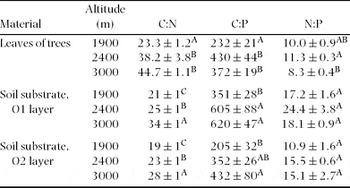
Ratios of C:N and C:P in the O1 and O2 layer increased significantly with increasing altitude (Table 2). The extent of this increase (about 50% from 1900 to 3000 m) was similar in both layers. The C to nutrient ratios were significantly higher in the O1 than in the O2 layer (Student's t-test, P < 0.05), except for C:N ratios at 2400 m, and C:P ratios at 3000 m, which were not significantly different between the two layers. In both soil depths, N:P ratios did not differ significantly between altitudes, but showed a tendency to be highest at 2400 m.
Ratios of C:N were in a similar range in leaf biomass and in soil substrate. In contrast, C:P ratios, and accordingly N:P ratios, were markedly higher in the O1 layer than in leaves. C:P ratios in the O2 layer were similar to C:P ratios in leaf biomass.
DISCUSSION
Foliar nutrient concentrations at 1900 m
At 1900 m, foliar concentrations of all macronutrients except Ca were in the ranges of nutrient sufficiency for tropical tree species (Tables 1 and 3; Bergmann Reference BERGMANN1993). Also, foliar concentrations of the micronutrients iron, copper, manganese and zinc were within the range of sufficiency given in textbooks (N. Soethe, J. Lehmann & C. Engels, unpubl. data).
At this altitude, foliar concentrations of N, P, S, K and Mg were higher than the ranges of nutrient deficiency found in other studies for trees of tropical montane forests (Tanner et al. Reference TANNER, KAPOS, FRESKOS, HEALEY and THEOBALD1990, Vitousek & Farrington Reference VITOUSEK and FARRINGTON1997, Vitousek et al. Reference VITOUSEK, TURNER and KITAYAMA1995) and tropical lowland forests (Drechsel & Zech Reference DRECHSEL and ZECH1991).
At 1900 m, foliar C:N and C:P ratios (Table 2) were substantially lower than those reported from McGroddy et al. (Reference MCGRODDY, DAUFRESNE and HEDIN2004) for temperate broad-leaved (30:1 and 357:1) and tropical lowland forests (30:1 and 951:1), supporting the suggestion that at this altitude growth was not limited by N or P. This is in contrast to other tropical forest sites where growth limitation by N or P has been demonstrated (Tanner et al. Reference TANNER, KAPOS and FRANCO1992, Vitousek & Farrington Reference VITOUSEK and FARRINGTON1997).
In comparison to lower altitudes, however, forest growth at 1900 m was also reduced in the studied Ecuadorian montane forests. Since nutrient limitations are unlikely at 1900 m given the results shown in this study, possible causes for reduced growth in these forests include increased cloudiness (Bruijnzeel & Veneklaas Reference BRUIJNZEEL and VENEKLAAS1998) and direct growth reduction by low temperatures (Hoch & Körner Reference HOCH and KÖRNER2003).
Foliar K concentrations in herbs were about twice as high as K concentrations in lignified plants (Table 1). In temperate regions, tree species have optimal K concentrations between 10 and 18 mg g−1, whereas herbaceous species show K concentrations between 12 and 70 mg g−1 at optimal K supply (Bergmann Reference BERGMANN1993). Thus, high K concentrations in leaves of herbs are not necessarily related to plant nutritional status.
Foliar nutrient concentrations in shrubs showed high variation among replicates (Table 1). As a result, the effect of altitude on foliar nutrient concentrations (except for N) was not significant for this life form. Possibly, variation in foliar nutrient concentrations are related to the high variation in nutrient uptake capacity from deeper soil layers by shrubs at this altitude (Soethe et al. Reference SOETHE, LEHMANN and ENGELS2006).
Effect of altitude on foliar nutrient concentrations
The effect of altitude on foliar nutrient concentrations was dependent on the specific nutrient (Table 1). While concentrations of N, P, K and S in trees decreased with increasing altitude, the concentrations of Mg and Ca were not significantly affected by altitude. This is in accordance with the studies reviewed by Tanner et al. (Reference TANNER, VITOUSEK and CUEVAS1998).
Foliar nutrient concentrations are usually regarded as an indicator for the nutritional status of plants (Bergmann Reference BERGMANN1993). However in mixed samples as used in our approach, differences in foliar nutrient concentrations between altitudes may also be related to differences in species composition, and may be affected by factors such as site specific characteristics of leaf morphology, adaptation to nutrient-poor soils (Chapin Reference CHAPIN1980) or dominance of species with inherently high or low nutrient concentrations (Drechsel & Zech Reference DRECHSEL and ZECH1991, Tanner et al. Reference TANNER, KAPOS, FRESKOS, HEALEY and THEOBALD1990, Vitousek et al. Reference VITOUSEK, TURNER and KITAYAMA1995).
In Table 1, nutrient concentrations were based on leaf dry matter to allow comparisons with ranges of sufficiency or deficiency given in the literature. It has been found that in other montane forests foliar N and P concentrations decreased with increasing altitude when expressed on a leaf mass basis, whereas concentrations increased when based on leaf area (Kitayama & Aiba Reference KITAYAMA and AIBA2002, Vitousek et al. Reference VITOUSEK, APLET, TURNER and LOCKWOOD1992). Leaf morphology often changes with increasing altitude, whereby in many cases leaves become thicker and more xeromorphic. Edwards & Grubb (Reference EDWARDS and GRUBB1982) suggested that decreasing foliar N concentrations at high altitudes of tropical montane forests reflect the development of thicker cell walls, which may not be related to N shortage but for example aid in minimizing the infestation by fungi under cool and moist conditions. In the present study, species with xeromorphic leaves were very frequent at 2400 and 3000 m. Nevertheless, specific leaf area (SLA) did not show the expected decrease with increasing altitude. Specific leaf area decreased significantly from 58 cm2 g−1 at 1900 m to 52 cm2 g−1 at 2400 m, but was highest at 3000 m (61 cm2 g−1) (Moser et al. Reference MOSER, HERTEL and LEUSCHNER2007). Foliar N and P concentrations in trees decreased with increasing altitude when the concentrations were based on leaf dry matter, but also when they were based on leaf area (N: 3.1, 3.0 and 2.3 g m−2, P: 0.34, 0.28 and 0.28 g m−2 at 1900, 2400 and 3000 m, respectively). Thus in this study, low foliar nutrient concentrations at higher altitudes cannot be explained by leaf morphology.
The species composition at our forest sites completely changed with increasing altitude. The number of tree species was significantly higher at low than at high altitudes (Homeier Reference HOMEIER2004). Among the most frequent tree species at 3000 m were Weinmannia loxensis Harling (Cunoniaceae) and Clusia sp. (Clusiaceae). Possibly, nutrient concentrations in mixed leaf samples reflected foliar nutrient composition of dominant species rather than stand-specific nutrient concentrations. However, this assumption is not supported by our data where all life forms showed similar trends in the change of nutrient concentrations with increasing altitude (with the exception of significantly decreased concentrations of Ca and Mg of herbs at high altitudes; Table 1). It has to be considered that species composition in herbs completely differed from that in trees and shrubs. This indicates that the differences of foliar nutrient concentrations at different altitudes were not due to the occurrence of species with inherently low or high foliar nutrient concentrations, but result from stand-specific conditions, e.g. modification of nutrient availability.
The concentrations of N, P, S and K were substantially lower at 2400 and 3000 m than at 1900 m. This shows that at higher altitudes nutrient acquisition of plants was even more affected than productivity leading to dilution of nutrients in the leaf dry matter. Furthermore, foliar concentrations of N, S and K at higher altitudes decreased below the ranges of sufficiency according to reference data given by Bergmann (Reference BERGMANN1993) (Table 3). Concentrations of N were within the ranges indicating deficiency in tropical forests. This suggests limitation of growth by deficiency of one or several nutrients at higher altitudes. It has been found that many wild plants respond to nutrient deficiency by growth reduction rather than by reduction in nutrient concentrations (Chapin Reference CHAPIN1980). This may explain the observation that foliar concentrations at 2400 and 3000 m were similar despite the lower growth at 3000 m than at 2400 m.
Foliar nutrient concentrations in trees as reported from literature (N = number of tree species). aBergmann (Reference BERGMANN1993): Ranges of foliar nutrient concentrations where neither deficiency nor toxicity occured on tropical broad-leaved tree species. bVitousek et al. (Reference VITOUSEK, TURNER and KITAYAMA1995), Vitousek & Farrington (Reference VITOUSEK and FARRINGTON1997): Ranges of foliar nutrient concentrations of the tree species Metrosideros polymorpha growing on sites where the respective nutrient was limiting plant growth. cTanner et al. (Reference TANNER, KAPOS, FRESKOS, HEALEY and THEOBALD1990): Ranges of foliar nutrient concentrations of native trees with nutrient deficiency as determined by fertilization experiments. dDrechsel & Zech (Reference DRECHSEL and ZECH1991): Ranges of foliar nutrient concentrations where deficiency symptoms occurred at several tropical broad-leaved tree species. TMF = tropical montane forest.

Possible mechanisms for the effects of altitude on plant nutritional status
Increasing altitude may affect the plant nutritional status by modification of soil nutrient availability and the ability of plants for nutrient acquisition. In montane forests large amounts of soil nutrients are stored in the organic layer (Wilcke et al. Reference WILCKE, YASIN, ABRAMOWSKI, VALAREZO and ZECH2002). In the present study, spatial exploitation of the organic layer by fine roots was high, ranging between 2.6 and 7.2 cm fine roots cm−3 soil (Soethe et al. Reference SOETHE, LEHMANN and ENGELS2006). Total amounts of nutrients in the organic layer were not affected by altitude for P, K and Ca and were highest at 3000 m for N, S and Mg (Figure 1). Therefore, the decrease of leaf nutrient concentrations at high altitudes was not related to nutrient stocks in the organic layer.
In the organic layer, most N, P and S are incorporated into the organic matter, and their availability is governed by the mineralization rates (Stevenson & Cole Reference STEVENSON and COLE1999, Wilcke et al. Reference WILCKE, YASIN, ABRAMOWSKI, VALAREZO and ZECH2002). It may be expected that mineralization of organic matter is reduced at higher altitudes because of higher C to nutrient ratios (Table 2), lower soil pH, lower temperatures and less oxygen availability (McGroddy et al. Reference MCGRODDY, DAUFRESNE and HEDIN2004, Soethe et al. Reference SOETHE, LEHMANN and ENGELS2006, Wegner et al. Reference WEGNER, WUNDERLICH, KESSLER and SCHAWE2003, Wilcke et al. Reference WILCKE, YASIN, ABRAMOWSKI, VALAREZO and ZECH2002). The latter can be presumed because at 3000 m, soils were frequently waterlogged. Therefore, plant availability of N, P and S from the organic layer may be reduced at high altitudes in spite of similar or higher total nutrient stocks in this layer (Figure 1).
Different methods were used to assess nutrient contents in mineral soil (Figure 2) and in the organic layer (Figure 1). Therefore it is not possible to draw definite conclusions on the contribution of mineral soil to plant nutrition. The amount of available P, K, Ca and Mg in the mineral soil, as determined by Mehlich III extraction, increased at higher altitudes (Figure 2). At the same time, root growth in mineral soil was reduced at 2400 and 3000 m in comparison to 1900 m, presumably by unfavourable soil conditions such as oxygen deficiency (Soethe et al. Reference SOETHE, LEHMANN and ENGELS2006). In 0.3–0.7 m depth, where highest stocks of available P and K occurred at higher altitudes, root length density was 0.1–0.2 cm cm−3 at 2400 and 3000 m in comparison to 0.5–0.7 cm cm−3 at 1900 m. That is, soil conditions may have reduced the ability of plants for nutrient acquisition from deeper soil layers. It is likely that the high amounts of plant available nutrients in mineral soil at high altitudes are related to impeded nutrient uptake in these soil layers.
The extent of N deficiency versus P deficiency at high altitudes
In leaves of trees N:P ratios varied between 8.3 and 11.3 (Table 2). These ratios are useful parameters to identify N-limited or P-limited situations (McGroddy et al. Reference MCGRODDY, DAUFRESNE and HEDIN2004, Redfield Reference REDFIELD1958, Verhoeven et al. Reference VERHOEVEN, KOERSELMAN and MEULEMAN1996). Han et al. (Reference HAN, FANG, GUO and ZHANG2005) suggest an average N:P ratio of 14.4:1 for terrestrial plant species. Tropical lowland forests are often cited as forest ecosystems that tend to be rather P than N limited (McGroddy et al. Reference MCGRODDY, DAUFRESNE and HEDIN2004, Reich & Oleksyn Reference REICH and OLEKSYN2004). Leaf biomass of these forest ecosystems show an average N:P ratio of 19.6:1 (McGroddy et al. Reference MCGRODDY, DAUFRESNE and HEDIN2004). Trees in our studies had even lower N:P ratios than many broad-leaved forests in temperate regions (N:P of 12.7:1) which tend to be more N limited (McGroddy et al. Reference MCGRODDY, DAUFRESNE and HEDIN2004). Thus, it is likely that N availability in the Ecuadorian montane forest is more critical for plant nutrition than P availability. It is noticeable that both, N:P ratio and C:P ratio, were considerably lower in leaf biomass than in the O1 layer that comprised relatively new leaf litter (Table 2). Low P concentration in the upper soil layer may result from P remobilization from leaves into the stem before leaf shedding, suggesting that low P supply from soil at high altitudes is partly compensated by efficient P recycling within plant biomass. This consideration is consistent with the observation of McGroddy et al. (Reference MCGRODDY, DAUFRESNE and HEDIN2004) that native plant species from tropical forests have a high potential for P remobilization.
The significant decrease of the N:P ratio from 2400 to 3000 m in combination with extremely high C:N ratios in leaf biomass at 3000 m leads to the conclusion that N availability continuously decreased from 2400 to 3000 m. Very low N availability at 3000 m may be explained by the low abundance of N2-fixing plant species at this altitude (J. Homeier, pers. comm.). This observation supports the hypothesis of Tanner et al. (Reference TANNER, VITOUSEK and CUEVAS1998) that unlike tropical lowland forests, plant growth in tropical montane forests is frequently limited by N supply.
CONCLUSIONS
Nutrient availability markedly decreased with increasing altitude in this tropical montane forest. There is evidence that the availability of N, P, S and K was restricted at high altitudes. Low mineralization rates at these altitudes may be one important factor for the low availability of organically bound nutrients such as N, P and S. Low foliar N:P ratios indicate that N supply is more critical for plant growth than P supply.
ACKNOWLEDGEMENTS
We are grateful to Roberth Feijoo, Virgilio Aguirre, Franz Soethe, Carmen Wolfram Wienberg and Christel Scheibe for assistance in field and laboratory. We thank INEFAN (Instituto Ecuatoriano Forestal y de Areas Naturales) for granting the research permit and the Fundacion Científica San Francisco for logistic support at the Estacíon Científica San Francisco. We gratefully acknowledge financial support supplied by the Deutsche Forschungsgemeinschaft (En342/5).