Introduction
In recent decades, conjugated polymers (CPs) have been widely investigated for various optoelectronic applications, including organic light-emitting diodes (OLEDs),[Reference Gross, Muller, Nothofer, Scherf, Neher, Brauchle and Meerholz1, Reference Lee, Jung, Park, Nam, Min, Kim, Lee, Jeong, Friend, Kim, Kim and Song2] organic thin-film transistors (OTFTs),[Reference McCulloch, Heeney, Bailey, Genevicius, Macdonald, Shkunov, Sparrowe, Tierney, Wagner, Zhang, Chabinyc, Kline, McGehee and Toney3, Reference Sirringhaus, Brown, Friend, Nielsen, Bechgaard, Langeveld-Voss, Spiering, Janssen, Meijer, Herwig and de Leeuw4] and organic photovoltaic devices (OPVs)[Reference Kim, Cook, Tuladhar, Choulis, Nelson, Durrant, Bradley, Giles, McCulloch, Ha and Ree5–Reference Park, Roy, Beaupré, Cho, Coates, Moon, Moses, Leclerc, Lee and Heeger7] because of their tunable optical and semiconducting properties via molecular design and their advantages of being light-weight and adaptive to flexible and wearable devices. Furthermore, CPs are applicable to low-cost, solution-based processing methods for device fabrication, including spin casting, ink-jet printing, contact coating, and roll-to-roll processing.[Reference Krebs8]
CPs have a long, one-dimensional (1D), rigid rod-like main chain structure with p-orbital overlaps along the main chain. Owing to these 1D p-orbital overlaps, CPs exhibit intriguing anisotropic properties such as charge transport, absorption, and emission. Therefore, the macroscopic alignment and assembly of CPs are essential to fully utilize their optical and electronic properties. The degree of alignment of CPs in thin films is quantified by the dichroic ratio, which is defined as the ratio of the intensity of the absorption (or emission) parallel to the alignment direction to that of the perpendicular to the alignment direction (dichroic ratio = I ///I ⊥). Although the dichroic ratio is generally derived from the polarized UV–vis absorption or photoluminescence (PL) intensity, the dichroic ratios derived from the integral of the polarized absorption or emission spectrum (A ///A ⊥) and mobility anisotropy (μ ///μ ⊥) have also been used to measure the degree of alignment in some cases. If the dichroic ratio is 1, then absorption or emission is independent of the polarized direction implying that there is no alignment and instead the CPs are randomly oriented. As CP alignment develops, the dichroic ratio increases.
Macroscopic CP alignment is a challenging task as they aggregate easily during solvent drying, which is mainly due to strong π − π interactions between rigid rod-like conjugated main chains.[Reference Kim, Jeong, Chung, Seo, Koo and Kim9] The low mobility and randomly oriented growth of CP aggregates hampers the capability of macroscopically directed CP alignment.[Reference Kim, Jeong, Chung, Seo, Koo and Kim9] Nevertheless, various processing methods have been established to accomplish a certain level of macroscopic alignment for several specific types of CPs. However, it is still elusive as to what CPs are suitable for alignment processing, and what material designs are crucial to achieving well-defined macroscopic alignment. Insight into material design is necessary to identify characteristics of CPs that allow for alignment in order for their potential anisotropic properties to be maximized. Otherwise, it is likely severe difficulties in achieving directed organization will be encountered even if state-of-the-art processing techniques for CP alignment are utilized.
In this paper, we review various processing methods, material designs, and applications for CP alignment and assembly. The first part of this review is devoted to various methods developed for CP alignment, including Langmuir–Blodgett (LB) technique, mechanical rubbing, nanoimprinting, eletrospinning, and directional solidification in addition to the use of pre-patterned substrates and foreign matrix methods. In the second part, recently developed material design principles for directed alignment of CP will be discussed. Finally, we will review three major applications of CPs: OLEDs, OTFTs, and OPVs, that benefit from the highly anisotropic optoelectronic properties present in macroscopically aligned CPs.
CPs alignment method
LB technique
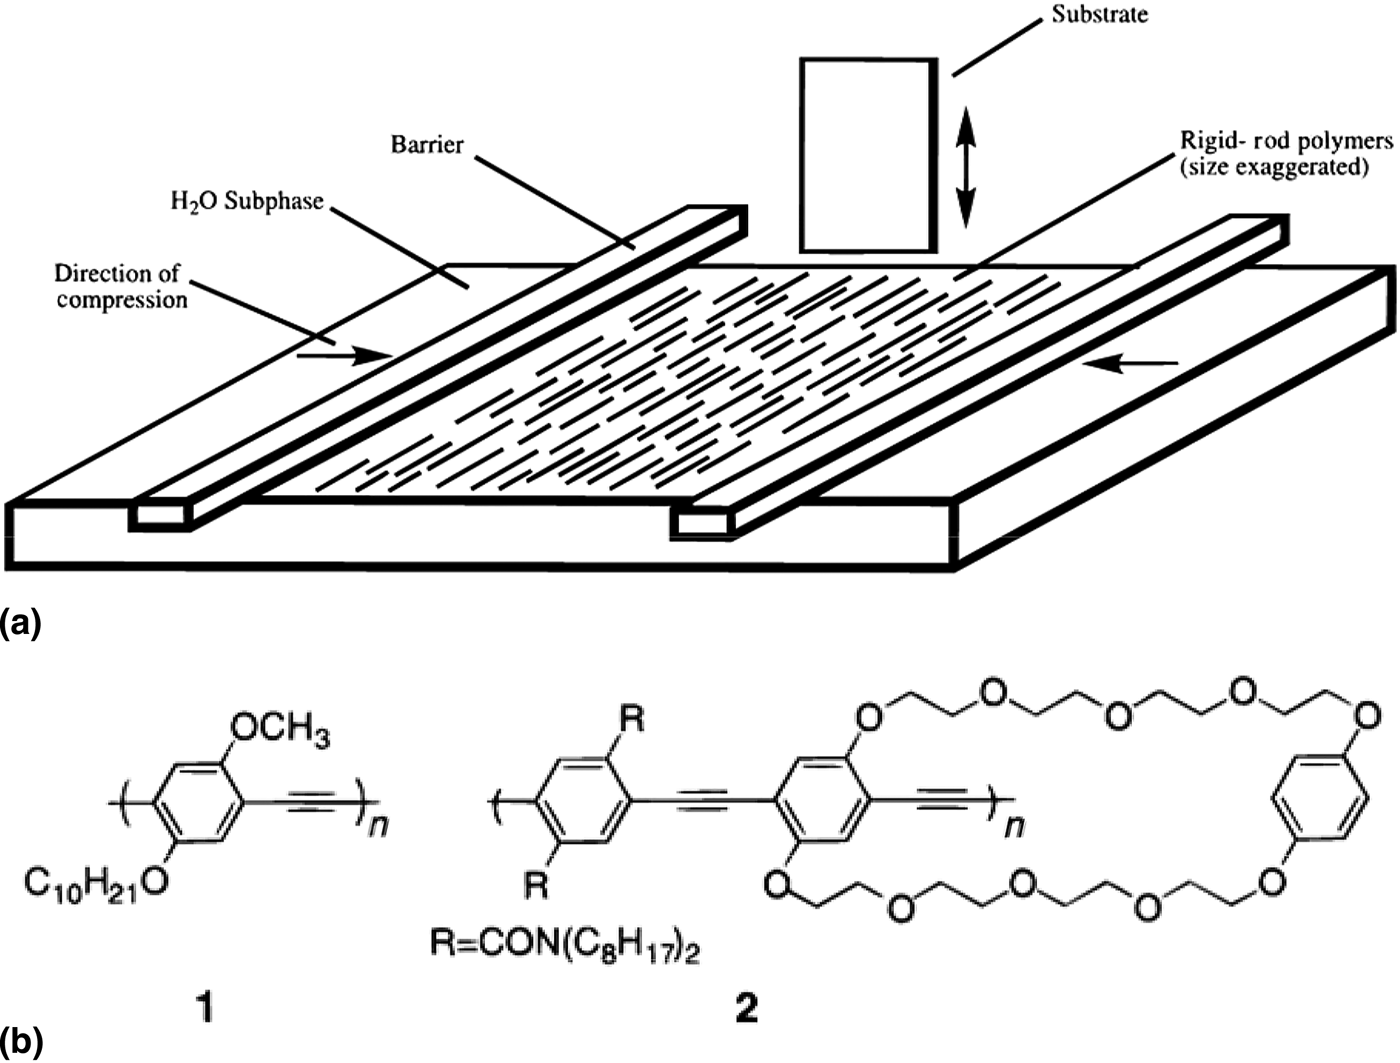
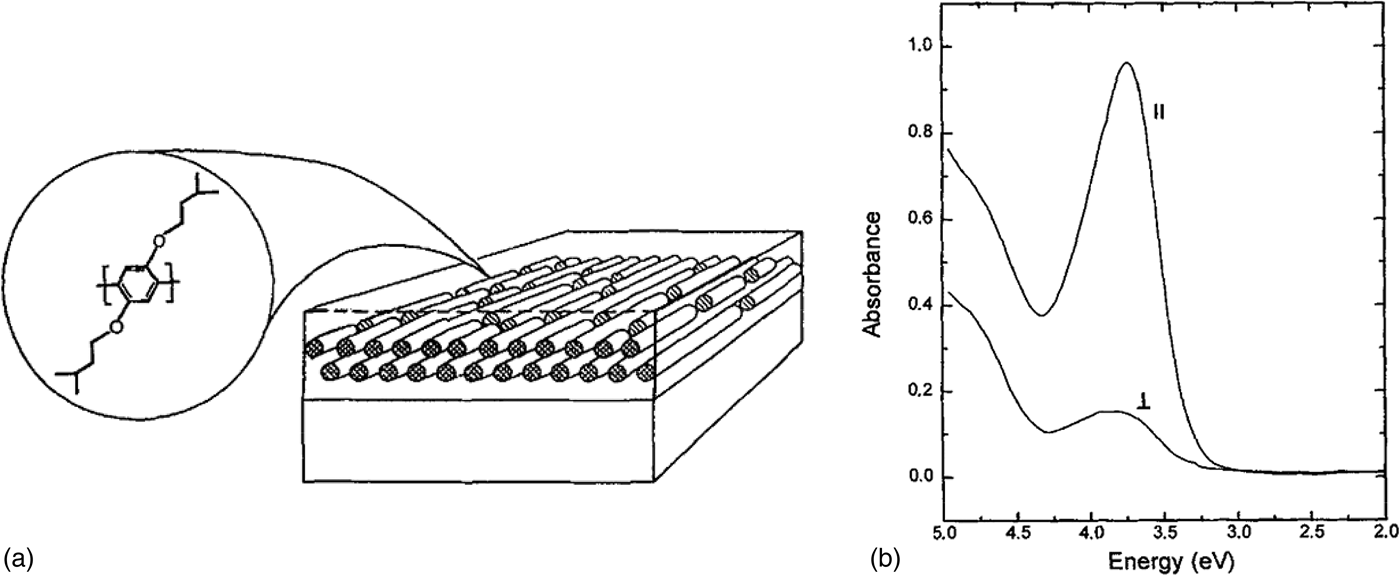
LB technique is one of the more promising methods to produce well-defined CP alignment.[Reference Cimrová, Remmers, Neher and Wegner10, Reference Kim, McHugh and Swager11] Schematic illustration of LB technique is presented in Fig. 1(a); the CP solution is spread at the air–water interface, and under compression of the two barriers, the rigid rod-like CPs align normal to the compression direction. The aligned CP monolayer is then transferred to a substrate through up-stroke and down-stroke movements of the substrate through the monolayer. Neher and co-workers reported alignment of poly(p-phenylene) (PPP) via the LB technique.[Reference Cimrová, Remmers, Neher and Wegner10] PPP chains are aligned parallel to the substrate-dipping direction [Fig. 2(a)]. The dichroic ratio in absorption was observed approximately 5 [Fig. 2(b)]. Swager and co-workers demonstrated the alignment poly(phenylene ethynylene)s (PPEs) via the LB method.[Reference Kim, McHugh and Swager11] The two synthesized PPEs [Fig. 1(b)] were successfully aligned to the dipping direction of the substrate, and exhibited an anisotropic optical property with an absorption dichroic ratio of 3.4–6.3.
(a) Schematic illustration of LB deposition geometry and (b) chemical structure of prepared PPEs.[Reference Kim, McHugh and Swager11] (Reproduced with permission, copyright 1999 American Chemical Society.)

(a) Schematic illustration of molecular orientation of PPP in the LB film and (b) polarized absorption spectra of 100 monolayers LB film under parallel (//) and perpendicular (⊥) to the dipping direction.[Reference Cimrová, Remmers, Neher and Wegner10] (reproduced with permission, copyright 1996 WILEY-VCH Verlag GmbH & Co. KGaA, Weinheim.)
Mechanical rubbing
Mechanical rubbing is a well-known processing method for preparing a polyimide to align liquid crystalline (LC) materials. This process has also been utilized in CP alignment by rubbing a CP film with a fabric or substrate, such as quartz, generally at an elevated temperature.[Reference Kanetake, Ishikawa, Koda, Tokura and Takeda12–Reference Biniek, Pouget, Djurado, Gonthier, Tremel, Kayunkid, Zaborova, Crespo-Monteiro, Boyron, Leclerc, Ludwigs and Brinkmann15] Alignment of polydiacetylene (PDA) was demonstrated by mechanically rubbing a photopolymerized PDA film with a silicon cloth and an absorption dichroic ratio of 8 was observed.[Reference Kanetake, Ishikawa, Koda, Tokura and Takeda12] Regioregular poly(3-hexylthiophene) (rrP3HT) was also reported to be aligned by mechanical rubbing. A spincast 20 nm thick P3HT film rubbed with a piece of velvet about ten times at 100 °C, and showed a dichroic ratio of 5.1 in absorption.[Reference Heil, Finnberg, von Malm, Schmechel and Seggern13] In addition, Yang et al. reported a dichroic ratio about 10 from a rrP3HT film rubbed with a quartz plate at 95 °C.[Reference Yang, Soci, Moses and Heeger14]
Recently, Brinkmann and co-workers demonstrated mechanical rubbing induced alignment of various CPs.[Reference Biniek, Pouget, Djurado, Gonthier, Tremel, Kayunkid, Zaborova, Crespo-Monteiro, Boyron, Leclerc, Ludwigs and Brinkmann15] In their procedure, mechanical rubbing was applied by a homemade rubbing instrument on a polymer film prepared by the doctor blade method [Fig. 3(a)]. As illustrated in Fig. 3(b), different types of CPs were aligned by mechanical rubbing and were shown to have high absorption dichroic ratios. In the specific case of a rubbed rrP3HT film at 180 °C, an absorption dichroic ratio above 25 was observed. The correlation between the degree of alignment and the rubbing temperature and the molecular weight of CPs were further investigated. As the rubbing temperature increased, the dichroic ratio also increased [Fig. 3(c)]. It was also found that as the molecular weight of the CP increases, a higher rubbing temperature is required to achieve a similar dichroic ratio [Fig. 3(c)]. It is possible that this is due to molecular weight dependence of the crystal to LC transition temperature.
(a) Schematic illustration of homemade rubbing machine. (b) Polarized absorption spectra under parallel (//) and perpendicular (⊥) to the rubbing direction of highly oriented various CPs’ film prepared by high-temperature rubbing. (c) Rubbing temperature dependence of dichroic ratio at 605 nm for P3HT and C12-pBTTT with different molecular weights.[Reference Biniek, Pouget, Djurado, Gonthier, Tremel, Kayunkid, Zaborova, Crespo-Monteiro, Boyron, Leclerc, Ludwigs and Brinkmann15] (Reproduced with permission, copyright 2014 American Chemical Society.)
Nanoimprinting
CP alignment has also been accomplished by nanoconfinement of polymer chains by nanoimprinting. Friend and co-workers reported a method for the alignment of LC CP, poly(9,9-dioctylfluorene-co-benzothiadiazole) (F8BT), via nanoimprinting using a silicon mold of nanochannel arrays.[Reference Zheng, Yim, Saifullah, Welland, Friend, Kim and Huck16] The green-emitting F8BT was spincast onto a substrate, and imprinted with the mold at 160 °C and 40 bar for 5 min [Fig. 4(a)]. The scanning electron microscopy (SEM) images of the mold and the imprinted F8BT are presented in Figs. 4(b)–4(e). The imprinted CP film showed nanochannel arrays identical to those present in the mold, and exhibited clear optical anisotropy with an observed absorption dichroic ratio of 7 [Fig. 4(f)]. In this procedure, the self-organization of CP chains in the LC phase was thought to be similar to the LC alignment on a rubbed polyimide film, which was suggested to be a possible alignment mechanism. The structural factor of the imprinted CP film was revealed to be irrelevant to the observed anisotropic optical property as imprinted amorphous films of poly[2,7-(9,9-di-n-octylfluorene)-alt-(1,4-phenylene-((4-sec-butylphenyl)imino)-1,4-phenylene)] did not exhibit any optical anisotropy even though the same nanochannel pattern was produced by nanoimprinting with the same silicon mold.
(a) Schematic illustration of aligning F8BT by nanoconfinement. (b–e) SEM images of Si mold (b, c) and nanoimprinted F8BT using Si mold (d, e). (f) Polarized absorption spectra of aligned F8BT parallel (//) and perpendicular (⊥) to the nanochannel array. The inset shows the absorption peak intensity at different angle of polarization.[Reference Zheng, Yim, Saifullah, Welland, Friend, Kim and Huck16] (Reproduced with permission, copyright 2007 American Chemical Society.)
Regulation of CP assembly inside of nanopillars or nanogratings was also demonstrated by means of nanoimprinting.[Reference Aryal, Trivedi and Hu17, Reference Ding, Wu, Weng, Zhang and Hu18] Hu and co-workers reported vertical chain alignment of rrP3HT in both nanogratings and nanopillars fabricated by nanoimprinting at 170 °C.[Reference Aryal, Trivedi and Hu17] In addition, Hu and co-workers controlled face-on and edge-on orientation of rrP3HT chains via solvent-assisted room temperature nanoimprint lithography.[Reference Ding, Wu, Weng, Zhang and Hu18] Differing from the general nanoimprinting process conducted at a temperature above the glass transition temperature (T g) of the CP, this process was applied at room temperature on a still wet polymer film immediately after film fabrication but before the solvent completely dried out. Interestingly, the orientation of rrP3HT in the nanopillars was determined by the critical diameter of the nanopillar; face-on orientation was dominant when the nanopillars had a diameter <85 nm, while edge-on orientation was dominant when the nanopillars had a diameter > 85 nm.[Reference Ding, Wu, Weng, Zhang and Hu18]
Pre-patterned substrate
The substrate is one of the important factors that critically affects CP alignment. As described above, mechanically rubbed polyimide layers are widely used as a substrate for liquid crystal and LC CP alignment. Sirringhaus et al. reported alignment of a thermotropic LC CP, poly(9,9′-dioctyl-fluorene-co-bithiophene) (F8T2), on a rubbed polyimide alignment layer.[Reference Sirringhaus, Wilson, Friend, Inbasekaran, Wu, Woo, Grell and Bradley19] The aligned F8T2 was prepared by spin casting F8T2 onto a polyimide alignment layer, followed by annealing at the temperature of the thermotropic LC phase (275–285 °C). The film was then quenched to room temperature to preserve the obtained alignment and to suppress crystallization. The resulting nematic CP glass exhibited dichroic ratio of 5–12 depending on the thickness of films, annealing condition of F8T2, and the rubbing procedure of polyimide.
More recently, researchers at the University of California-Santa Barbara reported a CP alignment method using a nanogrooved substrate.[Reference Tseng, Ying, Hsu, Perez, Takacs, Bazan and Heeger20–Reference Luo, Kyaw, Perez, Patel, Wang, Grimm, Bazan, Kramer and Heeger22] To make the nanogrooved substrate, a silicon wafer was scratched with a diamond lapping film [Figs. 5(b) and 5(c)]. By applying the nanogrooved substrate and controlling the solvent evaporation direction and speed [Fig. 5(a)], nanofibers of poly[4-(4,4-dihexadecyl-4H-cyclopenta[1,2-b:5,4-b′]-dithiophen-2-yl)-alt-[1,2,5]thiadiazolo[3,4-c]pyridine] (PCDTPT) were fabricated and ordered parallel to the nanogroove direction [Figs. 5(d) and 5(e)].[Reference Tseng, Ying, Hsu, Perez, Takacs, Bazan and Heeger20] The aligned PCDTPT nanofibers exhibited anisotropic optical properties, dichroic ratio = approximately 2, as well as anisotropic charge mobility; six times higher hole mobility was observed in the parallel to the alignment direction compared with the perpendicular to the alignment direction.
(a) Schematic illustration of solvent evaporation setup with cross-sectional illustration. (b–e) AFM images of dielectric substrate (b,c) and PCDTPT fiber morphology (d,e). (b) Surface without structures, (c) 100 nm-structured (scratched) surface, (d) polymer fibers on nonstructured surface, (e) polymer fibers on 100 nm-structured (scratched) surface.[Reference Tseng, Ying, Hsu, Perez, Takacs, Bazan and Heeger20] (Reproduced with permission, copyright 2012 American Chemical Society.)
Matrix-assisted alignment
Matrix-assisted alignment of CP chains has been actively investigated. Because of their useful 1D pore structure, porous silica[Reference Wu, Gross and Tolbert23–Reference Martini, Craig, Molenkamp, Miyata, Tolbert and Schwartz25] and anodized aluminum oxide (AAO)[Reference Iacopino, Lovera, O'Riordan and Redmond26] have been used as a matrix or a template for directional CP alignment. CP chains have also been embedded in a polymer matrix followed by uniaxial tensile drawing,[Reference Hagler, Pakbaz, Voss and Heeger27, Reference Weder, Sarwa, Bastiaansen and Smith28] and blended into aligned LC molecules[Reference Zhu and Swager29] that result in directed CP alignment.
Tolbert and co-workers utilized hexagonal honeycomb structured porous silica to confine CP chains inside nanopores.[Reference Wu, Gross and Tolbert23–Reference Martini, Craig, Molenkamp, Miyata, Tolbert and Schwartz25] The silica framework was synthesized by co-assembly of silica precursors and organic surfactants via LC intermediate, followed by chemical cross-linking of the silica.[Reference Wu, Gross and Tolbert23] By facilitating growth on a rubbed polyimide substrate, the 1D pores of the silica framework are aligned parallel to the substrate.[Reference Molenkamp, Watanabe, Miyata and Tolbert24, Reference Martini, Craig, Molenkamp, Miyata, Tolbert and Schwartz25] Poly(2-methoxy-5-(2′-ethyl-hexyloxy)-1,4-phenylenevinylene) (MEH-PPV) solution was applied on the hydrophobized surface of the silica framework to fill the pores at an elevated temperature. The MEH-PPV that aligned inside the silica nanopores exhibited dichroic ratio of 5–6 in absorption.[Reference Molenkamp, Watanabe, Miyata and Tolbert24, Reference Martini, Craig, Molenkamp, Miyata, Tolbert and Schwartz25]Fig. 6 presents the anisotropic absorption properties under polarized light both vertical and parallel to the pore direction and the image of the nanoporous silica together with a schematic illustration of the aligned CPs in the silica nanochannels.
(a) Polarized absorption spectra of a MEH-PPV/aligned mesoporous silica composite film parallel (//) and perpendicular (⊥) to the pore direction. (b) TEM image of thin section of an aligned nanoporous silica film. (c) Schematic illustration of CP chains incorporation into the aligned nanoporous silica channels.[Reference Martini, Craig, Molenkamp, Miyata, Tolbert and Schwartz25] (Reproduced with permission, copyright 2007 Nature Publishing Group.)
Recently, Iacopino et al. reported highly aligned poly(9,9-dioctylfluorene) (PFO) nanofibers fabricated using AAO as a template.[Reference Iacopino, Lovera, O'Riordan and Redmond26] In this process, PFO nanofibers were prepared by solution wicking through AAO membranes (pore diameter 25 nm) and collected after dissolving AAO membranes by aqueous NaOH [Fig. 7(a)]. Because of the alignment of PFO chains during pore infiltration, the obtained PFO nanofibers have a highly anisotropic emission property. The PL intensity dichroic ratio is 15 [Figs. 7(b) and 7(c)], implying that CP chains are aligned in the direction of the pores by the flow field generated during the solution infiltration.
(a) A PFO nanofiber image under tapping-mode AFM. (b) Polarization PL image of a PFO nanofiber. VV refers that excitation and detection polarization are parallel to the nanofiber axis, and VH refers that excitation is parallel to the nanofiber axis but detection polarization is perpendicular to the nanofiber axis. (c) Polarized PL spectra for the same nanofiber.[Reference Iacopino, Lovera, O'Riordan and Redmond26] (Reproduced with permission, copyright 2014 American Chemical Society.)
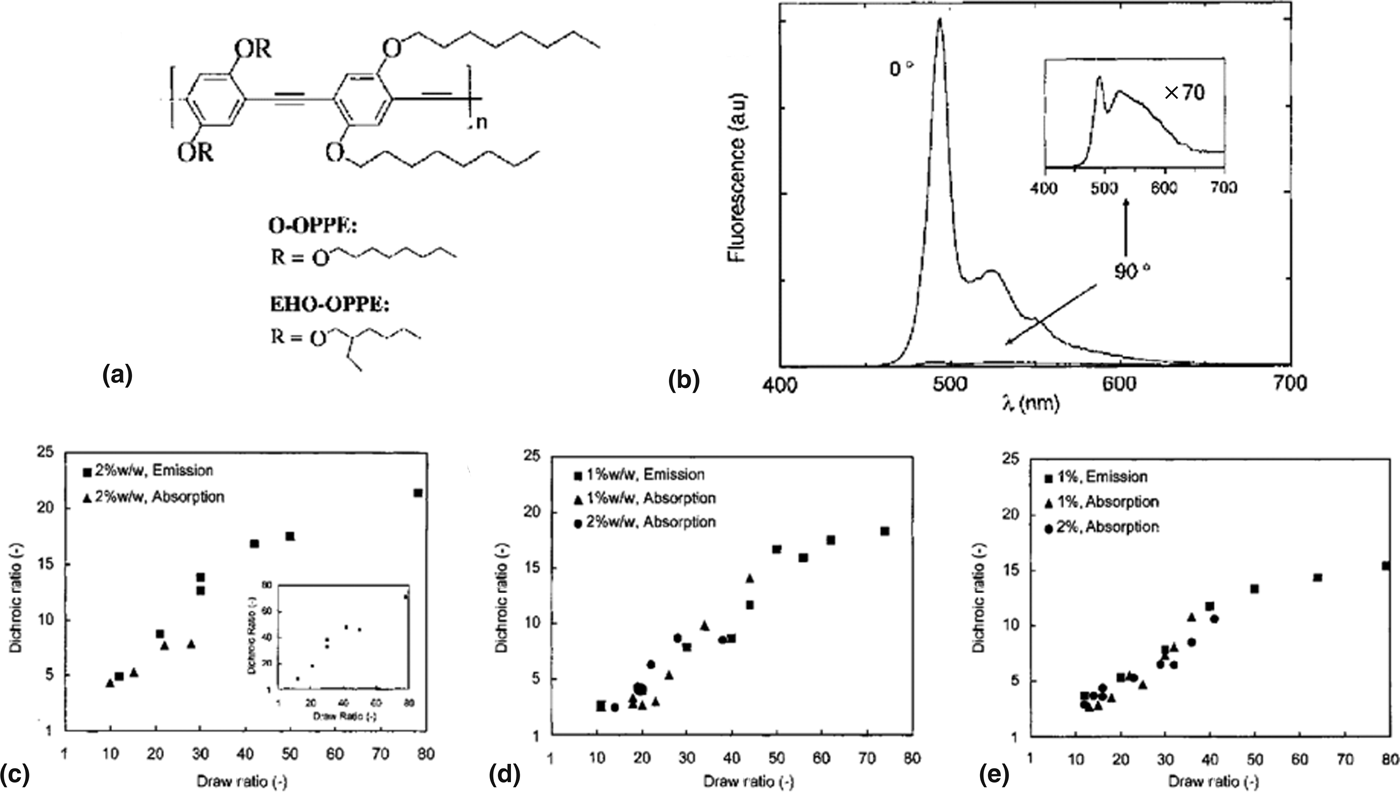
Tensile drawing of a host–guest system has also been demonstrated as an efficient CP alignment method. MEH-PPV[Reference Hagler, Pakbaz, Voss and Heeger27] and poly(2,5-dialkoxy-p-phenyleneethynylene)s (OPPEs)[Reference Weder, Sarwa, Bastiaansen and Smith28] are utilized as guest materials embedded in an ultrahigh molecular weight polyethylene (UHMW-PE) matrix followed by uniaxial tensile deformation at a temperature above T g of the incorporated CP and below the melting point (T m) of host polymer. Heeger and co-workers reported the uniaxial tensile drawing of MEH-PPV in UHMW-PE matrix, which showed highly anisotropic properties in both absorption and emission.[Reference Hagler, Pakbaz, Voss and Heeger27] MEH-PPV blend films were prepared as freestanding films and drawn at 110–120 °C to a draw ratio of 50 where the draw ratio is defined as the final length divided by initial length. An absorption dichroic ratio of about 5 was observed. Weder et al. utilized OPPEs as a guest CP in UHMW-PE matrix [Fig. 8(a)].[Reference Weder, Sarwa, Bastiaansen and Smith28] A huge dichroic ratio of 72 was achieved in emission from a tensile drawn film of 2 wt% of EHO-OPPE (M n = 84,000 g/mol) in UHMW-PE (draw ratio = 80) [Fig. 8(b)]. Furthermore, the relationships between the degree of alignment (dichroic ratio calculated by the integral of the PL spectra), draw ratio, molecular weight of OPPE, and type of side chain were systematically investigated [Figs. 8(c)–8(e)]. As the draw ratio was increased, the dichroic ratio initially increased linearly before it plateaued at a draw ratio of about 50. When comparing EHO-OPPE having M n of 10,000 and 84,000 g/mol, the larger molecular weight EHO-OPPE showed a higher alignment possibly due to the larger aspect ratio of CP chain [Figs. 8(c) and 8(d)]. In addition, a branched side chain (EHO-OPPE) was suggested to be more favorable than a linear side chain (O-OPPE) for CP alignment from tensile deformation of the host–guest polymer system [Figs. 8(d) and 8(e)].
(a) Chemical structure of OPPEs. (b) PL spectra of EHO-OPPE/UHMW-PE blend film recorded for emission parallel (0°) and perpendicular (90°) to the drawing direction. (c–e) Dichroic ratio (calculated from the integral of the respective spectra) as a function of draw ratio. (c) EHO-OPPE (M n = 84,000 g/mol) in UHMW-PE. Inset shows dichroic ratio calculated from PL intensity. (d) EHO-OPPE (M n = 10,000 g/mol) in UHMW-PE. (e) O-OPPE (M n = 10,000 g/mol) in UHMW-PE.[Reference Weder, Sarwa, Bastiaansen and Smith28] (Reproduced with permission, copyright 1997 WILEY-VCH Verlag GmbH & Co. KGaA, Weinheim.)
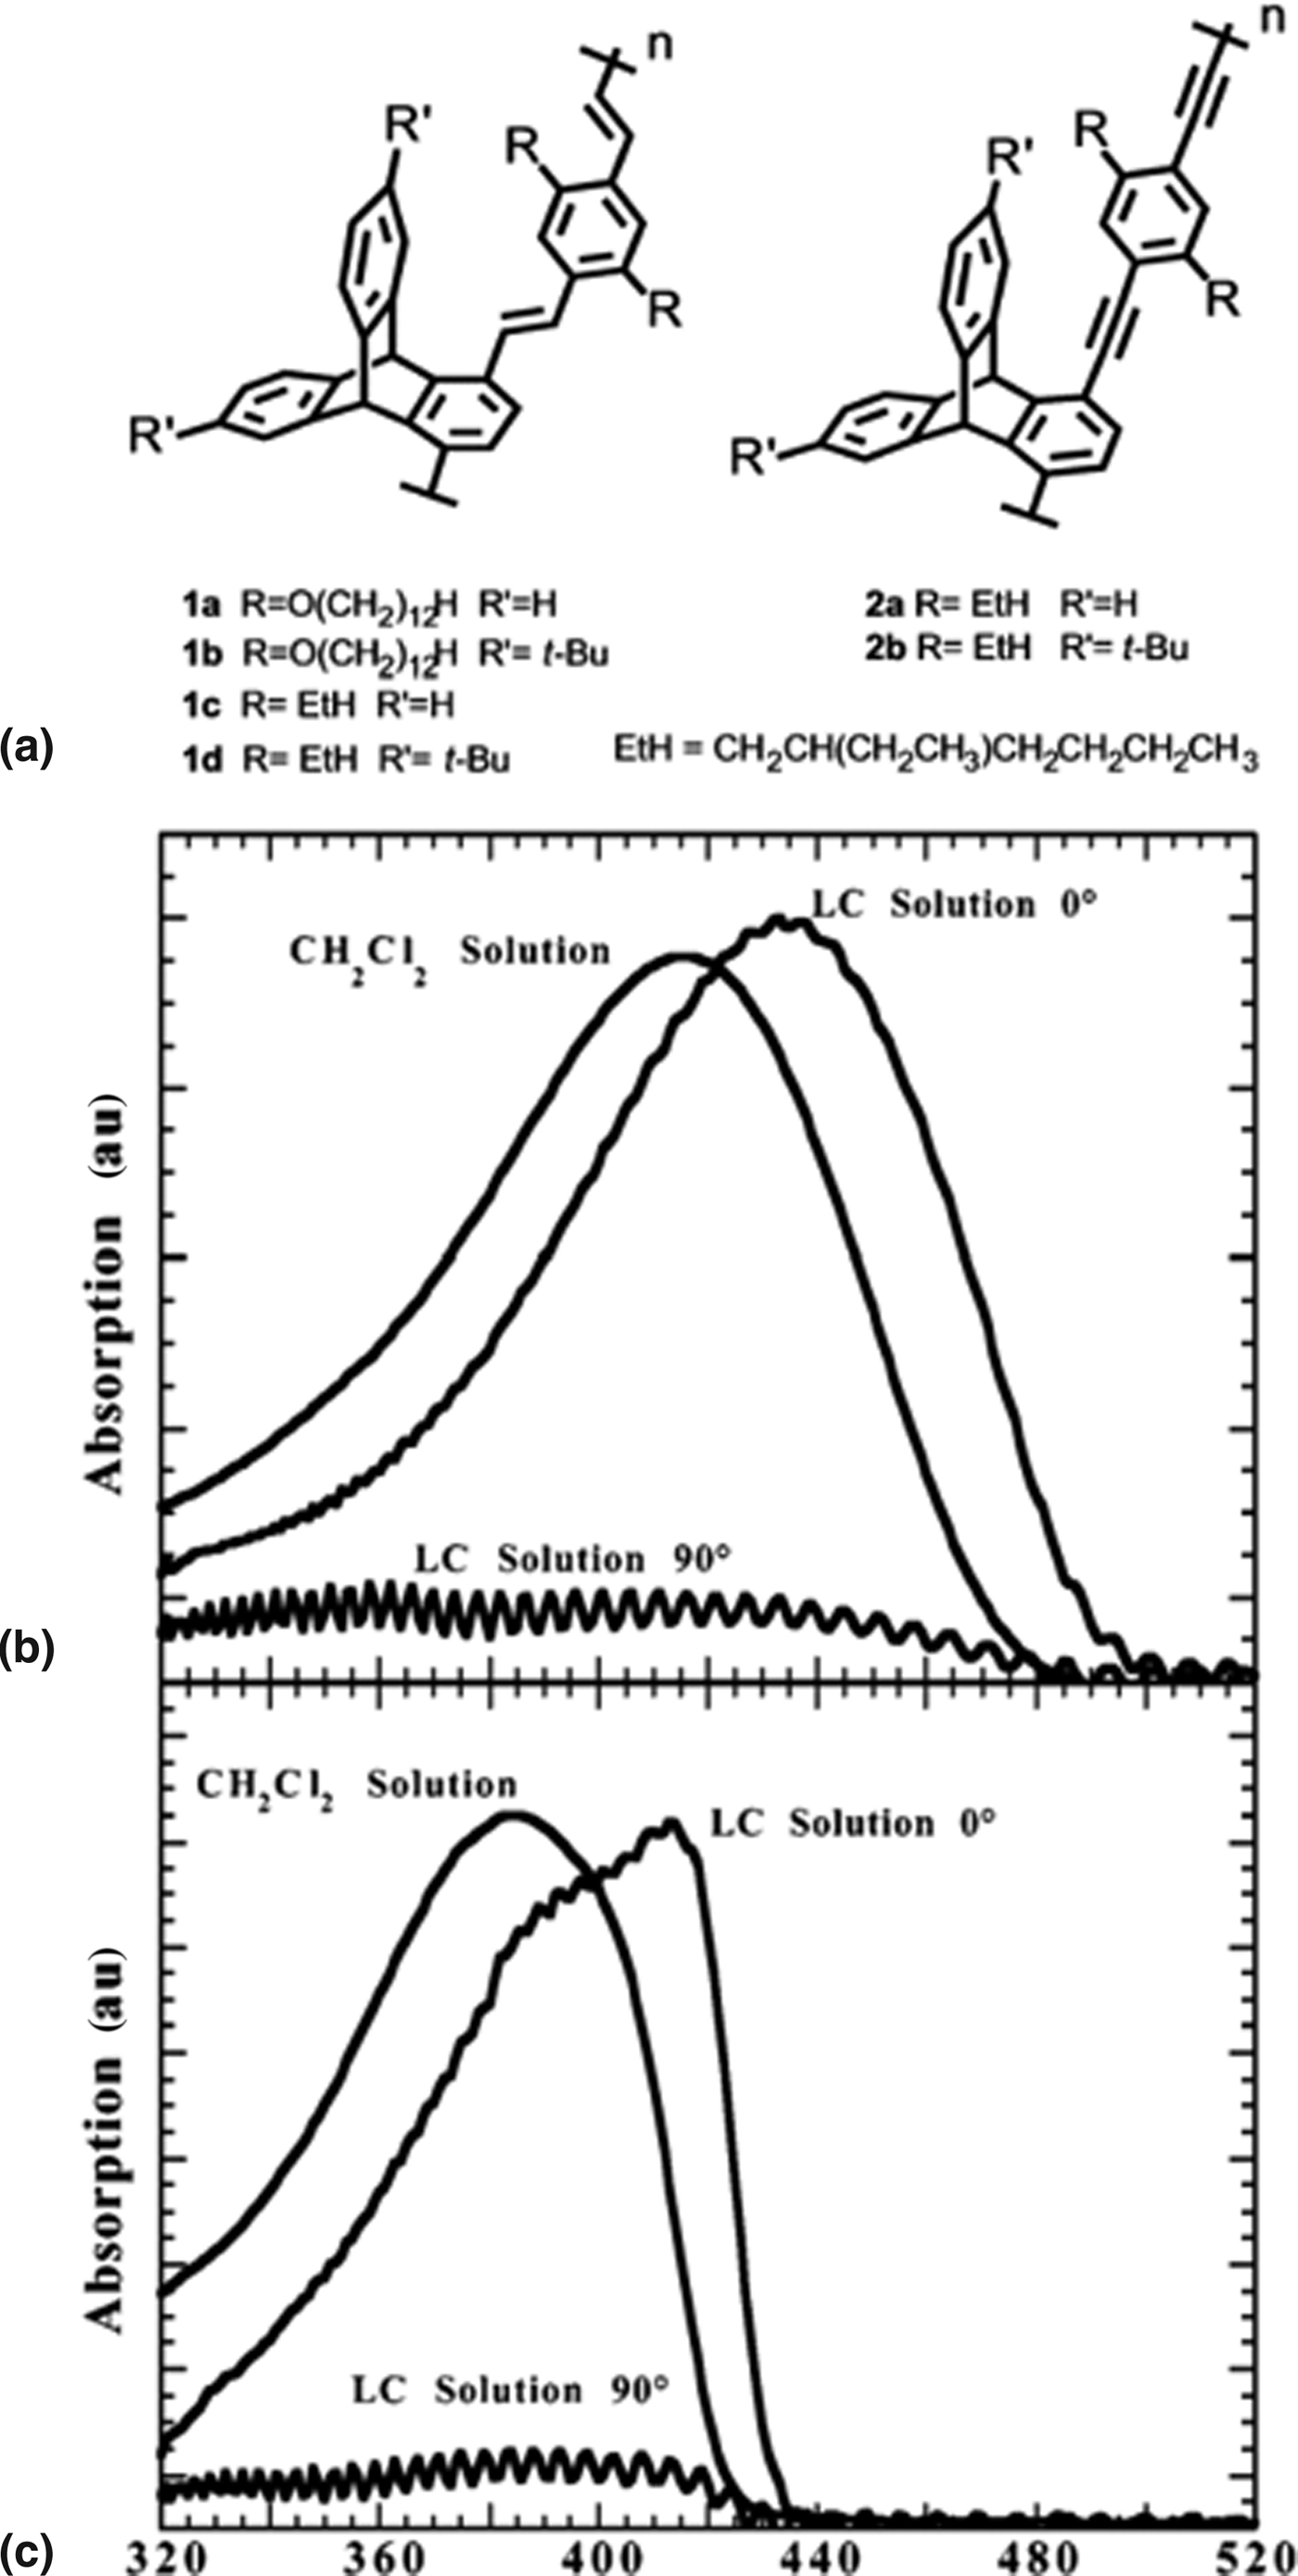
LC molecules were also used as a host to align a guest CP. Swager and co-workers reported PPV and PPE derivatives aligned in nematic LC molecule, 1-(trans-4-hexylcyclohexyl)-4-isothiocyanatobenzene (6CHBT) [Fig. 9(a)].[Reference Zhu and Swager29] The CPs were dissolved in the LC molecule and loaded into a LC cell having a rubbed polyimide surface. The homogenous alignment of the LC molecules ensured CP chain alignment together with an increase in effective conjugation length as illustrated in the UV–vis absorption spectrum [Figs. 9(b) and 9(c)].
(a) Chemical structure of PPV and PPE derivatives. (b) Absorption spectra of 1d in methylene chloride and 6CHBT. (c) Absorption spectra of 2a in methylene chloride and 6CHBT. Alignment is clearly observed from the ratio of spectra taken at 0° and 90° to the nematic director.[Reference Zhu and Swager29] (Rreproduced with permission, copyright 2002 American Chemical Society.)
Electrospinning
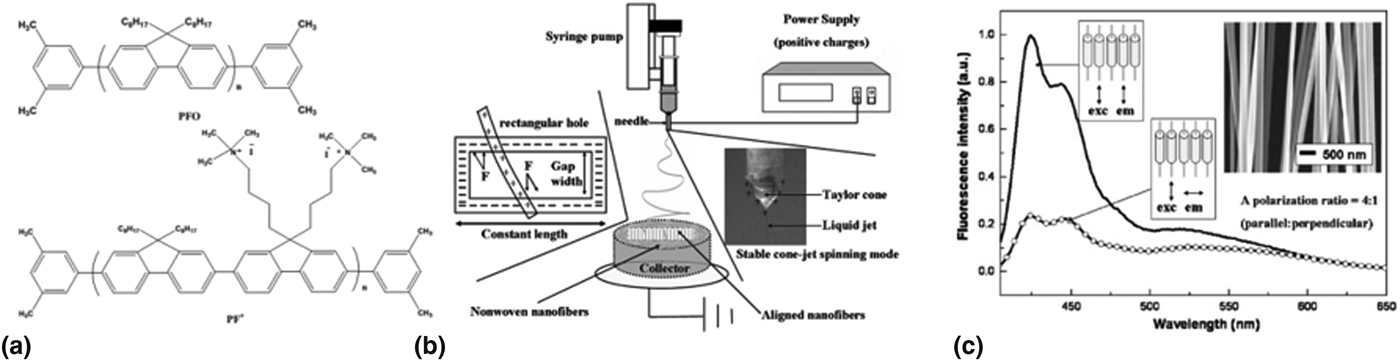
Alignment of electrospun nanofibers is another example of CP alignment. Generally, composite electrospun nanofibers containing CPs and spinnable polymers such as poly(methyl methacrylate) (PMMA)[Reference Kuo, Wang and Chen30] and poly(ethylene oxide) (PEO)[Reference Campoy-Quiles, Ishii, Sakai and Murata31, Reference Yin, Zhang, Lai, Zhong, Smith, Fong and Zhu32] are utilized for CP alignment. Chen and co-workers reported aligned eletrospun nanofibers from two types of polyfluorene/PMMA blends [Fig. 10(a)].[Reference Kuo, Wang and Chen30] A schematic representation of the electrospinning setup is illustrated in Fig. 10(b). The alignment of nanofibers spun from the syringe pump is ascribed to electrostatic force between the negatively charged collector gap edge and the positively charged nanofibers. In Fig. 10(c), PF+/PMMA nanofibers shows one-directional orientation with optical anisotropy (dichroic ratio = 4 in PL). Murata and co-workers demonstrated alignment of electrospun nanofibers of MEH-PPV/PEO blend.[Reference Campoy-Quiles, Ishii, Sakai and Murata31] The anisotropic emission property was investigated from aligned electrospun nanofibers as well as nanofibers that were stretched after electrospinning. The initial dichroic ratio in emission was observed as ca. 13.3 but increased to about 25 after stretching three times. In addition, Fong and co-workers reported highly anisotropic PL property from uniaxially aligned electrospun nanofibers of MEH-PPV and P3HT in PEO matrix [Fig. 11].[Reference Yin, Zhang, Lai, Zhong, Smith, Fong and Zhu32]
(a) Chemical structures of the polyfluorene derivatives. (b) Schematic illustration for electrospinning setup to produce aligned nanofibers. (c) Polarized PL from PF+/PMMA nanofiber. The inset shows SEM images of aligned nanofibers.[Reference Kuo, Wang and Chen30] (Reproduced with permission, copyright 2008 WILEY-VCH Verlag GmbH & Co. KGaA, Weinheim.)
(a) Polarized PL spectra for aligned MEH-PPV/PEO nanofibers. (b) Polarized PL spectra for aligned P3HT/PEO nanofibers.[Reference Yin, Zhang, Lai, Zhong, Smith, Fong and Zhu32] (Reproduced with permission, copyright 2011 The Royal Society of Chemistry.)
Directional solidification
Directional solidification here refers to the polymer alignment driven by heterogeneous nucleation followed by epitaxial crystallization of polymers onto a crystalline surface of aromatic molecules.[Reference Wittmann and Lotz33–Reference Dörling, Vohra, Dao, Garriga, Murata and Campoy-Quiles37] Previously, epitaxial growth of PE onto aromatic crystals[Reference Wittmann and Lotz33] and highly oriented microdomain of polystyrene (PS)-b-PE block copolymer using benzoic acid as a solvent and nucleation site for polymer crystallization[Reference De Rosa, Park, Thomas and Lotz34] have been demonstrated.
Brinkmann and Wittmann reported directional solidification of CP on aromatic crystals.[Reference Brinkmann and Wittmann35] In this method, 1,3,5-trichlorobenzene (TCB) was utilized as a solvent to crystallize rrP3HT. TCB powder was deposited on the drop cast rrP3HT film and heated until the TCB melts and dissolves the rrP3HT. Upon cooling the solution, the TCB crystallizes first and provides a foundation for the rrP3HT to nucleate and epitaxially crystallize. After the rrP3HT was completely crystallized, the TCB was removed by slow evaporation under vacuum. This method provided a well-defined fibrous rrP3HT film with clear birefringence present under a crosspolarizer.[Reference Brinkmann and Wittmann35]
In spite of efficient epitaxial crystallization of CP, this method suffers from a relatively complicated procedure, uncontrolled nucleation density, and only limited area of uniaxially aligned CP, all of which hamper efficient device application. Recently, directional solidification of spin casting and a blade coating method were developed using a mixed solvent system.[Reference Müller, Aghamohammadi, Himmelberger, Sonar, Garriga, Salleo and Campoy-Quiles36, Reference Dörling, Vohra, Dao, Garriga, Murata and Campoy-Quiles37] Müller et al. demonstrated a rather simplified method for directional solidification via spin casting using chlorobenzene (CB) and TCB as a mixed solvent for various CPs.[Reference Müller, Aghamohammadi, Himmelberger, Sonar, Garriga, Salleo and Campoy-Quiles36] In this system, the concentration of TCB in CB was revealed to be an important factor in the epitaxial crystallization of rrP3HT as well as in controlling the nucleation density. If the solution contains <4 vol% of TCB in CB, the spincast film did not show directional crystallization. The maximum nucleation density for rrP3HT was observed at 7.5 vol% of TCB with about 4–5 nucleation points per square centimeter. The optical anisotropy of a directionally solidified rrP3HT film is presented in Figs. 12(a) and 12(b). Furthermore, directional solidification of various CPs and CP:[6,6]-phenyl-C61-butyric acid methyl ester (PC61BM) blends was demonstrated using spin casting of a mixed solution [Fig. 12(c)]. The control of nucleation behavior in directional solidification was investigated using a blade coating of CB/TCB mixed solvent for rrP3HT.[Reference Dörling, Vohra, Dao, Garriga, Murata and Campoy-Quiles37] By controlling the blade speed under a specific ratio of the incorporated materials, the solvent drying character could be controlled, which enabled epitaxially crystallized CP films to be produced across several square centimeters. The CP crystallization induced by TCB crystals occurs randomly through the entire film when blade stroke is fast; however, if blade stroke is slow enough (1–2 mm/s), TCB nucleation is confined at the edge of the blade, so that uniaxially crystallized CP films are grown over the whole area (Fig. 13). A dichroic ratio of 3–4 was observed throughout the directionally solidified rrP3HT film fabricated by blade coating with CB solution containing TCB and rrP3HT (mass ratio 5:1) at the blade speed of 1 mm/s [Fig. 13].
(a) Polarized optical micrograph under single polarizer (black arrow) of spin-casted P3HT from TCB (7.5 vol%)/CB mixed solvent. (b) Polarized photometry measurements at a horizontal distance of 1 mm from a spherulite structure center (s-polarization horizontal and p-polarization vertical). (c) Cross-polarized micrographs of various CPs films fabricated by spin casting from CB or TCB/CB (a)spin casted from chloroform and TCB/chloroform).[Reference Müller, Aghamohammadi, Himmelberger, Sonar, Garriga, Salleo and Campoy-Quiles36] (Reproduced with permission, copyright 2013 WILEY-VCH Verlag GmbH & Co. KGaA, Weinheim.)
Polarized transmission images and cross-polarized micrographs of P3HT film deposited by different deposition speed under blade coating (solution: 20 mg/ml P3HT and m TCB/m P3HT = 5). Dichroic ratio (DR) was measured at 550 nm. Scale bar = 500 μm[Reference Dörling, Vohra, Dao, Garriga, Murata and Campoy-Quiles37] (Reproduced with permission, copyright 2014 The Royal Society of Chemistry.)
CP design for directed alignment
Some degree of CP alignment has been achieved by developing processes that help to align the CPs, so that they exhibit high anisotropic optical and electrical properties. However, the development of CP alignment methods without considering material design aspects cannot fully address this challenging issue. It is still unknown as to why some CPs can be aligned easily while others have much larger difficulties, and what causes the differences in the degree of alignment even when the same alignment strategies are applied. Investigation into the molecular design aspects for directed assembly and alignment of CPs has recently emerged.
Kim et al. reported a CP design principle for directed alignment.[Reference Kim, Jeong, Chung, Seo, Koo and Kim9] The synthesized CP, CP1, is designed to have a lyotropic LC phase [Fig. 14(a)]. Drop casting CP1 solution on a flat substrate showed distinctive alignment along the direction of the flow field generated by solvent evaporation. This is a very interesting phenomenon as the alignment from drop casting implies that CP1 has an intrinsic propensity for alignment without the aid of any specific alignment strategies. A systematic investigation was conducted on the molecular design features essential for this alignment tendency of CP1. From the characterization of CP1 and three different control CPs with modified chemical structures, it was revealed that three molecular design features are essential for directed alignment of CPs: (1) a concentration-induced chain planarization unit together with (2) a bulky side chain on a (3) out-of-plane tetrahedral carbon linker [Fig. 14(a)].
(a) Chemical structure of CP1 and three design requirements for directed alignment under shear flow. (b) Optical micrograph of an aligned CP1 film fabricated by contact coating (inset). (c) Emission spectra of aligned CP1 film through a linear polarizer (0° = parallel to the alignment direction and 90° = perpendicular to the alignment direction). (d) The suggested mechanism of CP1 alignment[Reference Kim, Jeong, Chung, Seo, Koo and Kim9] (Reproduced with permission, copyright 2013 Macmillan Publishers Limited.)
For a macroscopic alignment, CP chains should not form massive aggregations in the solution state, but should initiate gradual interchain interactions as the solvent evaporates. In a highly concentrated solution, the CP chains should form a lyotropic LC phase in which the CPs are still mobile, so that they can be aligned along the direction of any shear flow due to the large aspect ratio of the CP chains. Applying a contact coating on a lyotropic LC CP, such as CP1, caused directed self-assembly and alignment of the CPs [Figs. 14(b) and 14(c)]. During the contact coating, the three design requisites regulated the self-assembly of CP1 as follows [Fig. 14(d)]. The twisted phenyl ring of the main chain and the bulky side chain attached in an out-of-plane configuration efficiently prevented massive aggregation of CP1 in the solution state. As the solvent evaporated throughout the contact coating process, the solution concentration steadily increases, which forces the CPs to be packed increasingly closer together. This increasing proximity causes the CPs to undergo a conformational change and a reorientation to reduce their steric hindrance. During the conformational change, the phenyl rotation triggers an intramolecular S–F interaction, resulting in a planar conformation of the CP1 main chain. The planarized main chains promote interchain assembly via π–π interaction. However, the bulky side chains attached on the out-of-plane tetrahedral carbon suppress massive aggregation, which causes the mobile lyotropic LC nature of the CP1 chains and results in macroscopic alignment to the direction of the flow field.
Contact coating of CP1 solution on a Si substrate at 140 °C (gap 50 μm, blade speed 25 μm/s) produced an aligned CP1 film having highly anisotropic optical characteristic (dichroic ratio of 16.67 in emission) over a cm-scale area [Figs. 14(b) and 14(c)]. The alignment effect on the charge carrier mobility was tremendous. The aligned CP1 film exhibited about 1600 times higher hole mobility parallel to the alignment direction (μ h = 0.86 cm2/Vs) than the perpendicular to the alignment direction (μ h = 0.00054 cm2/Vs). The detailed charge mobility characteristics and OTFTs application will be discussed below in the application of CP alignment section. The structural analysis of the aligned CP1 film, characterized by grazing-incidence x-ray diffraction equipped with a 2D detector, revealed edge-on oriented lamellar packing of CP1 main chain aligned in parallel along the shear-flow direction.
Application of CPs alignment
Polarized OLEDs
Highly anisotropic optoelectronic characteristics of CPs have been widely investigated for various optoelectronic devices, including OLEDs, OTFTs, and OPVs. OLEDs have rapidly become an attractive research topic since polymer electroluminescence (EL) was reported by Burrhoughes et al.[Reference Burrhoughes, Bradely, Brown, Markay, Friend, Burns and Holmes38] Currently, OLEDs are used in EL displays, solid-state lighting, and backlight for liquid crystal displays (LCDs).[Reference Grell and Bradley39] Polarized LEDs are new comers and have a great potential as an efficient backlight for LCDs and other optical devices.[Reference Grell and Bradley39]
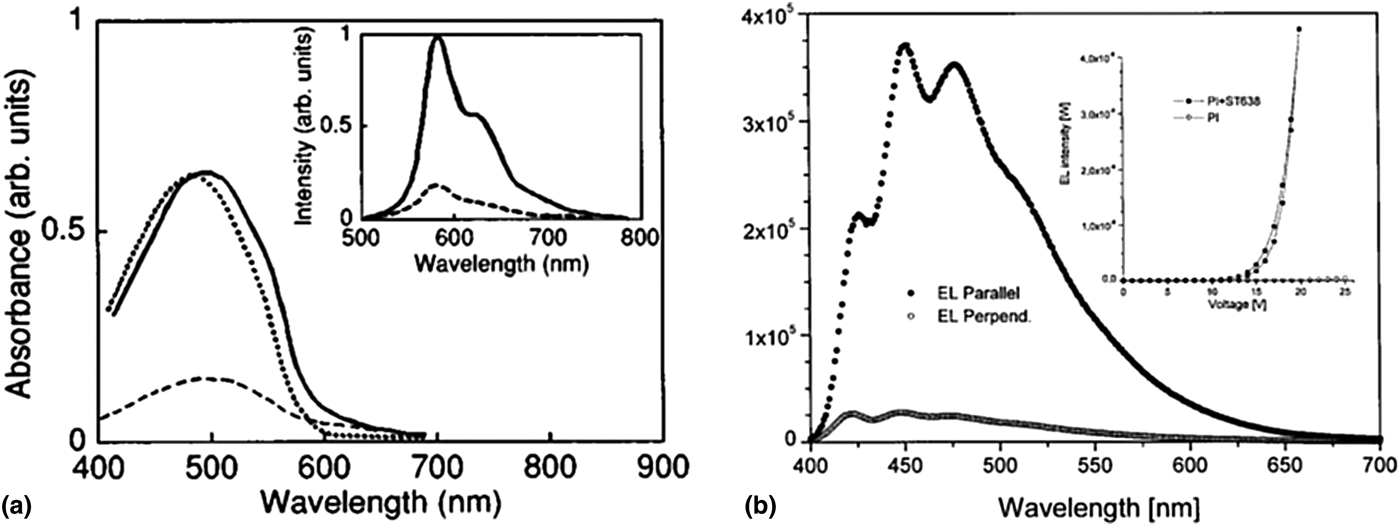
Inganäs and co-workers demonstrated the first possibility of a polarized light emission device by fabricating a aligned CP layer by tensile drawing and replacing the back polarizer and backlight of conventional LCDs with the aligned CP layer.[Reference Dyreklev, Berggren, Inganäs, Andersson, Wennerström and Hjertberg40] A solution of poly[3-(4-octylphenyl)-2,2′-bithiophene] (PTOPT) was spin coated (~50 nm) onto a PE film. The PE/PTOPT bilayer film was then uniaxially stretched. The resulting aligned bilayer was transferred onto an ITO substrate by mechanical pressing with thermal annealing. A dichroic ratio of 2.4 and EL efficiency of 0.1% were achieved at 9 V. The demonstrated polarized LED could simplify the LCD manufacturing process and reduce the fabrication cost as well. Yoshino and co-workers also reported polarized LEDs composed of an aligned poly(2,5-dinonyloxy-1,4-phenylenevinylene) (NO-PPV) as an emission layer prepared by mechanical rubbing and a 2-(4-biphenylyl)-5-(4-tert-butylphenyl)-1,3,4-oxadiazole-doped PS layer acting as an electron-transporting/hole-blocking layer.[Reference Hamaguchi and Yoshino41] A dichroic ratio of 4.0 was demonstrated [Fig. 15(a)]. However, the employed alignment methods such as tensile drawing and mechanical rubbing are generally not suitable for well-aligned CP films <1 μm thick, and controlling uniform film thickness is challenging.
(a) Optical absorption and PL spectra of the rubbed NO-PPV film. The inset shows PL spectra of the rubbed film. Incident light was polarized parallel (solid line) or perpendicular (dashed line) to the rubbing direction. Dotted line refers unrubbed film. (b) EL spectra of thermally aligned device ITO: (17% ST638/83% PI) rubbed : PF2/6 : Ca :Al with polarizer detection parallel or orthogonal to the rubbing direction. The EL polarization ratio for the 477 nm peak is 15. Inset: Luminescence/voltage characteristics for ITO : Alignment layer : PF2/6 : Ca : Al devices with 17% ST638 and without ST638 in the alignment layer.[Reference Hamaguchi and Yoshino41, Reference Grell, Knoll, Lupo, Meisel, Miteva, Neher, Nothofer, Scherf and Yasuda43] (Reproduced with permission, copyright 1995 American Institute of Physics and 1999 WILEY-VCH Verlag GmbH, D-69469 Weinheim.)
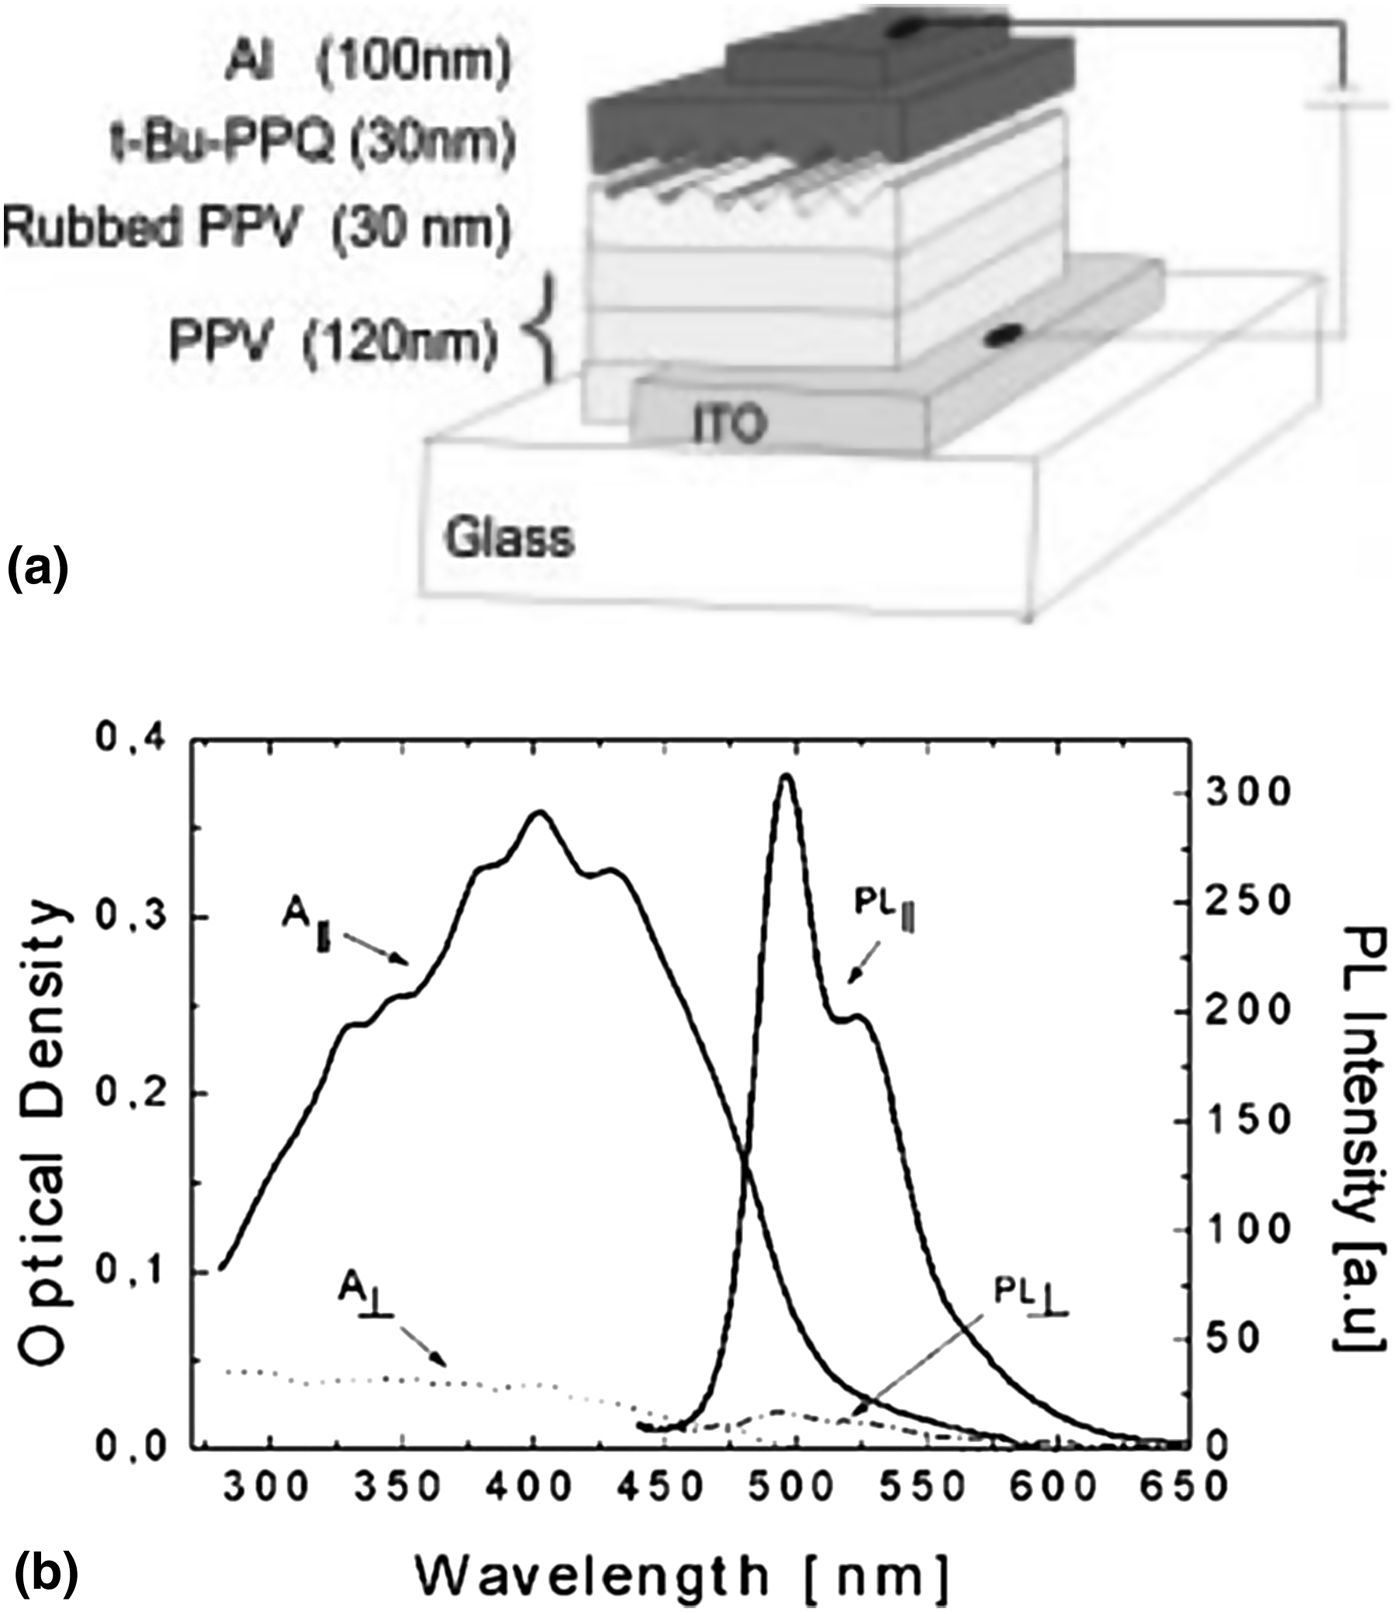
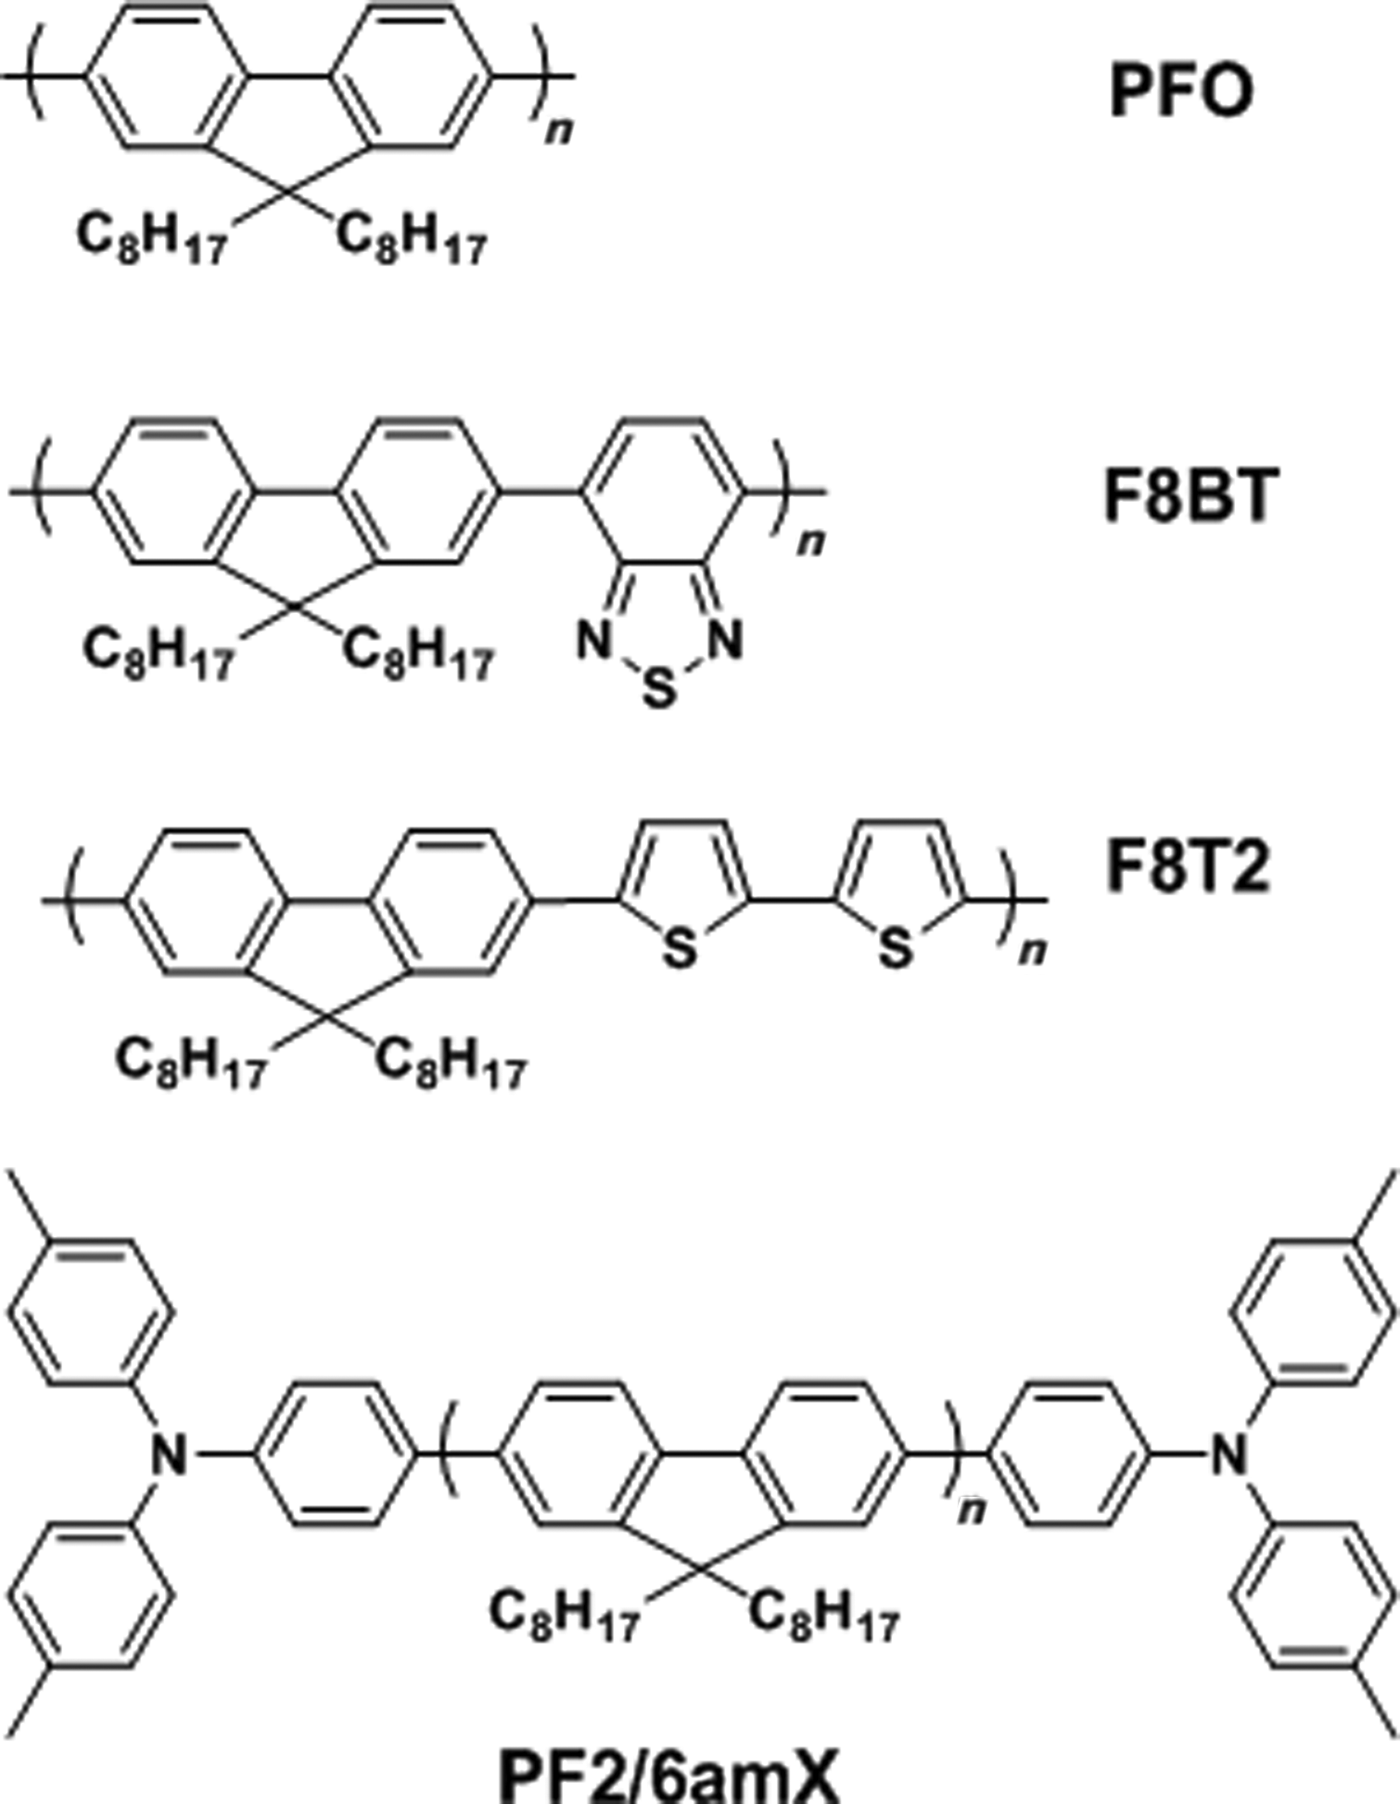
Rubbed polyimide has been used as a substrate for the alignment of conjugated molecules. Considering the insulating property of polyimide, hole-transporting materials (HTMs) such as N,N′-diphenyl-N,N′-bis [4′-(N,N-bis(naphth-2-yl)-amino)-biphenyl-4-yl]-benzidine (ST1163) and 4,4′,4″-tris(1-naphthyl)-N-phenyl-amino)-triphenylamine (ST638) are commonly added to increase its hole-transporting property. Bradley and co-workers[Reference Grell, Bradley, Inbasekaran and Woo42] and Knoll and co-workers[Reference Grell, Knoll, Lupo, Meisel, Miteva, Neher, Nothofer, Scherf and Yasuda43] investigated the glass-forming LC property and excellent hole transport mobility for polarized EL devices. Polarized EL devices were prepared by aligning PPV on a mechanically rubbed polyimide substrate having hole-conductors. The authors concluded that the hole-conductor filled rubbed polyimide film caused the CP alignment and enhanced hole-transporting properties. The highest dichroic ratio achieved was 15 (EL///EL⊥) and a brightness of 45 cd/m2 was reached at 19 V without a polarizer. Fig. 15(b) presents the EL spectra of the device measured in parallel and perpendicular to the polyimide rubbing direction. Rubbed PPV films have also been reported to act as an aligned emission layer and to have good hole-transporting properties.[Reference Blom, de Jong and Vleggaar44] Strohriegl and co-workers reported rubbing alignment of segmented precursor of PPV followed by thermal conversion to a fully conjugated segmented PPV for polarized two-layer LEDs.[Reference Jandke, Strohriegl, Gmeiner, Brütting and Schwoerer45]Fig. 16(a) shows the structure of the two-layered device. A dichroic ratio of 12 was achieved with a brightness of 200 cd/m2 [Fig. 16(b)]. Whitehead et al. also investigated using the rubbed PPV layer as a hole transporting layer as well as a LC alignment substrate for thermotropic LC CPs, PFO, F8BT, and F8T2 [Fig. 17].[Reference Whitehead, Grell, Bradley, Inbasekaran and Woo46, Reference Whitehead, Grell, Bradley, Jandke and Strohriegl47] Although the polarization effect of the resulting blue OLED was lower with an absorption dichroic ratio of 5, a brightness of 150 cd/m2 was achieved, which is significantly brighter than what was previously reported.[Reference Grell, Bradley, Inbasekaran and Woo42, Reference Grell, Knoll, Lupo, Meisel, Miteva, Neher, Nothofer, Scherf and Yasuda43]
(a) Structure of the two-layer device with rubbed PPV and (b) absorption and PL of a 40 nm thick rubbed PPV film parallel (A∥, PL∥) and perpendicular (A⊥, PL⊥) to the rubbing direction.[Reference Jandke, Strohriegl, Gmeiner, Brütting and Schwoerer45] (Reproduced with permission, copyright 1999 WILEY-VCH Verlag GmbH & Co. KGaA, Weinheim.)
Chemical structures of PFO, F8BT, F8T2, and poly[9,9-bis(2-ethylhexyl)fluorene-2,7-diyl] end-capped with N,N-bis(4-methylphenyl)-N-phenylamine (PF2/6amX, X = end-capper feed ratio).[Reference Whitehead, Grell, Bradley, Inbasekaran and Woo46, Reference Miteva, Meisel, Knoll, Nothofer, Scherf, Müller, Meerholz, Yasuda and Neher48] (Reproduced with permission, copyright 2000 Elsevier Science S.A. and 2001 WILEY-VCH Verlag GmbH, D-69469 Weinheim.)
Further improvement in device efficiency and lifetime was addressed by Neher and co-workers.[Reference Miteva, Meisel, Knoll, Nothofer, Scherf, Müller, Meerholz, Yasuda and Neher48] The author demonstrated that end capping the main chain of a polyfluorene homopolymer with a hole-transporting moiety led to significant improvement in device efficiency and color stability without changing the LC properties or the orientation of the end-modified polyfluorene derivative. The chemical structure of the end-capped polymer, PF2/6amX, is shown in Fig. 17. When PF2/6am9, having an end capper feeding ratio of 9 mol%, was aligned on a doped polyimide layer to build a polarized OLED, dichroic ratios of 22 and 15 with corresponding brightnesses of 200 and 800 cd/m2 both with efficiencies of 0.25 cd/A were achieved depending on the composition of the doped polyimide layer; 10 and 15 wt% of ST1163, respectively. These results were attributed to the efficient hole trapping at the end-capper group, which was calculated to be more than double what had been previously reported.[Reference Whitehead, Grell, Bradley, Jandke and Strohriegl47]
Even though the HTM doping enhances the hole-transporting property of polyimide alignment films, the rate of hole-transport of devices is still rather low, and the dichroic ratio of the aligned emitting layer on the HTM-doped polyimide alignment film decreased as the concentration of HTMs increased. Accordingly, the hole-current in the device is limited by the doped-polyimide rather than the active layer.[Reference Miteva, Meisel, Knoll, Nothofer, Scherf, Müller, Meerholz, Yasuda and Neher48] Therefore, a HTM itself was investigated as an alignment layer as well as a hole conducting layer. Wen and co-workers reported that poly(N-vinylcarbazole) (PVK) could be used as a hole-transporting alignment layer[Reference Chung, Wen, Chou and Guo49] as the carbazole group in PVK is considered to be a good HTM.[Reference Lee, Kang, Jeon, Song and Seoul50, Reference Guo, Chang, Yang, Kwong and Thompson51] Aligned PVK was employed as an extra hole-transporting alignment layer on top of a hole-injection layer of poly(3,4-ethylenedioxythiophene)-poly(styrenesulfonate) (PEDOT-PSS) by mechanical rubbing. A LC polyfluorene emission layer was spin coated and aligned on the hole-transporting PVK alignment layer. The fabricated polarized LEDs showed an excellent dichroic ratio of up to 25.7, brightness of 1000 cd/m2, and luminance efficiency of 0.31 cd/A with an optimized polyfluorene thickness of 45 nm.
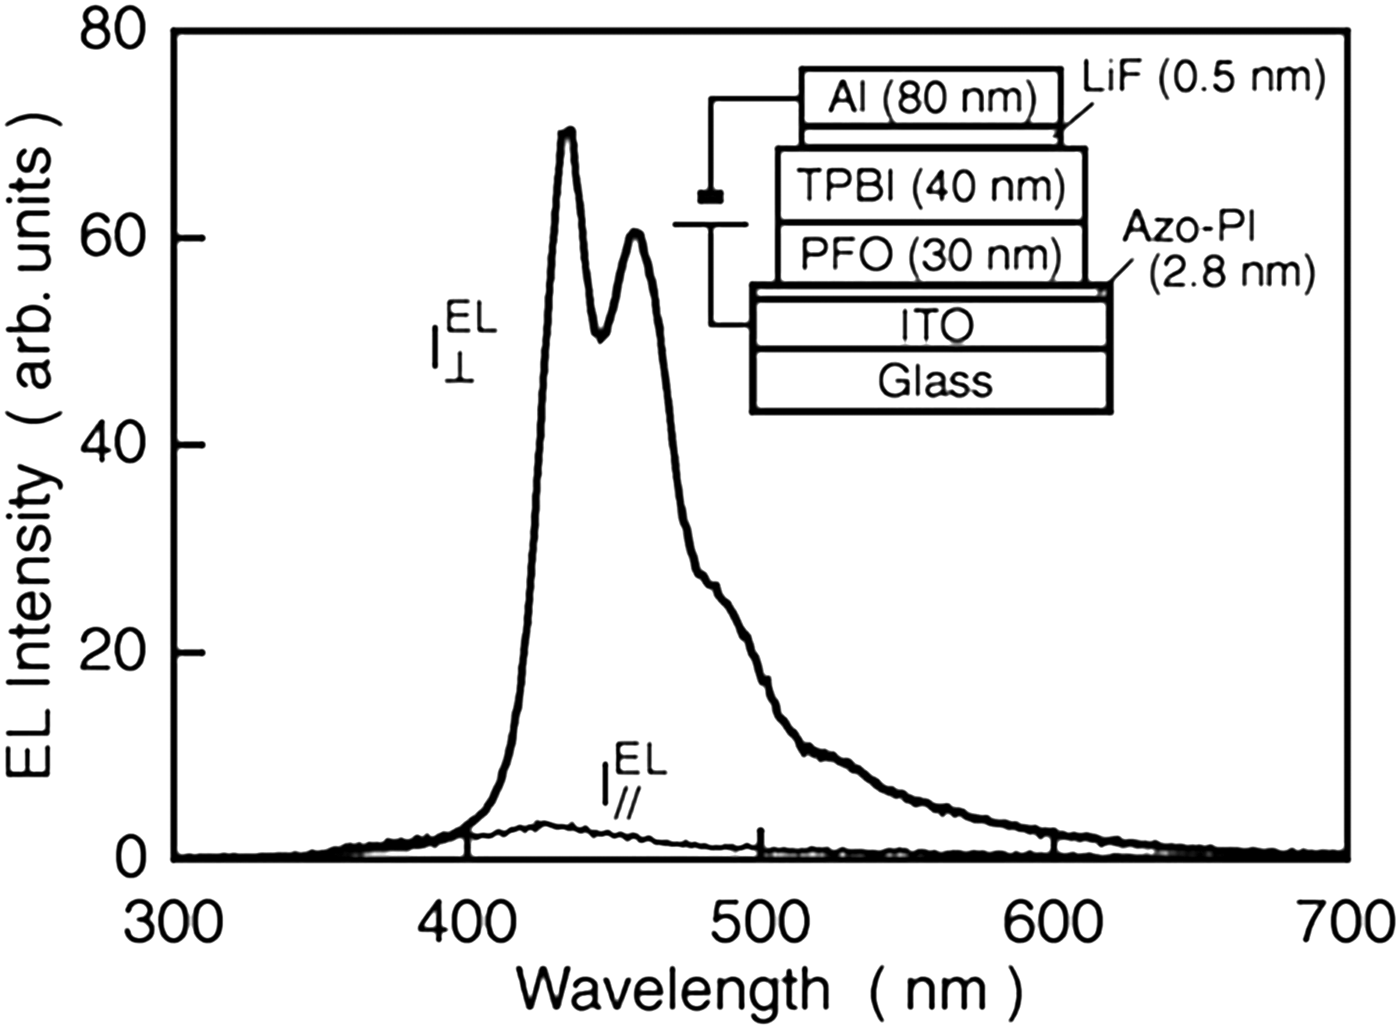
Photo-induced alignment of azobenzene has also been used to produce LC alignment layer instead of the traditional mechanical rubbing method. Sakamoto et al. synthesized a polyimide having azobenzene on the main chain (Azo-PI) and investigated the alignment of PFO on the photo-aligned Azo-PI.[Reference Sakamoto, Miki, Misaki, Sakaguchi, Chikamatsu and Azumi52] By using the photo-alignment method instead of conventional mechanical alignment, very thin yet effective PI alignment layers could be fabricated, allowing facilitated hole injection tunneling through the thin alignment layer. A 30 nm thick LC PFO emission layer was spin coated on the Azo-PI alignment layer followed by thermal treatment for LC phase formation and subsequent alignment. Fig. 18 shows the device structure composed of a 2.8 nm photo-aligned Azo-PI alignment layer and a highly oriented 30 nm PFO layer. The resulting polarized OLED showed dichroic ratio of 22 and brightness of 700 cd/m2. This study demonstrates that the use of a very thin alignment layer has the potential for polarizing LED.
EL spectra of the polarized OLED taken under a constant current condition of 0.2 mA. The device structure is shown in the inset. EL// and EL⊥ are the perpendicular and parallel components with respect to the polarization direction of the linearly polarized light, respectively.[Reference Sakamoto, Miki, Misaki, Sakaguchi, Chikamatsu and Azumi52] (Reproduced with permission, copyright 2007 American Institute of Physics.)
The CP nanofibers that were uniaxially aligned by electrospinning were investigated for the application of polarized PL. Murata and co-workers reported highly polarized PL from aligned MEH-PPV:PEO nanofibers fabricated by electrospinning followed by mechanical stretching.[Reference Campoy-Quiles, Ishii, Sakai and Murata31] The obtained degree of polarization was larger than 13 for the electrospun nanofibers and up to 25 when mechanical stretching was applied. Fong and co-workers also reported the preparation of uniaxially aligned and randomly overlaid nanofibers composed of MEH-PPV or P3HT together with PEO by means of electrospinning.[Reference Yin, Zhang, Lai, Zhong, Smith, Fong and Zhu32] The electrospun nanofibers of the CPs were collected using U-shaped collectors while electrospinning various ratios of CP and PEO solution. The diameter of nanofiber was relatively uniform without microscopic beading and/or beaded-nanofibers [Figs. 19(a)–19(f)]. The emission characteristics were affected by the mass ratio of MEH-PPV or P3HT to PEO. Fig. 19(g) and 19(h) show the PL spectra of the electrospun nanofibers with varying ratios of MEH-PPV or P3HT in a PEO matrix. A blue shift was observed when less aggregation was present and a lower mass ratio of MEH-PPV was used in the PEO matrix. In the case of P3HT, there was no significant change in spectra by varying the ratio of the P3HT:PEO blend. The aligned electrospun nanofibers with oriented molecular chains showed a highly polarized emission spectra. However, the investigation was not further expanded to any EL devices likely due to the insulating property of PEO.
SEM micrographs of electrospun MEH-PPV/PEO nanofibers: (a) aligned nanofibers and (b) random nanofibers of MEH-PPV/PEO (1 : 20 mass ratio); (c)–(f) aligned MEH-PPV/PEO nanofibers with mass ratios of 1 : 40, 1 : 20, 1 : 10, 1 : 4, respectively. The scale bar: 100 µm in (a) and (b) 5 µm in (c)–(f). PL spectra of electrospun nanofibers with various amounts of MEH-PPV (g) or P3HT (f) in PEO matrix.[Reference Yin, Zhang, Lai, Zhong, Smith, Fong and Zhu32] (Reproduced with permission, copyright 2011 The Royal Society of Chemistry.)
OTFTs
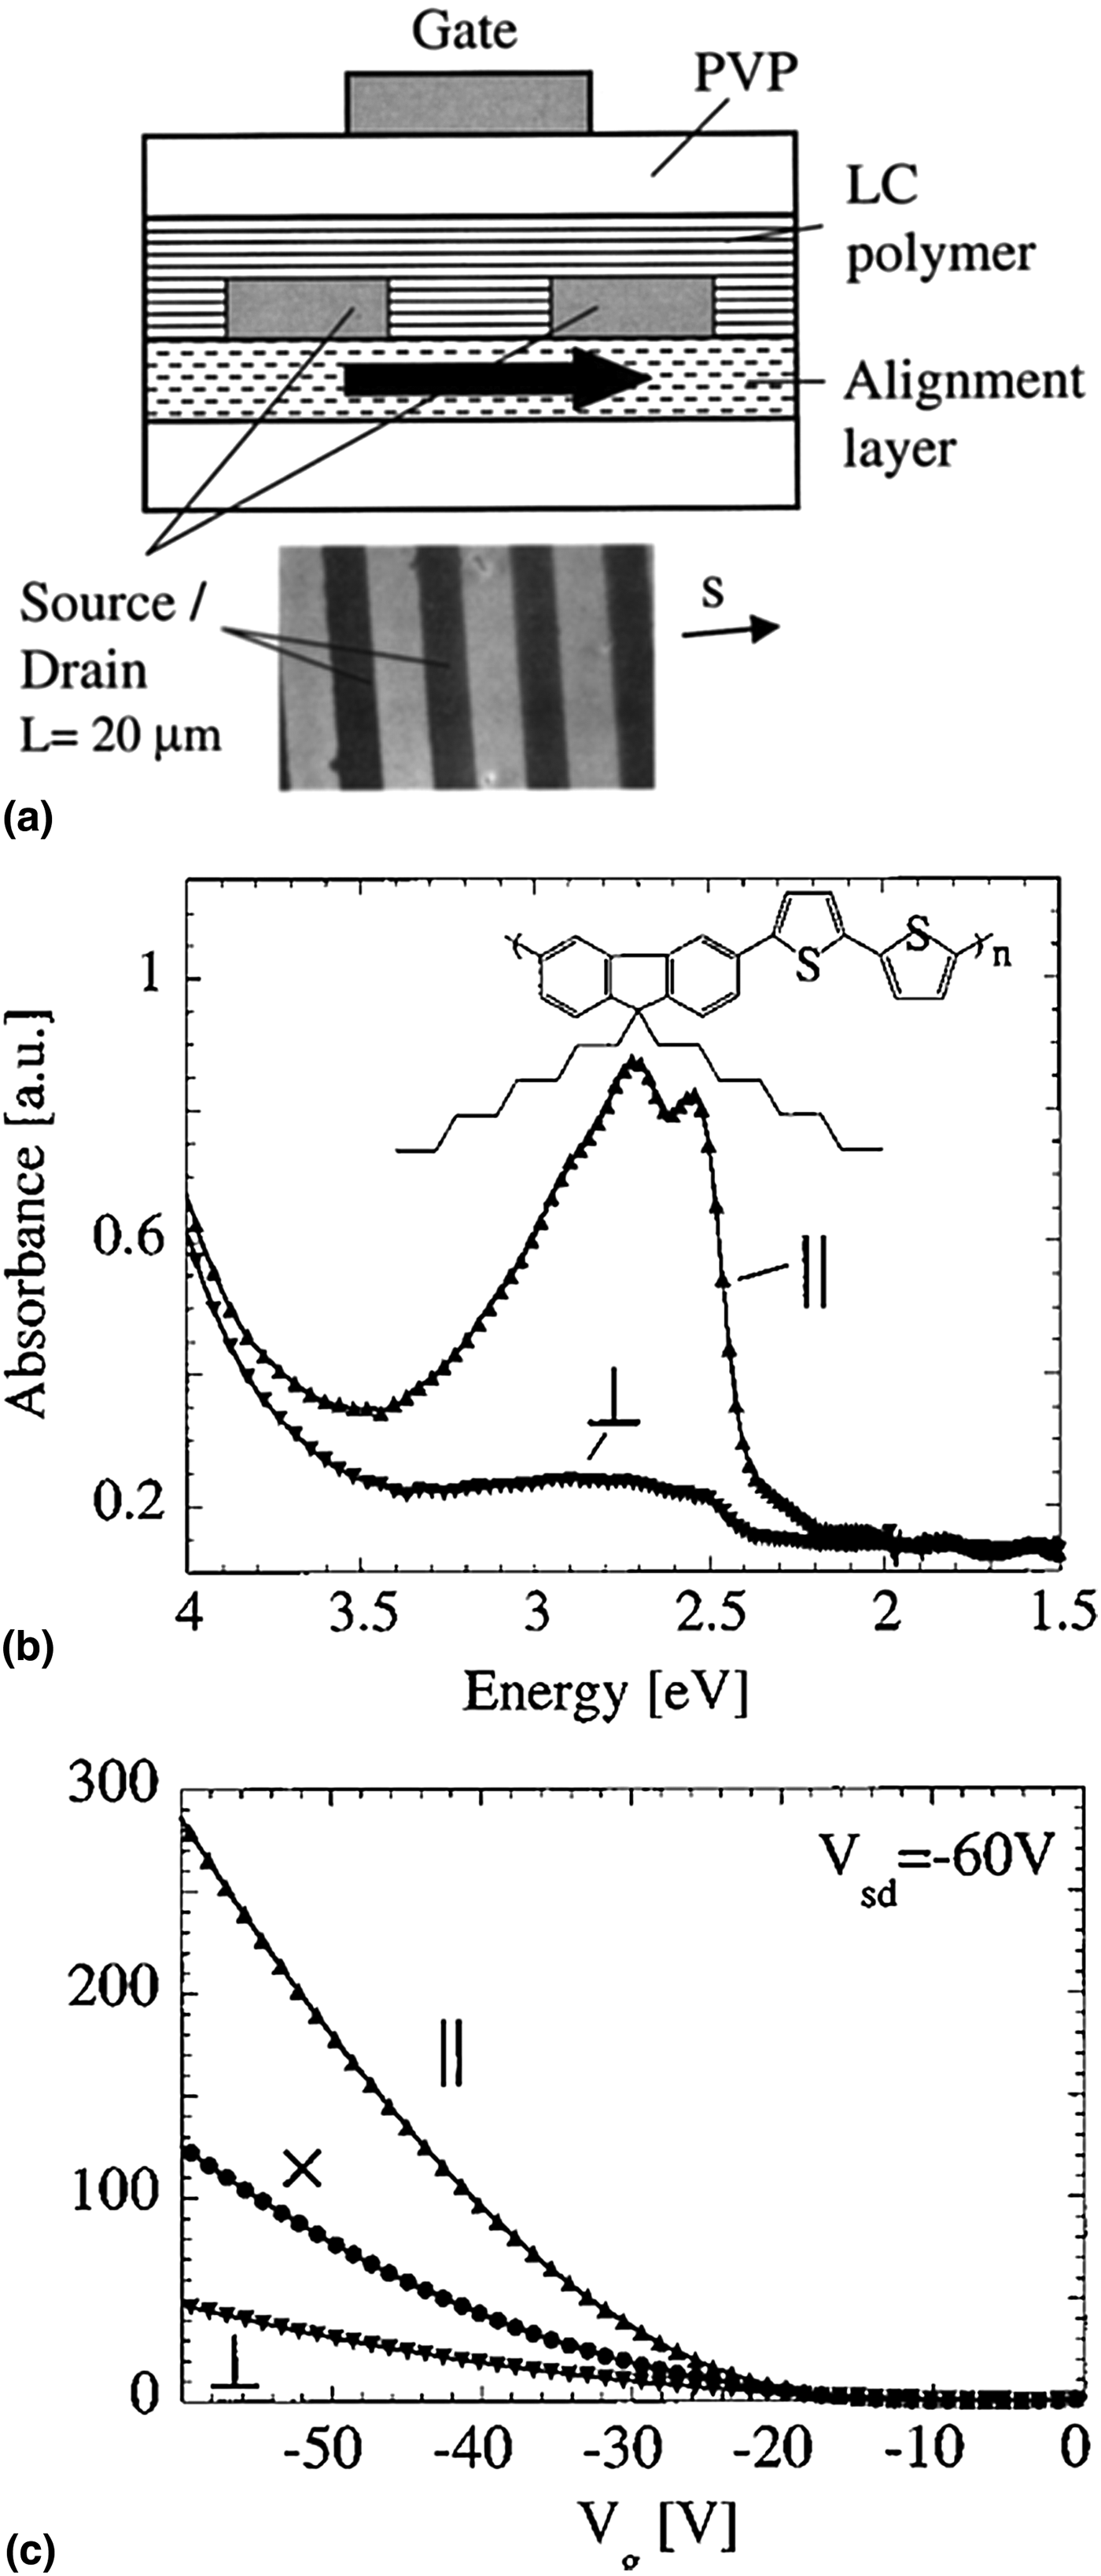
Alignment of CPs has been extensively studied to improve charge carrier mobility in OTFTs since CPs have become an important active component of OTFTs.[Reference Sirringhaus, Brown, Friend, Nielsen, Bechgaard, Langeveld-Voss, Spiering, Janssen, Meijer, Herwig and de Leeuw4, Reference Sirringhaus, Wilson, Friend, Inbasekaran, Wu, Woo, Grell and Bradley19, Reference Swiggers, Xia, Slinker, Gorodetsky, Malliaras, Headrick, Weslowski, Shashidhar and Dulcey53] In 1999, Bradely and co-workers reported more than one order of magnitude enhanced time-of-flight hole mobility from a homogeneously aligned PFO film on a mechanically rubbed polyimide alignment layer than had been previously reported.[Reference Redecker, Bradley, Inbasekaran and Woo54] PFO was first spin coated on the rubbed polyimide alignment layer and subsequently annealed at 200 °C for 10 h. The dichroic ratio of the aligned PFO film was 2.6 and its hole mobility was 8 × 10⁻³ cm2/Vs. Sirringhaus et al.[Reference Sirringhaus, Wilson, Friend, Inbasekaran, Wu, Woo, Grell and Bradley19] demonstrated successful alignment of F8T2, a CP having a nematic LC phase above 265 °C, to control the microstructure of the polymer layer in a TFT device. F8T2 was firstly spin coated on a rubbed polyimide alignment layer and thermally annealed at 275–285 °C for 3–15 min, resulting in spontaneous alignment of F8T2 chains. Fig. 20(a) shows a top-gate F8T2 TFT device fabricated on top of a polyimide alignment layer. Enhanced mobilities of μ // = 0.009 − 0.02 cm2/Vs were achieved along the parallel direction to the orientation, whereas significantly lower values, μ ⊥ = 0.001 − 0.002 cm2/Vs, were measured for the perpendicular direction [Fig. 20(b)]. The degree of anisotropy in the field-effect mobility was 5–8, and the mobility of the isotropic F8T2 device was μ x = 0.003 − 0.005 cm2/Vs [Fig. 20(c)]. Another LC CP, poly[2,5-bis(3-alkylthiophen-2-yl)thieno[3,2-b]thiophene] (PBTTT), was investigated to build OTFTs with a higher mobility.[Reference Lee, Gupta, Zhao, Heeney, McCulloch and Sirringhaus55] PBTTT has a rigid rod character and forms a dense side-chain interdigitation. PBTTT is also known to have higher field effect motilities and better environmental stability compared with other thiophene-based polymers.[Reference McCulloch, Heeney, Bailey, Genevicius, Macdonald, Shkunov, Sparrowe, Tierney, Wagner, Zhang, Chabinyc, Kline, McGehee and Toney3, Reference Hamadani, Gundlach, McCulloch and Heeney56, Reference Noh, Zhao, Caironi and Sirringhaus57] Uniaxial alignment of PBTTT was achieved by a zone-casting method onto a mica substrate followed by annealing at 275 °C [Fig. 21(a)]. This produced films with a smectic-like chain extended conformation in which the polymer chains assembled into crystalline nanoribbons with a characteristic width of 70–80 nm [Fig. 21(b)], equivalent to the length of the fully extended polymer chain backbone. The dichroic ratio of the ribbon phase PBTTT film was 6.6 [Figs. 21(c) and 21(d)], and a high mobility of up to 0.4 cm2/Vs was achieved by optimizing the channel interface. The aniosotropic mobility ratio was 3–5, which is interestingly close to the ratio of grain sizes along the two directions. Since the grain boundaries act as a charge-trapping site, the strong correlation between the anisotropic mobility ratio and the grain size is reasonably anticipated.
(a) Schematic diagram of a top-gate LC polymer TFT fabricated on top of a polyimide alignment layer. (b) Polarized optical absorption spectra at normal incidence in the metal-free region of a completed F8T2 TFT substrate. The incident light is polarized parallel (//) and perpendicular (⊥) to the rubbing direction. (c) Saturated transfer characteristics (V sd = −60 V) of aligned F8T2 TFTs with channels parallel (//) and perpendicular (⊥) to the alignment direction of polymer chains. Isotropic device without uniaxial alignment is also shown (x).[Reference Sirringhaus, Wilson, Friend, Inbasekaran, Wu, Woo, Grell and Bradley19] (Reproduced with permission, copyright 2000 American Institute of Physics.)
(a) Schematic diagram of zone-casting setup with parameters of T 1 = 100 °C, T 2 = 140 °C, v 1 = 20 μm/s, and v 2 = 15 μm/s. (b) AFM image of aligned ribbon-phase PBTTT deposited by zone casting (5 μm × 5 μm). (c) Optical micrograph of the aligned PBTTT film on top of LCD monitor, with zone-casting direction rotated perpendicular (left) and parallel (right) to polarization direction of light emitted from the LCD monitor (indicated by the yellow arrow). (d) Polarized UV–vis optical absorption spectrum of PBTTT films.[Reference Lee, Gupta, Zhao, Heeney, McCulloch and Sirringhaus55] (Reproduced with permission, copyright 2011 WILEY-VCH Verlag GmbH & Co. KGaA, Weinheim.)
Seggern and co-workers demonstrated an improved field-effect mobility in rrP3HT based transistors in which rrP3HT chains are mechanically rubbed with a piece of velvet to achieve macroscopic alignment.[Reference Heil, Finnberg, von Malm, Schmechel and Seggern13] Subsequent thermal annealing at high temperatures after the mechanical rubbing further enhanced the alignment. The dichroic ratio of the aligned rrP3HT film was 5.1 and its mobility was 1.43 × 10⁻³ cm2/Vs, whereas the mobility dropped down about two orders of magnitude (1.66 × 10⁻⁵ cm2/Vs) along the perpendicular to the alignment direction. Derue et al. applied the nanorubbing process to a rrP3HT thin film using an atomic force microscopy (AFM) tip operating in a contact mode, to assemble and orient rrP3HT in the thin films.[Reference Derue, Serban, Leclère, Melinte, Damman and Lazzaroni58]Fig. 22(a) shows the surface morphology of the nanorubbed rrP3HT thin films. The difference in light absorption intensity indicates the alignment of the rrP3HT chains induced by the mechanical rubbing at the nanoscale. The orientated polymer chains within the rubbed zone were examined using cross-polarized optical microscopy [Fig. 22(b)]. All the nanorubbed domains appeared to have high birefringence, indicating that orientation of the polymer chains was induced by the nanoscale rubbing process [Fig. 22(c)]. The mobility of the nanorubbed rrP3HT device was 6.4 × 10⁻³ cm2/Vs, whereas the homogeneous rrP3HT device was 2.6 × 10⁻³ cm2/Vs.
(a) 10 × 10 μm2 and 2.5 × 2.5 μm2 AFM height (left) and phase (right) images of a nanorubbed area. The vertical gray scale is 10 nm. Inset: Fourier transform of the height image. (b) Optical micrographs between crossed polarizers for P3HT films with four 10 × 10 μm2 rubbed squares. The crossed polarizers are oriented as shown by the white arrows. (c) Schematic representation of the P3HT chain arrangement when the nanorubbing is performed parallel (left) and perpendicular (right) to the source–drain axis.[Reference Derue, Serban, Leclère, Melinte, Damman and Lazzaroni58] (Reproduced with permission, copyright 2008 Elsevier B.V.)
Heeger and co-workers used the directional solvent evaporation method to align high molecular weight regioregular PCDTPT (rrPCDTPT) (M n = 300,000 g/mol) for an active semiconducting layer in TFT.[Reference Tseng, Ying, Hsu, Perez, Takacs, Bazan and Heeger20, Reference Tseng, Phan, Luo, Wang, Perez, Patel, Ying, Kramer, Nguyen, Bazan and Heeger21]Fig. 5(a) shows a schematic illustration of the channel-like configuration setup. Surface grooves were first introduced on the SiO2 gate dielectric layer by scratching the surface with diamond lapping films. Fig. 5(c) and 5(e) show the surface morphology of the scratched SiO2 layer and the rrPCDTPT thin-film fabricated on the scratched SiO2 layer by the directional solvent evaporation. The rrPCDTPT thin film shows the formation, anisotropic order, and macroscopic alignment of rrPCDTPT fibers. The mobility of the device with aligned rrPCDTPT having the large molecular weight of 300,000 g/mol was 6.7 cm2/Vs, while the mobility of as high as 23.7 cm2/Vs was achieved from the aligned rrPCDTPT having the molecular weight of 50,000 g/mol. The conclusion drawn from these data was that very high molecular weight rrPCDTPT is not necessary to achieve high mobilities through CP alignment in the directional solvent evaporation method.
Recently, Kim et al. reported the lyotropic LC CP design principle to achieve directed CP assembly and alignment [Fig. 14(a)].[Reference Kim, Jeong, Chung, Seo, Koo and Kim9] CP1 exhibited directed alignment under shear flow via lyotropic LC formation. To prepare the aligned CP1 device, a contact coating system that could adjust both the coating speed and the thickness of the film was used. Fig. 23(a) and 23(b) show the performance of the aligned CP1 device when the CP1 chains were oriented parallel to the source–drain direction. The fastest hole mobility of 0.86 cm2/Vs was obtained along the polymer alignment direction, which is more than three orders of magnitude higher than the slowest hole mobility of 0.54 × 10⁻³ cm2/Vs extracted from the perpendicular direction to the polymer alignment [Figs. 23(c) and 23(d)].
(a) Output curve of a TFT device built on the aligned CP1 film. The source–drain direction is parallel to the CP1 alignment direction. (b) Transfer curve of a TFT device with a source–drain oriented parallel to the CP1 alignment direction. (d) Transfer curve of a TFT device having a source–drain oriented perpendicular to the CP1 alignment direction. (d) Hole mobility of TFT devices depending on the orientation of the source–drain relative to the CP1 alignment direction. The double-headed blue arrow is the source–drain direction.[Reference Kim, Jeong, Chung, Seo, Koo and Kim9] (Reproduced with permission, copyright 2013 Macmillan Publishers Limited.)
Polarizing organic photovoltaic devices (ZOPVs)
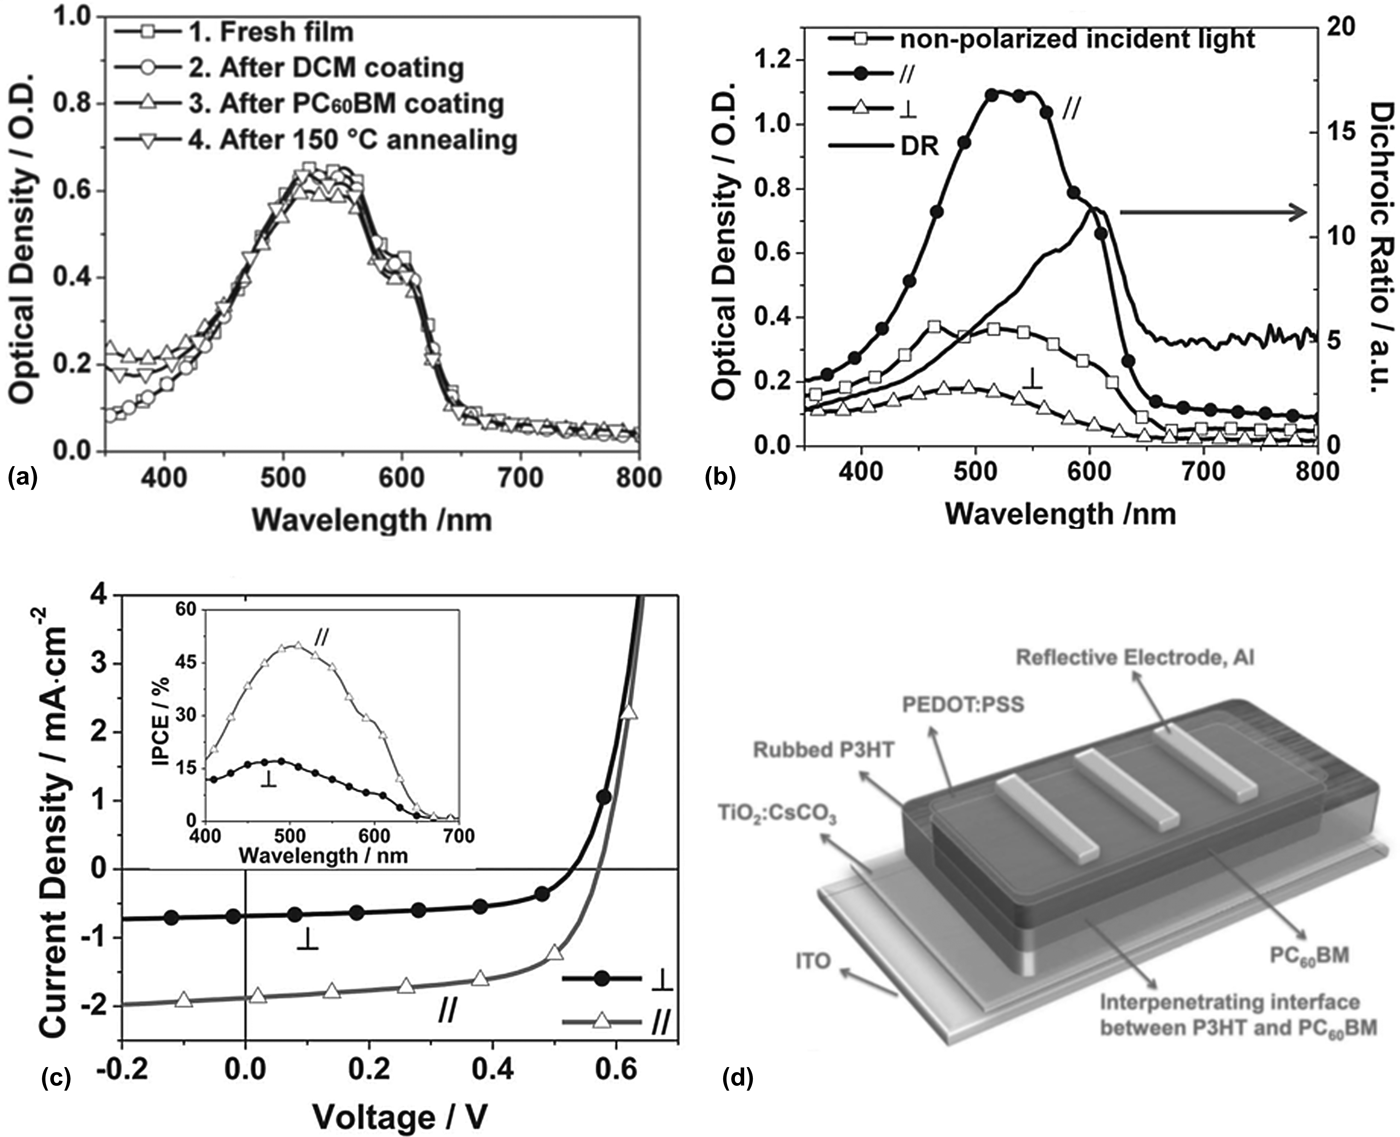
LCDs are the most widely used information display devices to date. Unfortunately, LCDs are energy inefficient because 75% of the light from the backlight device is lost due to the two absorptive polarizers. Yang and co-workers and Park and co-workers investigated an innovative idea to replace the backlight unit and one polarizer with ZOPV so that energy generation and brighter emission for highly efficient LCDs can be achieved.[Reference Zhu, Kumar and Yang59–Reference Huh, Shin, Kim and Park61] Since it is known that ZOPV films can be made by uniaxial orientation of CPs, rubbed P3HT films have been commonly used for ZOPVs. Fig. 24(d) shows the schematic illustration of the ZOPV fabricated by Yang and co-workers.[Reference Zhu, Kumar and Yang59] The polarizing P3HT (z-P3HT) film was prepared by spin-casting a 2 wt% P3HT solution in CB, followed by annealing at 150 °C for 10 min. The P3HT film was subsequently rubbed gently with a velvet cloth 80 times at 150 °C. The dichroic ratio of the z-P3HT film was 14.3. To characterize the PV performance of the ZOPV devices prepared with a reflective electrode, a polarizer was placed between the devices and a light source to provide polarized incident light. The polarized light intensity was approximately 33 mW/cm2. The ZOPV device generated a short-circuit current density (J sc) of 1.88 mA/cm2, power conversion efficiency (η e) of 2.00%, open circuit voltage (V oc) of 0.57 V, and fill factor (FF) of 62.2% under polarized light parallel to the rubbing direction. In contrast, when tested under polarized light perpendicular to the rubbing direction, the J sc was only 0.68 mA/cm2, with a η e of 0.63%, V oc of 0.53 V, and FF of 58.5%. The ratio of J sc(p) to J sc(s) is 2.76. The ideal energy recycling efficiency of the ZOPV devices was calculated to be > 10% [Figs. 17(a)–(c)]. Park and co-workers fabricated ZOPV films by spin-casting a blended solution of P3HT (2.40 wt%) and PC61BM (1.76 wt%) in 1,2-dichlorobenzene.[Reference Park, Huh and Shin60, Reference Huh, Shin, Kim and Park61] Alignment of the photoactive P3HT:PC61BM layer was achieved by unidirectionally rubbing the layer three times using a roller covered with a cotton velvet under the pressure of about 120 g/cm2 and the substrate-moving speed of 10 mm/s at 110 °C [Fig. 25(a)]. Fig. 25(b) shows the textures of the rubbed P3HT:PC61BM layer before and after the rolling and Fig. 25(c) shows polarizing optical microscope images of the aligned film observed at four different angles of rotation. The dichroic ratio of the rubbed P3HT:PC61BM film was 3.04. The PV performance of the ZOPV devices was characterized with linearly polarized incident light (about 26.1 mW/cm2) parallel (//) and perpendicular (⊥) to the rubbing direction of the P3HT:PC61BM layers, respectively. The ZOPV device generated J sc of 1.81 mA/cm2 under the polarized light in parallel to the rubbing direction, with a η e of 2.13%, V oc of 0.62 V, and FF of 50.0%. When tested under perpendicularly polarized light, the J sc was only 1.03 mA/cm2, with a η e of 1.34%, V oc of 0.58 V, and FF of 46%. In this case, the ratio of J sc(//) to J sc(⊥) is 1.39, which is much smaller than the dichroic ratio of 3.04. The results of these two research groups suggest that ordered PV layers can form the basis for energy-harvesting and polarization-dependent optoelectronic applications such as reflective solar-LCDs.
(a) Absorption of P3HT films upon different treatments. (b) Polarized absorption of the quasi-bilayer P3HT-PC61BM film after annealing at 150 °C for 5 min. (c) Dichroic J–V characterization of the inverted quasi-bilayer ZOPV devices with reflective electrodes; inset: polarizing IPCE spectra and (d) inverted quasi-bilayer ZOPV device architecture using reflective Al electrode.[Reference Zhu, Kumar and Yang59] (Reproduced with permission, copyright 2011 WILEY-VCH Verlag GmbH & Co. KGaA, Weinheim.)
(a) Schematic illustration of rubbing process for in-plane aligned PV layers. (b) AFM images of the reference layer (left panel) and the rubbed sample layer (right panel). The x-axis represents the direction of rubbing. (c) Polarizing microscopic textures of the sample layer at four angles of rotation of the layers under an optical polarizing microscope. The white arrows indicate the rubbing direction and the orientation of the crossed polarizers is shown by the crossed arrows (A, P).[Reference Huh, Shin, Kim and Park61] (Reproduced with permission, copyright 2012 Optical Society of America.)
Recently, Dörling et al. prepared uniaxially aligned P3HT layers by directional epitaxial crystallization of a P3HT solution in CB containing TCB as a crystallizing additive. By blade coating the solution, an aligned P3HT layer was incorporated into ZOPV devices.[Reference Dörling, Vohra, Dao, Garriga, Murata and Campoy-Quiles37] The dichroic ratio of the aligned P3HT layer was 2.6. The ZOPV device yielded a J sc of 1.10 mA/cm2 under polarized light in parallel to the alignment direction, with a η e of 0.67%, V oc of 0.56 V, and FF of 47.20%. When tested under perpendicularly polarized light, the J sc was only 0.72 mA/cm2, with a η e of 0.38%, V oc of 0.52 V, and FF of 43.2%. The ratio of J sc(//) to J sc(⊥) was 1.53. Even though the PV performance was worse than aforementioned ZOPVs, the fabrication method is much simpler and more economic for building ZOPV devices.
Practical application of alignment strategies
The reviewed alignment strategies have demonstrated enhanced optical and electrical properties via effective CP alignment; however, actual device applications of the alignment strategies presented here may be still challenging. One of the most frequently used processes for device fabrication is the alignment of various CPs by means of a rubbed polyimide layer. However, as polyimide is an insulator, this method can restrict device performance and the freedom of device architecture. Several approaches have been proposed to resolve this issue. First, a polyimide layer was doped with hole-transporting molecules to enhance its charge-transporting property.[Reference Grell, Knoll, Lupo, Meisel, Miteva, Neher, Nothofer, Scherf and Yasuda43, Reference Miteva, Meisel, Knoll, Nothofer, Scherf, Müller, Meerholz, Yasuda and Neher48] To enable hole injection by tunneling through a thin modified polyimide layer, a very thin polyimide alignment layer was also devised.[Reference Sakamoto, Miki, Misaki, Sakaguchi, Chikamatsu and Azumi52] In addition, rubbed CP or hole transporting PVK layers have been utilized as alternatives to the insulating polyimide layer.[Reference Whitehead, Grell, Bradley, Inbasekaran and Woo46, Reference Whitehead, Grell, Bradley, Jandke and Strohriegl47, Reference Chung, Wen, Chou and Guo49] Pre-patterned substrates would be one candidate to replace the insulating polyimide layer as reported.[Reference Tseng, Ying, Hsu, Perez, Takacs, Bazan and Heeger20–Reference Luo, Kyaw, Perez, Patel, Wang, Grimm, Bazan, Kramer and Heeger22]
The matrix used for CP alignment and geometry of the aligned CPs are also important factors for versatile device application. Techniques such as tensile drawing and electospinning have shown large improvements in optical anisotropy via CP alignment.[Reference Hagler, Pakbaz, Voss and Heeger27, Reference Weder, Sarwa, Bastiaansen and Smith28, Reference Kuo, Wang and Chen30–Reference Yin, Zhang, Lai, Zhong, Smith, Fong and Zhu32] However, the matrix polymers, including PE, PMMA, and PEO, are insulating materials which hinder electrical device application. Similarly, aligned CP fibrils obtained from electrospinning[Reference Kuo, Wang and Chen30–Reference Yin, Zhang, Lai, Zhong, Smith, Fong and Zhu32] and AAO templated CP alignment[Reference Iacopino, Lovera, O'Riordan and Redmond26] require additional processing to be used in optoelectronic devices due to non-flat geometry.
The LB technique enables the formation of a well-aligned monolayer of CP film,[Reference Cimrová, Remmers, Neher and Wegner10, Reference Kim, McHugh and Swager11] but the LB technique is not practical due to the delicacy of the technique and extensive time requirement for sufficiently thick layer formation. Directional solidification[Reference Brinkmann and Wittmann35, Reference Müller, Aghamohammadi, Himmelberger, Sonar, Garriga, Salleo and Campoy-Quiles36] may also suffer from random nucleation of CPs on the substrate which could cause uncontrolled alignment direction. Therefore, developing additional processing strategies such as directional solidification by blade coating as suggested in Ref. Reference Dörling, Vohra, Dao, Garriga, Murata and Campoy-Quiles37 is desired for practical application.
On the other hand, the lyotropic LC CP design for directed alignment[Reference Kim, Jeong, Chung, Seo, Koo and Kim9] provides a relatively wide room for device application. Development of various processing strategies beyond contact coating is highly desirable for advanced applications of lyotropic LC CPs such as nanopatterned CP alignment.
Conclusion
CPs having a 1D p-orbital overlap along the main chain exhibit anisotropic absorption, emission, and charge mobility. To fully utilize the anisotropic properties of CPs in device applications, various processing methods for CP alignment have been investigated over the past several decades. In this review, LB, mechanical rubbing, nanoimprinting, eletrospinning, directional solidification, pre-patterned substrate templates, and matrix-assisted alignment have been discussed as effective methods for allowing macroscopic alignment of CPs needed for the application of anisotropic optoelectronic characteristics. In addition, the material design principle of lyotropic LC CPs for directed CP alignment has also been discussed. The amorphous nature of polymers combined with the strong aggregation propensity of CPs make macroscopic alignment of CPs a very challenging task. Parallel synergic development of CP alignment processing strategies and molecular design principles of self-assembling and organizing CPs would accelerate the implementation of the anisotropic optoelectronic properties of CPs required for device applications. For representative applications of aligned CPs in devices, largely improved device performance of OLEDs and OTFTs, and unique functional ZOPVs via macroscopic CP alignment has been discussed.
Acknowledgments
This work was supported by US Department of Energy (DOE), Office of Basic Energy Sciences, as part of the Center for Solar and Thermal Energy Conversion in Complex Materials, an Energy Frontier Research Center (grant no. DE-SC0000957).