I. INTRODUCTION
The pharmaceutical of interest in this study is baricitinib, C16H17N7O2S (systematic name 2-[1-ethylsulfonyl-3-[4-(7H-pyrrolo[2,3-d]pyrimidin-4-yl)pyrazol-1-yl]azetidin-3-yl]acetonitrile; CASRN 1187594-09-7), whose molecular structure is illustrated in Figure 1. Marketed under the brand name Olumiant, baricitinib is an immunosuppressant approved in 2017 for the treatment of moderate-to-severe rheumatoid arthritis (RA) that has not responded to tumor necrosis factor antagonist drugs (Dougados et al., Reference Dougados, van der Heijde, Chen, Greenwald, Drescher, Liu, Beattie, Witt, de la Torre, Gaich, Rooney, Schlichting, de Bono and Emery2017). The orally administered drug selectively inhibits cytoplasmic Janus kinase 1 and 2, which serve a critical role in the phosphorylation of signaling cytokine receptors (Stebbing et al., Reference Stebbing, Krishnan, de Bono, Ottaviani, Casalini, Richardson, Monteil, Lauschke, Mirazimi, Youhanna and Tan2020). Through this inhibition, baricitinib blocks proinflammatory mediators involved with autoimmune conditions such as RA. Other potential baricitinib applications include federal authorization for SARS-CoV-2 treatment as a supplement to remdesivir and ongoing research developments for treating dermatitis and lupus (Markham, Reference Markham2017). The present work to understand the structure of this important drug molecule was carried out as part of a larger project (Kaduk et al., Reference Kaduk, Crowder, Zhong, Fawcett and Suchomel2014) to determine the crystal structures of large-volume commercial pharmaceuticals and to include the high-quality powder diffraction data collected for this purpose in the Powder Diffraction File (Gates-Rector and Blanton, Reference Gates-Rector and Blanton2019).
2D structure of the baricitinib molecule.

The preparation of baricitinib was described in US Patent 8,420,629 B2 (Rodgers and Shepard, Reference Rodgers and Shepard2013) but no XRD data were provided. A crystalline form of baricitinib was claimed in US Patent 9,938,283 B2 (Pandey et al., Reference Pandey, Singh and Prasad2018) and a powder pattern was reported. The international equivalent to this patent is WO 2015/166434 A1. Baricitinib polymorph A and a preparation method were claimed in Chinese patent CN10569373A (Ren et al., Reference Ren, Yi and Yao2016), which also includes powder data.
Drugs and candidate drugs, such as baricitinib, are often administered and studied in their powder form in which they are present as a polycrystalline solid comprised of many microcrystals that are too small to isolate and study individually. The crystal form generally refers to a specific repeating structural arrangement of molecules in three-dimensional space, which influences the mechanical and physical properties of a drug. Molecules contained within the crystal lattice are held together by intermolecular forces that minimize the free energy of the solid, including electrostatic interactions, non-covalent interactions, and hydrogen bonds (Sheth and Grant, Reference Sheth and Grant2005). Variations in packing give rise to differences in energy between different unique crystal forms, therefore affecting the chemical reactivity, surface and kinetic properties that need to be optimized during drug development. The existence of different crystal forms of a drug (polymorphs) can also lead to phase transformations that must be controlled during the manufacturing of active pharmaceutical ingredients (APIs). Therefore, an understanding of crystal structure is required for developing and optimizing the functionality of a drug (Zhang et al., Reference Zhang, Law, Schmitt and Qiu2004).
Additionally, the origin of the mechanical properties of active pharmaceutical ingredients is best understood through their crystal structures, as the presence of hydrogen bonding or hydrate water molecules impacts their hardness and tensile strength (Bag et al., Reference Bag, Chen, Sun and Reddy2012). Crystal structure models can also be used to predict mechanical properties, although the ability to deliberately engineer crystals with optimized properties is limited. Solving the API crystal structure provides a starting point for assessing and improving the mechanical properties of drug formulations.
The crystal structure of baricitinib has not been solved previously due to several crystallographic challenges. First, the compound is not available in a morphology suitable for single crystal diffraction, which generally requires the growth of crystals at least 50 μm in size. Instead, the API is only available in its polycrystalline form, making powder X-ray diffraction (PXRD) the most accessible method for structural characterization. While powder diffraction data can be readily collected, it is necessary to solve an unknown three-dimensional structure using the one-dimensional data of the powder diffraction pattern. In pharmaceutical APIs, large unit cells and weak scattering from light atoms add to the challenges of structure solution and structure refinement. Nevertheless, advances in the availability of data from synchrotron radiation sources, together with increasing power of data analysis software make the task feasible, if not yet routine. In this study, we seek to solve and validate the crystal structure of baricitinib from powder diffraction data collected on the polycrystalline form of this drug. This powder diffraction data is analyzed through the direct-space approach of simulated annealing and Rietveld refinement that can surmount the challenges involved in the structure solution of organic molecules.
II. EXPERIMENTAL
Baricitinib was purchased as a commercial reagent from TargetMol (Lot #120474) and was used as-received. The white powder was packed into a 1.5 mm diameter Kapton capillary that was rotated at ~50 Hz during measurements. Its powder pattern was measured at 295 K at beamline 11-BM (Antao et al., Reference Antao, Hassan, Wang, Lee and Toby2008; Lee et al., Reference Lee, Shu, Ramanathan, Preissner, Wang, Beno, Von Dreele, Ribaud, Kurtz, Antao, Jiao and Toby2008; Wang et al., Reference Wang, Toby, Lee, Ribaud, Antao, Kurtz, Ramanathan, Von Dreele and Beno2008) of the Advanced Photon Source at Argonne National Laboratory using a wavelength of 0.458133(2) Å. Data were collected from 0.5 to 50° in 2θ with a step size of 0.001° and a counting time of 0.1 s per step. The high-resolution powder diffraction data were acquired using twelve silicon crystal analyzers that allow for high angular resolution, high precision, and accurate peak positions. A silicon (NIST SRM 640c) and corundum (SRM 676a) standard (ratio Al2O3:Si = 2:1 by weight) were used to calibrate the instrument and refine the monochromatic wavelength used in the experiment.
The resulting pattern was first indexed using the singular value decomposition algorithm of TOPAS V6 (Coelho, Reference Coelho2018) and the candidate cell in space group C2/c was validated through Pawley refinement in TOPAS. A starting model for the 3D structure of the baricitinib molecule was obtained from PubChem (2021), where the atom positions appear to be based on an optimization using the MMFF94 force field (Halgren, Reference Halgren1996). Bond lengths and angles from this model were used as input for the simulated annealing software DASH (David et al., Reference David, Shankland, van de Streek, Pidcock, Motherwell and Cole2006). The structure solved in this manner was then optimized through Rietveld refinement in TOPAS using a Z-matrix description of the molecule. Following solution, the structure was transformed using PLATON (Spek, Reference Spek2009) to the reduced cell in I2/a.
The experimentally refined crystal structure was optimized using density functional theory (DFT) methods, using VASP (Kresse and Furthmüller, Reference Kresse and Furthmüller1996) (fixed experimental unit cell) through the MedeA graphical interface (Materials Design, 2016). This calculation was carried out on 16 2.4 GHz processors (each with 4 GB RAM) of a 64-processor HP Proliant DL580 Generation 7 Linux cluster at North Central College. The calculation used the GGA-PBE functional, a plane wave cutoff energy of 400.0 eV, and a k-point spacing threshold of 0.5 Å−1 that led to a 4 × 1 × 2 mesh and took ~85 h to converge. A single-point density functional calculation (fixed experimental cell) and population analysis were then carried out using CRYSTAL17 (Dovesi et al., Reference Dovesi, Erba, Orlando, Zicovich-Wilson, Civalleri, Maschio, Rerat, Casassa, Baima, Salustro and Kirtman2018). The basis sets for the H, C, and O atoms in the calculation were those of Gatti et al. (Reference Gatti, Saunders and Roetti1994) and the set for S was that of Peintinger et al. (Reference Peintinger, Vilela Oliveira and Bredow2013). The calculations were run on a 3.5 GHz PC using 8 k-points and the B3LYP functional and took ~2.5 h to complete.
III. RESULTS AND DISCUSSION
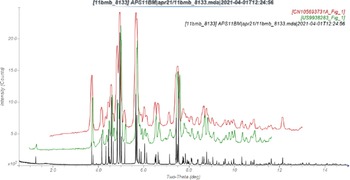
This synchrotron diffraction pattern of this study is similar enough to the diffraction patterns reported by Ren et al. (Reference Ren, Yi and Yao2016) and Pandey et al. (Reference Pandey, Singh and Prasad2018) to conclude that they represent the same material (Figure 2). The solution is presented in space group I2/a (#15) with a = 11.81128(11), b = 7.06724(6), c = 42.5293(3) Å, β = 91.9280(4)°, V = 3548.05(5) Å3, and Z = 8. A reduced cell search in the Cambridge Structural Database (Groom et al., Reference Groom, Bruno, Lightfoot and Ward2016) yielded one hit for a molecule that was clearly unrelated. The Pawley fit gave a residual R wp of 9.425% (χ 2 = 2.71) which was significantly higher than the expected R exp of 5.73% that would be achieved if statistical noise in the raw data was the only deviation from the computed model. Indeed, there were several impurity peaks visible, with a total area on the order of 1% of the measured pattern less background. The impurity is as-yet unidentified.
Overlay of the current data with figures showing powder patterns from the two patents cited (Pandey et al., Reference Pandey, Singh and Prasad2018, Ren et al., Reference Ren, Yi and Yao2016), with the latter converted to the angle scale appropriate to λ = 0.458133 Å.

The 12 parameters searched in the structure determination through simulated annealing were the position and orientation of the molecule in the unit cell along with six torsion angles C11–C1–C2–C3, C16–C15–N12–C11, C25–C24–C15–C16, N26–C25–C24–C15, C22–S19–N18–C16, and C23–C22–S19–N18. After a starting model was obtained using DASH, Rietveld refinement in TOPAS was used to optimize this structure. All non-H bond distances, angles, and torsion angles were subjected to restraints, based on a Mercury/Mogul Geometry Check (Bruno et al., Reference Bruno, Cole, Kessler, Luo, Motherwell, Purkis, Smith, Taylor, Cooper, Harris and Orpen2004; Sykes et al., Reference Sykes, McCabe, Allen, Battle, Bruno and Wood2011). The Mogul average and standard deviation for each quantity were used as the restraint parameters. A single B iso was refined for all atoms. The Stephens (Reference Stephens1999) anisotropic microstrain model was used to describe peak profiles. Preferred orientation was considered using the March (Reference March1932)–Dollase (Reference Dollase1986) correction. This initial refinement yielded the residuals R wp = 14.36 and χ 2 = 6.00. As with the Pawley fit, the most significant features in the difference curve were due to impurity peaks.
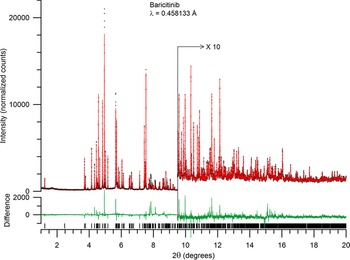
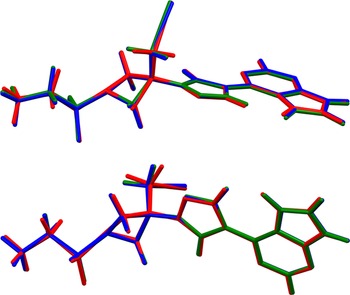
For a reasonably large molecule such as baricitinib, there is not enough information in a powder diffraction pattern, even one with as many resolved peaks as this one, to determine bond distances and angles with the confidence normally obtained from single crystal data. Even with restraints on structural parameters, the bond length and angles determined from powder data alone are probably further from the truth than those from quantum mechanical calculations. Accordingly, an optimization of the initial Rietveld solution was carried out in VASP, with fixed unit cell. A second Rietveld refinement with atomic positions fixed at the VASP calculation (35 refined parameters for lineshape, background, preferred orientation, thermal parameter) had R wp = 14.21, only marginally lower than the pure Rietveld refinement. However, if one adopts the VASP bond lengths and angles and refines the position and orientation of the molecule in the unit cell and the six flexible torsion angles about single bonds (47 parameters), R wp drops significantly to 13.45. This appears to be the best combination of prior knowledge, theory, and observations from nature; Figure 3 shows this final refinement. Preferred orientation is consistent in all three stages of refinement, with the [1,1,−3] direction dominant and a March parameter of 1.144. Figure 4 shows an overlay of the molecule at three stages of refinement; the three images are drawn with coordinates referred to the same unit cell. The root-mean-square (rms) Cartesian displacement of non-H atoms between the original and final Rietveld-refined baricitinib is 0.084 Å. The largest difference is 0.208 Å at the methyl group C24. The excellent agreement provides evidence that the structure is correct (van de Streek and Neumann, Reference van de Streek and Neumann2014).
Rietveld refinement of the powder pattern of baricitinib, as described in text. Data points are black dots, the red line is the fitted profile, and the green line is the difference. Tick marks along the horizontal axis show the positions of allowed peaks.

Two views of the structure of baricitinib at three stages of analysis, referenced to a common lattice. Red: refinement from DASH solution; green: optimized structure from VASP; blue: final refinement using bond lengths and angles from VASP, torsions and molecular position refined to X-ray data. Image generated with mercury (Macrae et al., Reference Macrae, Sovago, Cottrell, Galek, McCabe, Pidcock, Platings, Shields, Stevens, Towler and Wood2020).

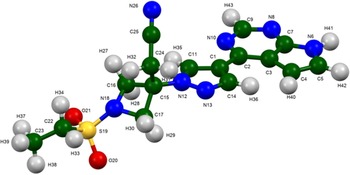
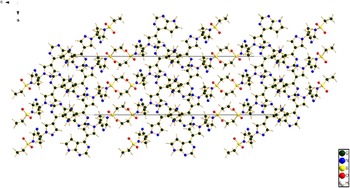
A single molecule corresponding to the asymmetric unit (with atom numbering) is illustrated in Figure 5, while a broader view showing all molecules contained within a unit cell is presented in Figure 6 so that the packing arrangement can be visualized. The crystal structure (I2/a setting) is characterized by hydrogen-bonded double layers parallel to the ab-planes. The fused ring systems stack perpendicular to the b-axis. The sulfone ends of the molecules form the interlayer regions. Most of the bond distances, bond angles, and torsion angles fall within the normal ranges indicated by a Mercury/Mogul Geometry check (Macrae et al., Reference Macrae, Sovago, Cottrell, Galek, McCabe, Pidcock, Platings, Shields, Stevens, Towler and Wood2020). The C22–S19 bond distance of 1.788 (average = 1.765(7) Å; Z-score = 3.08) is flagged as unusual, but the uncertainty on the average is exceptionally small, and this deviation is not of concern. The C15–N12–N13 [116.9°; average = 119.8(9)°; Z-score = 3.37], C16–C15–N12 [117.5°; average = 126.0(22)°; Z-score = 3.82], C17–C15–N12 [116.8°; average = 126.0(22)°; Z-score = 4.12], and O20–S19–N18 [109.7°; average = 107.2(8)°; Z-score = 3.0] are also flagged as unusual. This is likely because the uncertainties on the C15–N12–N13 and O20–S19–N18 angles are anomalously small, resulting in inflated Z-scores. The C16–C15–N12 and C17–C15–N12 angles are part of the linkage of the 4- and 5-member rings of the molecule, and thus might be expected to be slightly unusual. Several torsion angles involving rotation around the C1–C2 bond are flagged as unusual; these involve the linkage of the 5-member ring and the fused 6/5-member ring system. Several torsions involving rotation of the C15–N12 and C24–C15 bonds are flagged as unusual; these occur in the linkage of the 5-member ring and 4-member rings. Some torsion involving the S19–N18 bond are also flagged as unusual; these involve the 4-member ring and the sulfone group.
Structure of the baricitinib molecule with atoms labeled.

Unit cell of baricitinib, viewed along the direction of the b-axis.

Quantum chemical geometry optimization of the baricitinib molecule (DFT/B3LYP/6-31G*/water) using Spartan ‘18 (Wavefunction, 2020) indicated that the observed conformation is 5.4 kcal mol−1 higher in energy than the local minimum conformation, which has a slightly different orientation of the ethyl group. The global minimum-energy conformation is only 0.1 kcal mol−1 lower in energy than the local minimum. The conformational differences are spread uniformly throughout the molecule, indicating that intermolecular interactions are important in producing an observed solid-state conformation that slightly differs from that expected for an isolated molecule.
Analysis of the contributions to the total crystal energy using the Forcite module of Materials Studio (Dassault, 2021) suggests that the intramolecular deformation energy is dominated by angle distortion terms, as might be expected for a molecule containing a fused ring system and a 4-member ring. The intermolecular energy is dominated by van der Waals attractions and electrostatic attractions, which in this force-field-based analysis include hydrogen bonds. The hydrogen bonds are better analyzed using the results of the DFT calculation. The most important hydrogen bond is the N–H⋯N bond between the fused ring systems (Table I). These come in pairs (Figure 7), forming dimers with a graph set R2,2(8) (Etter, Reference Etter1990; Bernstein et al., Reference Bernstein, Davis, Shimoni and Chang1995; Shields et al., Reference Shields, Raithby, Allen and Motherwell2000). Several C–H⋯N and C–H⋯O hydrogen bonds also contribute to the crystal lattice energy. In addition to N8, the ring N atoms N10 and N13 with lone pairs act as acceptors, as does N26 of the cyanide group. Both oxygen atoms of the sulfone group also act as acceptors.
Hydrogen bonds between two baricitinib molecules.

Hydrogen bonds in baricitinib (CRYSTAL17 optimization)

a Intramolecular.
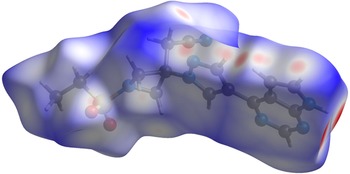
The volume enclosed by the Hirshfeld surface (Figure 8; Hirshfeld, Reference Hirshfeld1977; Turner et al., Reference Turner, McKinnon, Wolff, Grimwood, Spackman, Jayatilaka and Spackman2017) is 435.29 Å3, 98.14% of the volume of the asymmetric unit (1/8 of the unit cell volume). The packing density is thus fairly typical for a molecule of this type. All of the significant-close contacts (shown in red in Figure 8) involve hydrogen bonds. The volume per non-hydrogen atom in baricitinib is 17.0 Å3, in accord with general expectations for molecular compounds
Hirshfeld surface of one baricitinib molecule (Hirshfeld, Reference Hirshfeld1977).

The Bravais–Friedel–Donnay–Harker (Bravais, Reference Bravais1866; Friedel, Reference Friedel1907; Donnay and Harker, Reference Donnay and Harker1937) model suggests that we might expect a plate-like morphology for baricitinib, with {002} as the major family of faces (Macrae et al., Reference Macrae, Sovago, Cottrell, Galek, McCabe, Pidcock, Platings, Shields, Stevens, Towler and Wood2020). This orientation is roughly consistent with the March–Dollase analysis, insofar as the [1,1,−3] lattice direction is approximately perpendicular to {002} faces, which would likely align along the capillary axis. The powder pattern of baricitinib from this synchrotron dataset has been submitted to ICDD for inclusion in the Powder Diffraction File.
IV. DEPOSITED DATA
The Crystallographic Information Framework (CIF) files containing the results of the Rietveld refinement (including the raw data) and the DFT geometry optimization were deposited with the ICDD. The data can be requested at info@icdd.com.
ACKNOWLEDGEMENTS
This work was carried out in part as a high school summer research project by YL, with funding via the Research Science Institute provided by the Center for Excellence in Education (CEE, https://www.cee.org/). The use of the Advanced Photon Source at Argonne National Laboratory was supported by the U.S. Department of Energy, Office of Science, Office of Basic Energy Sciences, under Contract No. DE-AC02-06CH11357. We thank Lynn Ribaud and Saul Lapidus for their assistance in the data collection at beamline 11-BM. This work was partially supported by the International Centre for Diffraction Data.
CONFLICTS OF INTEREST
The authors have no conflicts of interest to declare.