INTRODUCTION
Establishing baseline data for potentially threatening infectious agents is necessary for recovery and re-introduction programmes (Polley et al. Reference Polley, Hoberg and Kutz2010; Thompson et al. Reference Thompson, Lymbery and Smith2010). Identification and knowledge of the life history of infectious agents in wildlife is imperative for the implementation of satisfactory recovery programmes. One of the most common infectious agents of birds is the coccidian parasite (Grulet et al. Reference Grulet, Landau and Baccam1982; Levine, Reference Levine1988). For example, poultry coccidiosis caused by Eimeria spp. is a highly contagious disease that is estimated to cost the broiler industry in excess of $1·5 billion per annum worldwide (Sharman et al. Reference Sharman, Smith, Wallach and Katrib2010). Intestinal coccidian parasites in the genus Isospora are ubiquitous intestinal parasites of birds; however, clinical and ecological implications are yet to be fully understood (Levine, Reference Levine1988). All coccidian parasites undergo asexual and sexual development leading to production of environmentally resistant oocysts (Belli et al. Reference Belli, Smith and Ferguson2006). What distinguishes Isospora species in birds from other coccidian parasites is their diurnal periodicity of life cycle and oocyst release. Boughton (Reference Boughton1933) published the seminal paper describing release of oocysts in the late afternoon. This was later confirmed for a wide range of species in diverse passerine birds (Stabler and Kitzmiller, Reference Stabler and Kitzmiller1972; Grulet et al. Reference Grulet, Landau and Baccam1982; Brawner and Hill, Reference Brawner and Hill1999; Brown et al. Reference Brown, Ball and Holman2001; Misof, Reference Misof2004; López et al. Reference López, Figuerola and Soriguer2007). It has been experimentally documented that it represents an adaptive trait against desiccation and ultraviolet radiation (Martinaud et al. Reference Martinaud, Billaudelle and Moreau2009). Little information exists about the pathology caused by Isospora species in birds, despite significant impact of parasites on bird's fitness and reproductive success (Grulet et al. Reference Grulet, Landau, Millet and Baccam1986b; McGraw et al. Reference McGraw, MacKillop, Dale and Hauber2002; Hõrak et al. Reference Hõrak, Saks, Karu, Ots, Surai and McGraw2004; Tung et al. Reference Tung, Liu, Cheng, Yang, Tu, Wang, Shyu, Lai, Chou and Lee2007). Avian Isospora prevalence surveys that do not take into account the diurnal periodicity of the oocyst shedding will lead to incorrect results (Filipiak et al. Reference Filipiak, Mathieu and Moreau2009).
The Regent Honeyeater, Xanthomyza phrygia (Shaw, 1794) (Aves: Passeriformes), is endemic to south-eastern Australia (Franklin et al. Reference Franklin, Menkhorst and Robinson1989). Historically, this bird could be seen overhead in flocks of hundreds ranging from Queensland to South Australia. It is no longer found in much of its former range (Franklin et al. Reference Franklin, Menkhorst and Robinson1989; Thomas, Reference Thomas2009). Its population is fragmented, and the only remaining breeding habitat is in north-eastern Victoria, Capertee valley and the central coast of New South Wales. The primary threatening process for this species is extensive loss of its box-ironbark eucalyptus forest habitat throughout its range. The Regent Honeyeater feeds on nectar and insects within box-ironbark eucalyptus forests. They are a highly mobile species, which roams widely in search of unpredictable food sources.
The Regent Honeyeater is classified as Endangered in the IUCN Red List of Threatened Species – Red List Category C2a (ii) & Criteria ver 3.1. (Bird-Life-International, 2008). The population of the Regent Honeyeater is estimated at between 800 and 2000 and is continuing to decline (Garnett and Crowley, Reference Garnett and Crowley2000; Thomas, Reference Thomas2009). In Australia a National Recovery Program has been established and managed by the NSW National Parks and Wildlife Service and Parks Victoria to protect this endangered native species from possible extinction. In the past decade the Recovery Program has become a large-scale project involving habitat restoration, wild population monitoring and a zoo-based breeding programme operating at Taronga Zoo since 1995. A number of birds suitable for re-introduction were bred. In May 2008, 27 zoo-bred Regent Honeyeaters were released to ironbark woodlands near Chiltern, Victoria. A further 44 zoo-bred Regent Honeyeaters were released in the same area in May 2010.
The aim of this study was to undertake a parasitological survey of a cohort of the Regent Honeyeaters at Taronga Zoo, Australia that were part of a breeding and re-introduction programme for the species. We describe a new Isospora species representing the first coccidian species described from Australian endemic passerine birds. We confirm diurnal periodicity of oocyst shedding in this species. This information is useful in establishing appropriate health screening protocols for this species, particularly pre-release protocols prior to re-introduction to the wild.
MATERIALS AND METHODS
Animals
The Regent Honeyeaters used in this study were housed in 4 aviaries at Taronga Zoo, Mosman, New South Wales, Australia. Aviaries I-III were pre-release quarantine aviaries housing young birds prior to release. Aviary IV housed juveniles and adult breeding birds that were not part of the release cohort. All birds had been bred either at Taronga Zoo or Adelaide Zoo, South Australia, Australia. There was no difference in temperature, water, food supplements or contact to other endemic birds between the aviaries.
Quarantine aviaries I and II
Aviaries I and II were situated adjacent to each other with a corrugated iron gate between them (Taronga Zoo reference numbers BHH001-4). The perimeter of the aviaries was constructed from squared steel mesh, 3·5–4 ×13×5 m and 3·5–4×7×5 m (height× width × depth). Roof-high tree branches were placed in both aviaries as perches. Flooring in both aviaries was concrete and approximately half of the roof was covered for shelter from rain. The birds in these two aviaries were in contact with each other and for the purpose of this study were treated as a single population. Together these aviaries housed 36 birds. These birds varied in age (<1 year to adults) being held in pre-release quarantine prior to their release to the wild.
Quarantine aviary III
This aviary was a single row of 4 consecutive adjacent aviaries, each with an approximate dimension of 3·5-3·8×1·5×5 m (Taronga Zoo reference numbers BOB011-014). The aviaries were separated from each other and the external environment by steel mesh. All aviaries were covered by a common roof covering half the aviary space, which sheltered the birds from rain. Roof-high tree branches were used as perches. The floor in the aviary was concrete. In total, 8 birds (2 in each) were housed in the aviary and were treated as a single population. These birds were yearlings recently relocated from Adelaide Zoo also destined for release.
Aviary IV
This aviary consisted of 3 separate aviaries immediately adjacent to each other and separated by steel mesh (Taronga Zoo reference numbers BHH035-037). The aviaries shared a common roof across the back that covers a portion of the space from rain. The walls of the aviary were steel mesh. The 3 aviaries were of unequal size and shape, approximately 4×3×5 m. Each aviary contained roof-high perches constructed from tree branches. In total, 9 birds (3 in each) were housed in the aviary and were treated as a single population due to the close contact between the birds. These birds were part of the permanent collection at the Zoo and were not destined for release at this time.
Faecal collection
Faecal samples were collected on 2 consecutive days in April 2010 (Sydney GMT+11; daytime: 11 h 35 min; sunrise at 6:10 am, sunset 5:45 pm). Sampling was carried out over a 3-h period twice a day, with samples designated as ‘AM’ and ‘PM’. The collection involved placing clean plastic white bin-liners in each corner of the aviaries between 08.00 to 11.00 am for AM samples and between 2.30 to 5.30 pm for PM samples. At the end of each 3-h sampling interval, individual faeces on the bin-liners were transferred into 2 ml sterile Eppendorf tubes. The sample tubes were labelled according to the day, time and the aviary from which they were collected. The morning samples were kept at room temperature until the afternoon samples were collected. All samples were then preserved with 500 μl of 2·5% potassium dichromate (K2Cr2O7) added to each tube and stored at 4°C until parasitological examination. Since the birds were housed in grouped aviaries, individual bird identification was not possible. We have collected faecal samples from Aviary I+II (27 on day 1, 48 on day 2), Aviary III (14 on day 1, 25 on day 2) and Aviary IV (18 on day 1, 42 on day 2).
Parasitological examination
Samples were examined at the University of Sydney, NSW, Australia. Sample vials containing faeces and 500 μl of 2·5% K2Cr2O7 were centrifuged for 2 min at 1000 g. The potassium dichromate was pipetted out and the faecal pellet weighed to the nearest 0·001 g using an electronic balance. The pellet was then gently homogenized with 500 μl of saturated salt flotation solution. For each sample, the McMaster chamber was used for counting oocysts. Each preparation was rested for at least 1 min before counting to allow oocysts to float to the top. An oocyst average was taken from 3 grids to obtain oocyst number per sample. Coccidian oocyst counts per total volume representing the oocyst faecal content was converted to oocysts.g−1 of faeces (OPG).
Coccidian oocysts were examined and measured with a calibrated ocular micrometer using bright-field microscopy using 100×oil objective on an Olympus BX60 microscope equipped for Nomarski interference (DIC) contrast microscopy and photographed using an Olympus DP70 camera. Images were recorded as TIFF and adjusted in Adobe Photoshop CS3.
Statistical analysis
Proportions of positive faecal samples were calculated, overall as well as by time of the day, sampling day, and by the aviary. Unconditional association of these 3 explanatory variables with the outcome variable (presence or absence of oocysts in a sample) was evaluated using univariable logistic regression. Stratified analyses were conducted to investigate whether the odds ratio between the morning and afternoon samples was confounded/modified by the day collected or by the aviary. This included calculation of stratified odds ratios for each stratum (each day and each enclosure, respectively), testing them for heterogeneity using the Breslow-Day test, and combining them to calculate adjusted or Mantel-Haenszel odds ratios if there was no evidence of heterogeneity. Significance of adjusted odds ratios was tested by a Cochran-Mantel-Haenszel chi-square test. Finally, a multivariable logistic regression model was fitted to evaluate the combined effect of all three variables by using a backward stepwise approach.
To compare parasite burden between times of the day, sampling dates and the cages, summary statistics were calculated for each of the categorical explanatory variables, and visualized using box-and-whiskers plots (GraphPad Prism 4 Software, Inc., La Jolla, CA, USA). All negative samples were excluded for this analysis and OPG was log transformed to satisfy the assumption of normality and equal variance. An outlier with 1 535 439 oocysts.g−1 count (PM sample) was removed before conducting analyses. Two sample t-tests were used to compare the mean log OPG between time of the day and sampling day, and ANOVA was used to compare the means between aviaries. All 3 variables and their first-order interactions were tested in multiple linear regression models to test their association with log OPG by backward stepwise approach and retained if significant (P<0·05). The assumptions of linear regression were evaluated using residual diagnosis.
Analyses were conducted using SAS statistical software (release 9.1, 2002–03, SAS Institute Inc., Cary, NC, USA) and UniLogistic macro (Dhand, Reference Dhand2010); all P-values were 2-sided, and odds ratios are reported with 95% confidence intervals (CI), unless indicated to be otherwise.
Histological examination
Regent Honeyeater material held within the Australian Registry of Wildlife Health (Taronga Conservation Society Australia, Mosman, NSW, Australia) was obtained. In total, tissues from 6 birds were retrieved (1999–2010) that were catalogued with ‘coccidiosis’. Due to autolysis we excluded ARWH 2340.1. For the remaining 5, ARWH 1881.1, ARWH 2204.1, ARWH 7298.1, ARWH 7341.1 and ARWH 7457.1, we retrieved paraffin blocks and cut 2 μm thick sections and stained them with H&E and Giemsa for histopathological examination and identification of coccidian life-cycle stages.
Two birds from the cohort examined in this study were found dead after release; ARWH 7598.1 was processed as above, however ARWH 7585.1 was too autolysed to examine coccidian development.
Molecular characterization
Nucleic acid was extracted from 106 oocysts purified from a single faecal sample using the FastDNA Soil Kit Protocol with a Fast Prep-24 Homogenisation System equipped with QuickPrep Adapter (MP Biomedicals, Australia); the speed setting used was 6·0 for 40 s as described previously (King et al. Reference King, Šlapeta, Jenkins, Ellis and Windsor2010). A nested PCR amplification of a fragment of the subunit I of the cytochrome c oxidase gene (COI) from the parasite mitochondrial genome was applied according to the method described by Dolnik et al. (Reference Dolnik, Palinauskas and Bensch2009). Each reaction of 25 μl contained 12·5 μl of 2×SAHARA Mix (BioLine), 0·5 μl of each 10 mM primer, and 100 ng of extracted DNA; deionized sterile water was used as a negative control. A touch-down temperature profile was utilized for the first PCR according to Dolnik et al. (Reference Dolnik, Palinauskas and Bensch2009). PCR was performed in an Eppendorf Mastercycler Personal. Resulting products were resolved in 2% (w/v) agarose gels. A PCR product of approximately 250 bp was considered as positive and cloned using the TA-TOPO Cloning Kit (Invitrogen, Australia) according to the manufacturer's instructions. Four randomly selected plasmids with target inserts were sequenced bidirectionally using primers targeting sequences located within the vector by Macrogen Inc. (Seoul, South Korea). Sequences were assembled, aligned with related sequences and analysed using the CLC Main Workbench 5.5 (CLC bio, Denmark). Phylogenetic analyses were conducted in MEGA4 (Tamura et al. Reference Tamura, Dudley, Nei and Kumar2007).
RESULTS
Parasite description and identification
Parasitological examination of the Regent Honeyeaters housed at Taronga Zoo revealed oocyst and parasite development of the genus Isospora Schneider, 1875. The sporulated oocyst is the stage that new coccidian species are predominantly defined by, because the oocyst is the most readily available stage in the life cycle. Besides the specific guidelines for oocyst circumscription, it was emphasized that endogenous development and ecological parameters should be included whenever possible with the species description (Duszynski and Wilber, Reference Duszynski and Wilber1997). Morphological and ecological investigations showed that this parasite represents a new species, the description of which follows.
Alveolata Cavalier-Smith, 1991
Apicomplexa Levine, 1970
Eimeriidae Minchin, 1903
Isospora lesouefi sp. n.
Oocyst
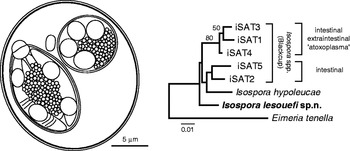
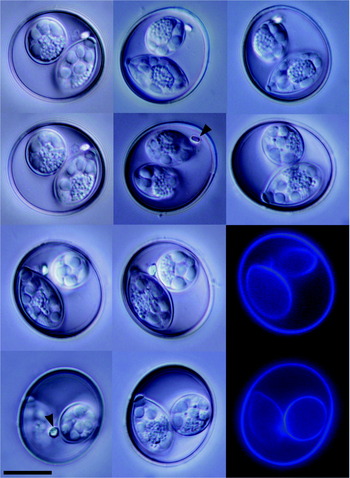
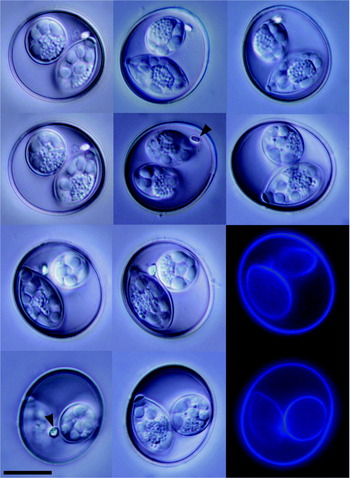
Oocysts broadly spherical, 25·8 (22·5–28·75) μm by 23·8 (20–26·25) μm; shape index (length/width) 1·07 (1–1·17) (n=50) (Figs 1 and 2). Oocyst wall smooth, colourless to pale yellow. Oocyst wall bilayered, 1 μm thick (outer layer 0·7 μm, inner layer 0·3 μm). One polar granule 1·83 (1·5–2) μm by 1·67 (1–3) μm, grain shaped or rounded. Oocyst residuum absent. Sporocysts ovoid, 18·67 (17–19) μm by 9·49 (9–10) μm, with thin, smooth well-defined unilayered sporocyst wall 0·5 μm thick. Sporocyst shape index 1·97 (1·81–2·11). Stieda body flat, 1·75 (1·5–2) μm by 1 μm. Substieda body spherical, 2·67 (2–3) by 2 μm. Absence of hyaline body protruding from the Stieda into substieda body. Sporocyst residuum present, composed of numerous granules of approx. 0·3 μm each, condensed into oval cluster 8–5 μm in diameter. Sporozoites elongate, arranged head to tail within sporocyst, in some oocysts overlapping with the substieda body. Each sporocyst contains 4 sporozoites. Sporozoites with 2 refractile bodies, 1 bean-shaped refractile body (3·5 by 2·5 μm) and a smaller more spherical (2 by 2·5 μm) body. Sporozoite nucleus oval situated between refractile bodies. In between sporozoite refractile bodies and nucleus conspicuous transverse ridges. Sporozoites and sporozoite residuum float free within the sporocyst, not enclosed in a membrane.
Oocysts were unsporulated when voided. Sporulation exogenous, up to 50% sporulated in 4 h at 20°C and up to 90% sporulated in 8 h at 20°C.
Nucleotide signature sequence
The haplotype fragment of the subunit I of the cytochrome c oxidase gene (COI) from the mitochondrial DNA of I. lesouefi sp. n. was identical across all 4 clones sequenced and submitted to GenBankTM (HQ221885). When comparing the sequence of I. lesouefi sp. n. to available sequences of Isospora hypoleucae (from Pied Flycatcher, Ficedula hypoleuca; haplotype iFICEHYP1: FJ269363) and Isospora spp. (from Blackcap, Sylvia atricapilla; haplotypes iSAT1-iSAT6: FJ269357-FJ269362) we found sequence divergences between 2·8 and 4·8%. On a phylogenetic tree (Fig. 1), the I. lesouefi sp. n. haplotype clustered outside the Blackcap's iSAT1, iSAT3 and iSAT4 possessing extraintestinal stages (Dolnik et al. Reference Dolnik, Palinauskas and Bensch2009).
Composite line drawing of sporulated Isospora lesouefi sp. n. oocyst in the Regent Honeyeater (Xanthomyza phrygia) at the Taronga Zoo and its phylogenetic relationship with related cytochrome oxidase I (COI) sequences. The Minimum Evolution tree was reconstructed using Kimura 2-parameter distances and bootstraped (1000 replicates). Tree rooted using COI of Eimeria tenella (EF174188).
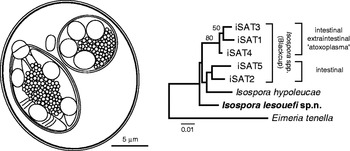
Photo-micrographs of sporulated Isospora lesouefi sp. n. oocysts in the Regent Honeyeater (Xanthomyza phrygia) at the Taronga Zoo. Arrowhead, polar granule. DIC and blue autofluorescence. Scale bar represents 5 μm.
Endogenous development
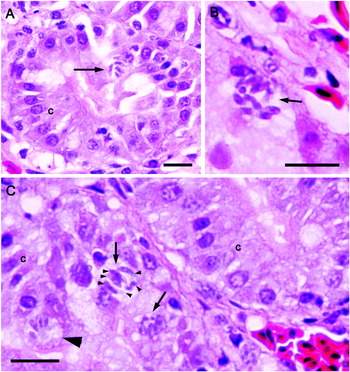
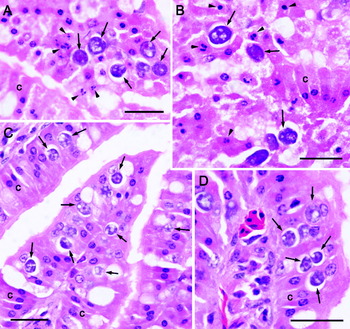
The parasite development was detected in the columnar epithelium of the duodenum and jejunum. Parasites were found intracellularly in enterocytes. Asexual development was detected in ARWH 7598.1 (Fig. 3). The asexual stages were detected in low numbers in Lieberkühn's crypts surrounded by minimal host response (Fig. 3 A). We could detect 2 distinct types of meronts (Fig. 3 B, C) – ‘meront C’ and ‘meront B’ according to Grulet and colleagues (1986b).
Intestinal coccidiosis caused by Isospora lesoueffi n. sp. Coccidian asexual development, merogony, in the jejunum of the Regent Honeyeater (Xanthomyza phrygia, ARWH 7598.1C). Intracellular developing meronts (arrows) with merozoites (arrowheads) are within the columnar epithelium (c) of the Lieberkühn's crypts (A). Two types of meronts are recognized, meronts with delineated circular outline (large arrowhead, C) and meronts with undefined outline (arrow, B). Host inflammatory response is minimal (A–C). Two μm section, H&E. Scale bars represent 10 μm.

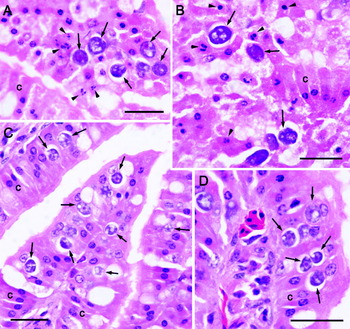
Sexual development was detected in ARWH 7457.1 (Fig. 4). The sexual stages were associated with loss of epithelial structure due to necrosis in the duodenum (Fig. 4 A, B) and jejunum (Fig. 4 C, D). The sexual stages were localized along the whole microvillus epithelium, younger forms were at the base of the cells (below the host cell nucleus), while more mature larger stages were progressively displacing the host nucleus to the side and moving towards the lumen. The enlarged epithelial cells were parasitized by 1 or more parasitic stages (dominantly by developing macrogametes and early oocysts). Similar endogenous development associated with moderate to marked intestinal coccidiosis of duodenum and jejunum was detected in ARWH 1881.1, ARWH 2204.1, ARWH 7298.1, and ARWH 7341.1.
Intestinal coccidiosis caused by Isospora lesoueffi n. sp. Coccidian sexual development, gamogony (arrows), in the duodenum (A, B) and the jejunum (C, D) of the Regent Honeyeater (Xanthomyza phrygia, ARWH 7457·1B). Intracellular developing macrogametes, mature macrogametes and early oocysts are within the enterocytes of the columnar epithelium (c). Developmental stages are surrounded by necrosis (apoptotic nuclei, arrowhead) and the columnar epithelium (c) is enlarged (D). Maturating oocysts destroy the columnar epithelium. Host inflammatory response is minimal. Two μm section, H&E. Scale bars represent 20 μm.
Diurnal periodicity of Isospora lesouefi sp. n. oocyst shedding
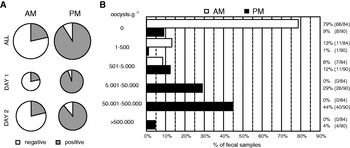
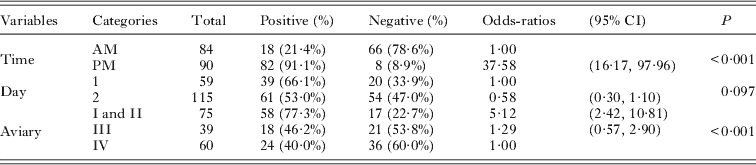
The proportions of positive faeces were based on freshly voided faeces collected from 53 Regent Honeyeaters (Table 1, Fig. 5, and Supplementary Table S2 – Online version only). The proportions of I. lesouefi sp. n. oocysts positive samples were significantly different between morning (AM, 91% positive) and afternoon (PM, 21% positive) samples (Table 1, Fig. 5 A). The crude odds ratios indicate that PM samples were 37·6 times more likely to be positive compared to AM samples (Table 1). Breslow-Day test for homogeneity of odds ratios between days was non-significant (P=0·48) indicating that it was appropriate to combine stratified odds ratios to calculate an adjusted odds ratio. Mantel-Haenszel odds ratio adjusted for sampling day was 35·9 (95% CI: 14·68, 87·66) and was statistically significant (Cochran-Mantel-Haenszel chi-square test statistic 84·0; P <0·001). The confounding by sampling day was negligible (4·6%). Stratified odds ratios calculated for each aviary were not significantly different (Breslow-Day test for homogeneity of odds ratios P=0·13). Therefore, after adjusting for aviaries, Mantel-Haenszel odds ratio was 39·2 (95% CI: 13·87, 110·75) and was statistically significant (Cochran-Mantel-Haenszel chi-square test statistic 78·2; P <0·001). This suggests that it was significantly more likely for oocysts to be detected in PM samples than in AM samples even after adjusting for sampling day or aviary.
Presence of oocysts of Isospora lesouefi sp. n. in the Regent Honeyeater (Xanthomyza phrygia) at the Taronga Zoo aviaries. (A) Quantitative representation of proportions of I. lesouefi sp. n. positive faeces in all (n=174) faecal samples collected across 2 different days (Day 1, n=59; Day 2, n=115). The pie chart size is proportional to the number of faecal samples (see Supplementary Table S1-Online version only). Morning samples (AM) and afternoon samples (PM) are side-by-side. (B) Qualitative representation of all faecal samples sorted into negative and 5 positive categories according to I. lesouefi sp. n. and time of the day, morning samples (AM, n=84) and afternoon samples (PM, n=90).
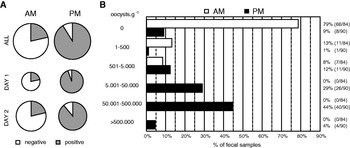
Comparison between the presence and absence of Isospora lesouefi n. sp. oocysts in faeces of the Regent Honeyeater, Xanthomyza phrygia collected in the morning (AM) and in the afternoon (PM) on 2 consecutive days at 4 Taronga Zoo aviaries

To control for both the variables and their interactions simultaneously, multivariable logistic regression analyses were conducted. Neither sampling day nor its interaction with sampling time was significant and therefore both were removed from the model. The final model suggests that after adjusting for the variation due to enclosures, PM samples had 42 times greater odds to be positive compared to AM samples (Supplementary Table S3 A-Online version only). However, samples from aviaries I/II and III were 5·6 and 3·4 times more likely to be positive compared to those from aviary IV (Supplementary Table S3 A-Online version only). Similar results were obtained when aviaries were controlled as a random effect rather than as a fixed effect (odds ratio – PM versus AM=38·35; 95% CI: 14·68, 100·16).
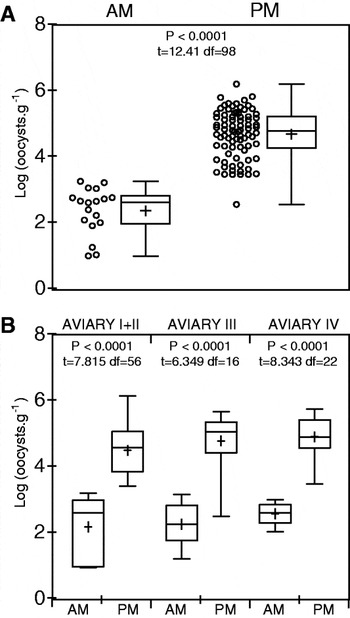
We analysed data for I. lesouefi sp. n. burden in positive samples (Fig. 5 B, Supplementary Table S2-Online version only). The means were significantly different, 499 (95% CI: 124-523) oocysts.g−1 (n=18) and 129 723 (95% CI: 83 846–175 601) oocysts.g−1 (n=82) in the AM and PM samples, respectively (Fig. 6). The geometric mean oocyst count in PM samples was 200 times greater than in AM samples (95% CI: 86·26 to 462·48 times). There was no significant difference in the mean oocyst count between sampling days (t97=0·91; P=0·37) or between aviaries (F2,96=0·95; P=0·39).
Statistical comparison of log transformed Isospora lesouefi sp. n. positive quantitative (oocysts.g−1) data in the Regent Honeyeater (Xanthomyza phrygia) at the Taronga Zoo aviaries. (A). All positive samples for morning (AM, n=18) and afternoon (PM, n=82). Data represented as a scatter dot plot of individual samples (circles) and a box-and-whisker plot (whiskers: min. & max, mean: +). (B). Positive samples split according to aviaries they were collected in and morning (AM: Aviary I+II, n=7; Aviary III, n=6; Aviary IV, n=5) and afternoon (PM: Aviary I+II, n=51; Aviary III, n=12; Aviary IV, n=19). Data represented as a box-and-whisker plot (box: whiskers: min. & max, mean: +). Unpaired t-test values are shown above AM and PM plots, means are significantly different if P<0·05.
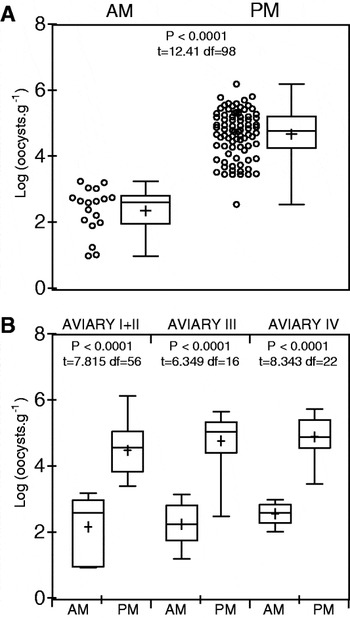
The multiple linear regression analyses conducted to investigate whether the parasite burdens in AM and PM samples (=time of day) are influenced by sampling day or by the aviary revealed that the effect of time of sampling did not vary by sampling day or by the aviary (Supplementary Table S3 2 B- Online version only). However, after adjusting for variation due to time of sampling, there were significant differences in mean oocyst counts between aviaries, with samples from enclosure IV having significantly higher mean log oocyst counts than enclosure I/II (P=0·02) but not enclosure III (P=0·65). There was no significant difference in the mean log counts between aviary I/II and aviary III (P=0·36). After adjusting for this variation in aviaries, the geometric mean oocyst counts in the afternoon samples were 233·4 times greater than in the morning samples (95% CI: 101·28, 537·60). Similar results were obtained using linear mixed model and considering enclosures as random effects. The ratio of geometric mean between afternoon and morning samples was determined to be 199·7 (95% CI: 86·26, 462·48) and aviaries accounted for about 8% of the variance in the model (intra-cluster correlation=8·11%, P=0·069).
DISCUSSION
Coccidia belonging to the genus Isospora in birds are a taxonomically difficult group due to (i) ambiguities in the morphology and (ii) unknown host specificity (Grulet et al. Reference Grulet, Landau and Baccam1982; Levine, Reference Levine1982). The name Isospora lacazei (Labbé, 1893) has been used loosely for many years for Isospora species of many different birds. Levine (Reference Levine1982) reviewed the historical literature and proposed to restrict the name I. lacazei to the species from European goldfinch (Carduelis carduelis) in Spain. To stabilize the taxonomy of the genus Isospora in birds, Levine (Reference Levine1982) assumed “that a coccidian species may be transmissible from one species to another in the same genus, but not from one genus to another in the same family until otherwise demonstrated”. The same conclusion was adopted by Grulet and colleagues (1982, 1986a) to describe new bird Isospora species in house sparrows and to revise existing bird Isospora species (Grulet et al. Reference Grulet, Landau and Baccam1982, Reference Grulet, Landau, Millet and Baccam1986a). Our newly described I. lesouefi sp. n. is the first Isospora species in the host genus Xanthomyza that is monotypic within the family Meliphagidae. Molecular phylogeny has demonstrated that the Regent Honeyeater is nested within Wattlebirds of the genus Anthochaera (Driskell and Christidis, Reference Driskell and Christidis2004). No coccidian parasites have previously been named from the genera Xanthomyza or Anthochaera.
In Australia, the house sparrow (Passer domesticus) is an introduced urban bird. They are known to be infected all year round with multiple Isospora species. In a study from France, wild house sparrows were infected with up to 12 distinct species based on freshly sporulated oocysts (Grulet et al. Reference Grulet, Landau and Baccam1982, Reference Grulet, Landau, Millet and Baccam1986a). Characters of the Stieda apparatus (Stieda body, substieda body and their inclusions), together with the shape and number of polar granules, were used to review and distinguish these species from each other and from previously named species (Grulet et al. Reference Grulet, Landau and Baccam1982, Reference Grulet, Landau, Millet and Baccam1986a,Reference Grulet, Landau, Millet and Baccamb). Eight of these Isospora species were identified in house sparrow specimens from Adelaide, Australia (Grulet et al. Reference Grulet, Landau, Millet and Baccam1986b). While the size and shape of our species overlaps with the majority of Isospora species from the house sparrow, the combination of the single grain-shaped or rounded polar granule, together with the simple symmetric Stieda apparatus, distinguishes our species from all known species in the house sparrow and the majority of described bird Isospora species. The shape and size of the oocyst resembles Isospora passeri Levine, Reference Levine1982 that was described from house sparrows in Illinois, US (Levine, Reference Levine1982; Levine and Mohan, Reference Levine and Mohan1960). In our species we neither observed endostideal bodies according to Levine and Mohan (Reference Levine and Mohan1960) “sometimes [oocyst of I. passeri] contains a cylindrical core extending part way down from the Stieda body” nor are sporozoites and sporocyst residuums “enclosed in a membrane, forming more or less of a ball within the sporocyst”. These differences distinguish I. passeri from our species. Oocysts, Stieda apparatus and shape of polar granule resemble Isospora petrochelidon Stabler and Kitzmiller, Reference Stabler and Kitzmiller1972 from cliff swallows from the US (Stabler and Kitzmiller, Reference Stabler and Kitzmiller1972). Our species is distinguished by the presence of a single polar granule and absence of a sporocyst membrane enclosing the sporozoites and residuum. Compared to the rapid sporulation of I. lesouefi sp. n., the average time for completion of I. petrochelidon sporulation was 24 h at 21–28 ºC (Stabler and Kitzmiller, Reference Stabler and Kitzmiller1972). Sporulation of Isospora spp. in passerine birds takes 24 h to 7 days (e.g. Anwar, Reference Anwar1966; Upton et al. Reference Upton, Langen and Wright1995; Rossi et al. Reference Rossi, Perrucci and Macchioni1996; Perrucci et al. Reference Perrucci, Rossi and Macchioni1998; Berto et al. Reference Berto, Luz, Flausino, Ferreira and Lopes2009). We are not aware of any other coccidian species with exogenous sporulation that would match sporulation time (8 h) together with 90% efficiency of sporulation as demonstrated for I. lesouefi sp. n.
The diurnal periodicity of the I. lesouefi sp. n. oocyst release in the afternoon faeces is homologous to other Isospora species in birds (Stabler and Kitzmiller, Reference Stabler and Kitzmiller1972; Grulet et al. Reference Grulet, Landau and Baccam1982; Brawner and Hill, Reference Brawner and Hill1999; Brown et al. Reference Brown, Ball and Holman2001; Misof, Reference Misof2004; López et al. Reference López, Figuerola and Soriguer2007). Our results confirm that shedding of I. lesouefi sp. n. was diurnal and that faeces collected in the afternoon reflect the true parasite prevalence. For example, by pooling all morning and afternoon faecal samples we would end up with only 57% (100/174) positive compared to 91% (82/90) positive faeces in the afternoon. Sampling before noon even indicated absence of the parasite (0/5 in Aviary 3 on Day 1) despite 100% (9/9 in Aviary 3 on Day 1) positive faeces in the afternoon, thus suggesting that all birds in this aviary were infected with I. lesouefi sp. n. Therefore, parasite surveys that do not take into account the diurnal periodicity of the oocyst shedding will lead to incorrect results (Filipiak et al. Reference Filipiak, Mathieu and Moreau2009).
There were ∼200 times more oocysts of I. lesouefi sp. n. in the afternoon faeces that contained tens of thousands of oocysts per gramme compared to the morning samples with only a few hundred oocysts per gramme faeces. Similar to Isospora in Blackcaps (Sylvia atricapilla) (Dolnik, Reference Dolnik2006), our results show that the production of oocysts is comparable from day to day, but contrasts with Isospora in Blackbirds (Turdus merula) whose oocyst output strongly varied between successive days (Filipiak et al. Reference Filipiak, Mathieu and Moreau2009). It implies that a single faecal sample from the Regent Honeyeater collected in the afternoon processed using the McMaster chamber will produce an accurate measure of the parasitic load. This is important when health screening captive and wild birds and should also be taken into consideration when health screening other passerine species. Moreover, investigation of whether oocyst shedding is diurnal should be a compulsory part of any new Isospora species in passerine birds.
Histological examination of tissues from Regent Honeyeaters revealed endogenous Isospora development in the duodenum associated with marked necrosis of the intestinal villi. Whether these histopathological changes are reflected in clinical signs is unlikely because a similar extent of Isospora development was reported in clinically healthy house sparrows (Grulet et al. Reference Grulet, Landau, Millet and Baccam1986b). Some Isospora species in birds are known to undergo extraintestinal and possibly devastating disease – atoxoplasmosis, formerly thought to be caused by a distinct parasite of the genus Atoxoplasma (Barta et al. Reference Barta, Schrenzel, Carreno and Rideout2005; Schrenzel et al. Reference Schrenzel, Maalouf, Gaffney, Tokarz, Keener, McClure, Griffey, McAloose and Rideout2005). Molecular techniques have now provided direct evidence that these extraintestinal stages belong to the same Isospora species in the intestine (Schrenzel et al. Reference Schrenzel, Maalouf, Gaffney, Tokarz, Keener, McClure, Griffey, McAloose and Rideout2005). Histopathological investigation has not provided evidence of such extraintestinal I. lesouefi sp. n. development in Regent Honeyeaters and the obtained sequence did not cluster with those with extraintestinal stages. Nevertheless, molecular probes based on the sequenced markers of I. lesouefi sp. n. will be instrumental in resolving this phenomenon, because histopathological investigation may have missed the presence of these stages.
In the Regent Honeyeater, males are characterized by a black upper body, decorated by bright yellow ornamentation especially around the tip of the wings and tail and the belly area while females are duller and smaller in size (Oliver, Reference Oliver1988; Higgins et al. Reference Higgins, Peter and Steele2001). In wild bird populations, the brightness of male birds’ plumage reflects a character for mate selection (Hamilton and Zuk, Reference Hamilton and Zuk1982). Females will select a mate according to the extent of development of such characteristics within a population to ensure that they have chosen the best available genotype to reproduce (Zahavi, Reference Zahavi1975; Hamilton and Zuk, Reference Hamilton and Zuk1982). Plumage colour can originate either from melanin pigments or carotenoid pigments producing either black or brown colours or a hue ranging from red to yellow respectively (McGraw and Hill, Reference McGraw and Hill2000; McGraw et al. Reference McGraw, MacKillop, Dale and Hauber2002). In captive male greenfinches (Carduelis chloris) tail feathers of birds infected with I. lacazei parasites contained 52% less carotenoids and also had smaller values of chroma and hue compared to tail feathers of greenfinches medicated with coccidiostats (Hõrak et al. Reference Hõrak, Saks, Karu, Ots, Surai and McGraw2004). The colour deposition is compromised during parasitic infection, because a trade-off between the use of carotenoids for ornamental displays and the immune function in response to infection (Lozano, Reference Lozano2001; Baeta et al. Reference Baeta, Faivre, Motreuil, Gaillard and Moreau2008). This could induce conflict between the social signal intended by the individual bird and that conferred by its appearance (Hill and Brawner, Reference Hill and Brawner1998). Whether I. lesouefi n. sp. infected birds are disadvantaged over their wild counterparts that are subjected to a different parasitic burden and carotenoid deposits in their plumage, remains to be investigated.
We do not know yet what the ecological significance of an ongoing I. lesouefi n. sp. infection in the wild is. Nevertheless, after release, the captive bred Regent Honeyeaters interact with each other and with wild Regent Honeyeaters in exactly the same way that wild Regent Honeyeaters interact and over both releases (2008 and 2010) captive birds demonstrated both courtship and nest building behaviour with wild birds (Ingwersen, personal observations). An investigation towards the reproduction and survival success of released birds in the wild correlating with the parasite burden is a logical step in our investigation and recovery of the Regent Honeyeater population in Australia. This information will not only be critical in the recovery of the Regent Honeyeater, but also for other remnant communities in the threatened box-ironbark forests of Victoria and New South Wales including the Painted Honeyeater or Swift Parrot and Superb Parrot.
Taxonomic summary
Isospora lesouefi sp. n. (Apicomplexa: Eimeriidae)
Type host: Regent Honeyeater, Xanthomyza phrygia (Shaw, 1794) (Aves: Passeriformes: Meliphagidae); syn. Anthochaera phrygia (Shaw, 1794).
Type locality: Zoo breeding flock at Taronga Zoo, Mosman, Sydney, New South Wales, Australia. Animals are alive at the Taronga Zoo or were released.
Site of infection: Enterocytes. Duodenum and jejunum. Unsporulated oocysts recovered from faeces.
Prevalence: Oocyst found in 21% (18/84) of morning faeces and 91% (82/90) of afternoon faeces from enclosures with 53 captive birds.
Type material/hapantotype: ARWH 7598.1. Formalin-fixed paraffin-embedded blocks at the Australian Registry of Wildlife Health, Mosman, NSW, Australia. Nucleotide sequence of the cytochrom oxidase I (COI) is available in GenBankTM under Accession no. HQ221885.
Etymology: The specific epithet ‘lesouefi’ is given in honour from the surname of Albert Sherbourne Le Souëf (1877–1951), the first director of Taronga Zoo who insisted that all walls and fences were camouflaged. As a Bachelor of Veterinary Science, he was a dedicated leader of the zoological community and passionate supporter of faunal and floral reservations and sanctuaries.
Remarks: This is the first Isospora species described from a passerine bird in the genus Xanthomyza. Invasive house sparrows (Passer domesticus) from Adelaide are known to be infected with several Isospora spp. identical to those in Europe (Grulet et al. Reference Grulet, Landau, Millet and Baccam1986b). While the size and shape of our species overlaps with the majority of Isospora species from the house sparrow, the oocysts’ polar granule together with the Stieda apparatus distinguishes our species from all known species in the house sparrow.
ACKNOWLEDGEMENTS
The Taronga Conservation Society Australia and Taronga Zoo is acknowledged for assistance with conducting this study. Dean Ingwersen (Regent Honeyeater recovery team co-ordinator) for insight on released birds. We thank Denise McDonell for expert technical assistance, Derek Spielman for insight on pathology (both University of Sydney), and Karrie Rose, Sheryl Sangster and Jane Hall (Australian Registry of Wildlife Health) for access to the registry records. We thank anonymous reviewers for their comments that improved the manuscript.