Implications
We found that breeding objectives for sheep are similar in Western Australian regions with low and high reliability of pasture growth with emphasis on faster growing sheep. Alternatively, regions with medium reliability of pasture growth require a different breeding programme, with emphasis on reducing fibre diameter. Therefore, farmers will need to adapt the type of sheep they breed based on their region. In addition, breeders can provide farmers from regions with high and low reliability with the same type of sheep assuming no genotype by environment interactions altering the present perception that different sheep are required for these regions.
Introduction
Breeding programmes for livestock require clearly defined breeding objectives that enable the selection of animals that will make the most money per hectare (ha) in a given production system. Changes in optimal management need to be accounted for when calculating how the profitability of a farm is influenced by changing traits of animals (Groen, Reference Groen1989; Amer, Reference Amer1994). In areas where sheep are produced in Western Australia, there are big differences between regions in the amount and variation of pasture growth within and between years (Rossiter, Reference Rossiter1966; Schut et al., Reference Schut, Gherardi and Wood2010). These differences between regions in pasture growth can affect the optimal management of livestock (Chapman et al., Reference Chapman, Cullen, Johnson and Beca2009; Young et al., Reference Young, Thompson, Curnow and Oldham2011). These changes in management may also affect optimal breeding objectives, because changing each trait can change the energy requirements of sheep by different amounts and at different times of the year. It is, therefore, likely that different regions require different breeding objectives.
Farming systems become more vulnerable when pasture growth and prices vary across years, because the optimal stocking rate is different in each year (Rose et al., Reference Rose, Mulder, Thompson, van der Werf and van Arendonk2014). Many modelling studies have shown that increased climate variability decreases the number of livestock that can be managed per unit of land (Olson and Mikesell, Reference Olson and Mikesell1988; Kingwell et al., Reference Kingwell, Pannell and Robinson1993; Kobayashi et al., Reference Kobayashi, Howitt, Jarvis and Laca2007). This modelling is supported by surveys of farmers, which suggest that most Australian farmers manage the stocking system at a fixed, manageable number of ewes to avoid having too many sheep in years with low pasture growth (Doyle et al., Reference Doyle, Grimm and Thompson1993; Austen et al., Reference Austen, Sale, Clark and Graetz2002; Robertson and Wimalasuriya, Reference Robertson and Wimalasuriya2004). Therefore, regions with more reliable pasture growth should be able to manage sheep at a higher stocking rate, which may affect the value of traits in different regions.
In addition, Rose et al. (Reference Rose, Mulder, Thompson, van der Werf and van Arendonk2014) found traits that affect energy requirements the most had lower economic values when pasture growth varied between years. Therefore, traits that have a greater effect on energy requirements are likely to have more value in regions that have less variation in pasture growth across each year, because drought periods are less common. Therefore, we tested the hypothesis that economic values and responses to selection of sheep breeding objective traits change for different regions depending on how pasture growth varies across years.
Material and methods
Testing the hypothesis that economic values and optimal response to selection in sheep depend on the climatic region required the following four steps:
-
1. Define climatic zones: pasture growth and meat, wool and grain prices defined for regions with different reliability of pasture growth.
-
2. Model: develop a bio-economic model of a sheep farm with interactions between pasture growth, sheep production and commodity prices.
-
3. Economic values: calculate economic values for each trait using this bio-economic model, and vary assumptions about pasture variability and associated price changes for grain, wool and meat.
-
4. Response to selection: calculate optimal responses to selection for each trait for each climatic zone, given the genetic parameters and economic values of traits.
Climatic zones
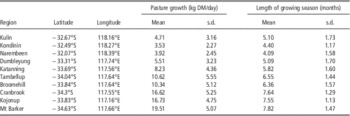
We used 10 climatic zones that represent the range of sheep farming areas of Western Australia (see Supplementary Figure S1; Table 1). These regions are characterised by warm/hot dry summers and cool/mild wet winters and have different amounts and distribution of pasture growth across the year (see Supplementary Figure S2 for total pasture growth). The mean annual pasture growth decreases and standard deviation of annual pasture growth increases the further north and east the regions are from the ocean (Table 1). The length of the pasture growth season also decreases and becomes more variable across years the further the regions are away from the ocean. Therefore, the CV of pasture growth increases and the reliability of pasture growth decreases when moving further from the ocean. This decrease in reliability makes these 10 regions ideal to investigate whether breeding programmes are affected by the variability in pasture growth.
Longitude, latitude, mean annual pasture growth and mean length of growing season from 2002 to 2012 for the 10 study regions

The s.d. and CV of annual pasture growth and s.d. of length of growing season across the 11 years are also shown.
We used data on 11 years of pasture growth (Supplementary Figure S2) and prices (Supplementary Figure S3) from 2002 to 2012. We included the actual prices for grain, meat and wool (Supplementary Figure S3), and thus correlations between pasture growth and prices were included in the calculations for economic values. We assumed that all regions had the same prices, as sheep producers in these regions have access to the same markets for sheep and wool sales. This is because wool, sheep and grain have similar centralised selling points and can be transported within the state depending on the best price. The fluctuation of prices reflects the supply and demand for each commodity over time, which is affected by many factors including the amount of pasture growth in all regions of the state. Therefore, including different pasture growth for each region but the same prices will include all the relevant correlations between prices and pasture growth in each region.
Data on pasture growth rates were from Pastures from Space (Hill et al., Reference Hill, Donald, Vickery, Moore and Donnelly1999). Data on wool prices were from the Western region micron price guide from the Wool Desk, Department of Agriculture and Food WA and Australian Wool Exchange (DAFWA, 2012). Data on meat prices were hogget and mutton prices from Meat and Livestock, Australia’s National Livestock Reporting Service (MLA, 2012). Grain prices were obtained from Co-operative Bulk Handling (CBH, 2012).
Model
We modelled monthly production decisions for sheep farms with self-replacing Merino flocks bred for wool and meat using an adapted version of the model described by Rose et al. (Reference Rose, Mulder, Thompson, van der Werf and van Arendonk2014). This model maximised profit from wool and sheep sales per ha by optimising sheep numbers, sheep sales and grain feeding based on pasture availability and prices of grain, wool and meat. We maximised profit per ha, because pasture growth per ha affects stocking rate, which mostly determines farm profit (Warn et al., Reference Warn, Geenty and McEachern2006; Young et al., Reference Young, Thompson, Curnow and Oldham2011). Therefore, we optimised management of sheep sales and grain feeding per ha using the General Algebraic Modelling System with the linear programming solver BDMLP (Brooke et al., Reference Brooke, Kendrick and Meeraus2013).
The model of Rose et al. (Reference Rose, Mulder, Thompson, van der Werf and van Arendonk2014) optimised management decisions across 5 years (2005 to 2009) using dynamic recursive analysis to maximise profit when commodity prices and pasture growth varied annually. Management could adapt to varying pasture growth and commodity prices by changing sheep numbers, age structure of the flock and amount of grain fed to sheep. In this study, however, we optimised management across all years to find the most profitable long-term stocking rate rather than optimising stocking rate every year, representing farmers trying to avoid managing high sheep numbers during unfavourable years. In addition, we maximised profit across 11 years to provide a better long-term indication of the effect of pasture growth on profit and the economic values of traits.
The optimisation included five groups of equations, profit (objective function), flock structure, pasture, energy and intake. Profit depended on the number of sheep, sheep sold and grain intake. The amount of pasture available affected how much pasture could be consumed by sheep, which also affected how much was available for the next period. The number of sheep depended on energy requirements, potential intake and the number of sheep sold. The amount of pasture and grain consumed was constrained by the potential intake of the sheep, whereas pasture and grain consumed had to match the energy requirements of the sheep.
Profit was income from meat and wool sales minus variable and grain costs. Meat sales were the product of number of sheep sold, live weight, price per kg carcass and carcass dressing percentage. Sheep sales were split into mutton (over 20 months old) and hoggets (<20 months old) with different prices for both classes. We assumed that the minimum carcass weight at which sheep can be sold to be 16 kg. Wool income was the product of number of sheep in November (shearing month), wool weight and wool price minus shearing costs. The profit equation, therefore, included all the relevant incomes and costs to calculate the impact of varying prices and pasture growth on breeding objectives.
We maximised profit across 11 years by optimising each year in a sequence, fixing the number of sheep across years and carrying over the amount of pasture from 1 year to the next. We found the optimal flock size by fixing the number of ewes mated and increasing the number by 0.1 ewes mated per ha until we found the maximum profit for the 11 study years. An example of how optimal profit was found is shown in Supplementary Figure S4 for Narembeen. The flock structure was optimised for each climatic region and each trait using average pasture growth and prices. Using these methods, we were able to optimise management of sheep across 11 years to estimate economic values for traits. In this way, we could account for optimal management across years with respect to changes in the number of sheep and flock structure.
We limited the amount of pasture in December to be at least 800 kg/ha. This lower limit prevented the pasture being grazed too low, which would cause soil erosion (Moore et al., Reference Moore, Bell and Revell2009). In years when pasture growth was not enough to have 800 kg DM/ha in December, we were not able to find a solution, because it is impossible to have 800 kg DM/ha as a minimum. In such cases, we lowered the lower limit of pasture in December by 10 kg DM/ha increments until the programme could find a feasible solution. We did not include any consequences for future pasture growth when the pasture limit was lowered. The final amount of pasture in December became the starting amount for the next year’s analysis.
Economic values
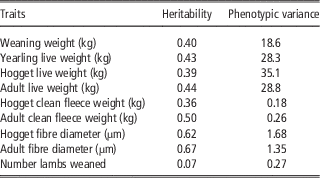
Breeding programmes aim to increase profit per animal through genetic improvement of traits that affect profit. Therefore, economic values for each trait should be estimated. Mathematically, the breeding objective can be represented as a linear equation in which breeding values for each trait are multiplied with economic values (Hazel, 1943). We calculated the economic value for nine traits shown in Table 2. These traits represent the economically important traits in current Merino breeding programmes in Australia (Swan et al., Reference Swan, van der Werf and Atkins2007), with live weight and number of lambs weaned important for meat income and clean fleece weight and fibre diameter important for wool income.
Phenotypic variance and heritability of traits used to calculate economic values and responses to selection from the MERINOSELECT database (Brown et al., Reference Brown, Ball, Huisman, Swan, Atkins, Graser, Banks, Swan and Woolaston2006)

We calculated the economic values for each trait as the difference in profit when increasing the trait by one genetic standard deviation compared with when the trait was not improved, while keeping all other traits constant. One genetic standard deviation represents how easily traits change under selection. When we changed the traits, the energy requirements and potential feed intake of all animals changed. Increasing live weight, clean fleece weight and number of lambs weaned increased the metabolisable energy requirements. Increasing live weight increased the potential intake of sheep because bigger sheep can eat more. Neither energy requirements nor potential intake changed when we changed fibre diameter.
For adult live weight, we increased live weights and standard reference weight of sheep older than 20 months but did not change the live weight at any other age. For weaning, yearling and hogget live weight, we increased the live weight at the relevant age, adapting the curves from birth to 20 months old (Supplementary Figure S5). These adaptations meant that the weights before and after each age measurement were also altered. For example, when weaning weight increased by one genetic standard deviation, we adjusted the curve so that there was a higher growth rate up to weaning and a lower growth rate after weaning. Increasing number of lambs weaned changed the proportion of ewes with zero, one and two lambs born and weaned based on Supplementary Figure S5, the same as described in Rose et al. (Reference Rose, Mulder, Thompson, van der Werf and van Arendonk2014). Using the relationships in Supplementary Figure S6, we estimated the number of ewes in each birth and wean class based on number of lambs weaned per ewe in the flock. Increasing the number of lambs weaned increased the proportion of ewes that gave birth to and weaned two lambs and decreased the proportion of ewes that gave birth to and weaned no lambs. Ewes that give birth to and wean two lambs have higher energy requirements for pregnancy and lactation than ewes that give birth and wean one lamb. In addition, the flock structure changed when the number of lambs weaned increased. For more details, see Rose et al. (Reference Rose, Mulder, Thompson, van der Werf and van Arendonk2014).
We used the economic values per unit of the trait (v) to calculate the relative contribution (
 $$c_{x}^{2} $$
) of each trait (x) to the genetic variance (
 $$\sigma _{H}^{2} ={\bf v}^{T} {\times}{\bf G}{\times}{\bf v}$$
) of the breeding objective (H) using the following equation:
 $$c_{x}^{2} {\rm =}{{{\bf V}{\times}{\bf G}{\times}{\bf v}} \over {{\bf v}^{T} {\times}{\bf G}{\times}{\bf v}}}$$
Where V is a matrix with economic values on the diagonal, G the genetic variance–covariance matrix and v a vector of economic values. More detailed information about how we calculated the relative contributions are given in Supplementary Material S1. We also calculated the correlations between breeding objectives for each region (
 $r_{{H_{i} {\rm ,}H_{j} }} $
) using the equation:
 $$r_{{H_{i} {\rm ,}H_{j} }} {\rm =} {{{\bf v}_{i}^{T} {\times} {\bf G}{\times} {\bf v}_{j} } \over {\sqrt {\sigma _{{H_{i} }}^{2} {\times}\sigma _{{H_{j} }}^{2} } }}$$
Where v
i
are the vectors with the economic values for breeding objectives i and j, G the genetic variance–covariance matrix and
 $$\sigma _{{H_{i} }}^{2} $$
and
 $$\sigma _{{H_{j} }}^{2} $$
are the variance of breeding objectives i and j. The correlations between breeding objectives show how much the breeding objectives are genetically different.
Response to selection
Response to selection is the expected genetic change in each trait when selecting from the index defined by economic values. When multiple traits are included in a breeding objective, then the response to selection is the response in the aggregate genotype, which is the product of the economic values for all traits and the responses per trait. The ease of changing traits depends on the additive genetic variance of each trait, but also on the heritability and the genetic correlations with other traits in the aggregate genotype. Traits with higher genetic variation have a higher potential to be improved. Because the aggregate genotype also includes the genetic correlations between traits, putting more emphasis on one trait will also change traits that are correlated.
The expected response to selection with the economic values from each climatic region was calculated using SelAction (Rutten et al., Reference Rutten, Bijma, Woolliams and van Arendonk2002). For each region, we assumed that the same breeding programme and genetic parameters, from the MERINOSELECT database (Brown et al., Reference Brown, Ball, Huisman, Swan, Atkins, Graser, Banks, Swan and Woolaston2006), were used (see Tables 2 and 3) that differences between regions were due to differences in economic values and not due to differences in breeding programmes. We assumed first mating at 19 months of age with a ewe-to-ram ratio of 20 : 1. Each ewe gave birth to 0.8 lambs once per year with 10% death and culling for ewes and 50% for rams. These numbers are similar to what was used in the model described in this paper. For more information see Rose et al. (Reference Rose, Mulder, Thompson, van der Werf and van Arendonk2014). We used seven age classes representing 1 year each, with weaning weight, yearling weight, fibre diameter and clean fleece weight measured at age 1 and hogget weight measured at age 2, and adult fibre diameter, clean fleece weight and live weight and number of lambs weaned recorded for classes 3 to 7. Rams and ewes were selected based on own performance and based on 15 half sibs from 19 dams for all traits apart from number of lambs weaned. For number of lambs weaned, ewes were selected based on own performance and seven half sib sisters from nine ewes. For number of lambs weaned, rams were selected based on the performance of eight half sib sisters from 10 dams. For all traits at all ages, ewes and sires were selected based on BLUP-estimated breeding value. Selection responses were predicted with a pseudo-BLUP selection index (Rutten et al., Reference Rutten, Bijma, Woolliams and van Arendonk2002).
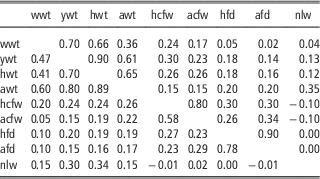
Genetic (above diagonal) and phenotypic (below diagonal) correlations between breeding objective traits from the MERINOSELECT database (Brown et al., Reference Brown, Ball, Huisman, Swan, Atkins, Graser, Banks, Swan and Woolaston2006)

wwt=weaning live weight; ywt=yearling weaning weight; hwt=hogget live weight; hcfw=hogget clean fleece weight; acfw=adult clean fleece weight; hfd=hogget fibre diameter; afd=adult fibre diameter; nlw=number of lambs weaned.
Statistical analysis of breeding objectives and response to selection
For each trait, we tested whether the relationship between the CV of annual pasture growth was significant with economic values, relative contribution to breeding objective and response to selection. We tested the significance using ANOVA in the R software (R Core Team, 2012). Our first null hypothesis was that CV does not significantly explain differences in economic values, relative contribution to breeding objective and response to selection. If this null hypothesis was rejected, we then tested a second null hypothesis that a linear function fits the data better than a quadratic function. We rejected the null hypothesis if the probability of a better fit was <0.05. These tests were carried out using ANOVA, with an F test testing whether the quadratic term of the polynomial was significant compared with the linear polynomial. These tests were important to interpret how economic values, relative contribution to breeding objective and response to selection are affected by pasture growth and variation in each region.
Results
Effect of varying pasture growth on profit
Profit decreased when the CV of pasture growth between years increased (Figure 1), because less sheep could be managed per ha (Supplementary Figure S7). In addition, income and variable costs decreased as the CV of pasture growth increased (Figure 1), with grain costs having more influence on profit as the CV of pasture growth increased (Supplementary Figure S8). Grain prices decreased as CV of pasture growth increased, but grain requirements increased per sheep because the frequency and length of drought periods increased as the CV of pasture growth increased. Therefore, as pasture reliability decreased, stocking rate decreased and grain costs increased, which decreased profit.
Profit, incomes and costs for each region are represented as a function of CV of annual pasture growth.

Economic values and breeding objectives
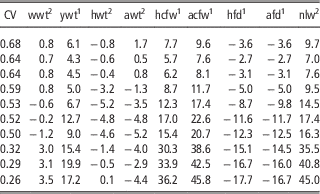
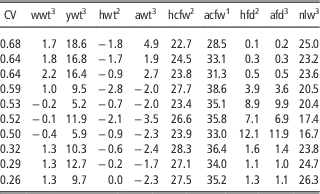
The economic value of weaning weight, hogget live weight and adult live weight were close to zero and mostly negative (Table 4). These economic values were mostly negative because energy requirements increased when live weight increased. The relationship between economic values and CV of pasture growth were quadratic (P<0.01), and regions with high and low CV of pasture growth had higher economic values for these traits compared with regions with medium CV of pasture growth.
Economic values/ha per genetic standard deviation across regions represented by CV of annual pasture growth

wwt=weaning live weight; ywt=yearling weaning weight; hwt=hogget live weight; awt=adult live weight; hcfw=hogget clean fleece weight; acfw=adult clean fleece weight; hfd=hogget fibre diameter; afd=adult fibre diameter; nlw=number of lambs weaned.
1 Linear relationship between economic value and CV of pasture growth (P<0.05).
2 Significant quadratic relationship between economic value and CV of pasture growth (P<0.01).
Yearling weight, hogget fleece weight, adult fleece weight and number of lambs weaned had the largest effect on income, and their economic values decreased as the CV of pasture growth increased. Their economic value decreased because less sheep could be managed, decreasing the benefits of improving traits. The economic value for fibre diameter traits increased as CV of pasture growth decreased. The economic values for yearling live weight and wool traits increased linearly with increasing CV of pasture growth (P<0.01), but the economic value for number of lambs weaned had a quadratic relationship with CV (P<0.01). The slope of the economic value for lambs weaned decreased as CV of pasture growth increased, and economic values were similar between regions when CV was >0.5.
The relative contribution of traits to the breeding objective was highest for adult fleece weight, hogget fleece weight and number of lambs weaned (Table 5). The next main contributors were yearling live weight and fibre diameter traits, depending on the relationships between economic values and reliability of pasture growth. The relationship between CV of pasture growth and relative importance of all traits was quadratic (P<0.01), apart from hogget fleece weight, which was linear (P<0.01), and adult fleece weight, which had no relationship with CV of pasture growth. The relative importance of weaning live weight, yearling live weight, adult live weight and number of lambs weaned had a minimum around CV of annual pasture growth of 0.5. The relative importance of hogget and adult fibre diameter had a maximum around CV of pasture growth of 0.5. The relative importance of hogget live weight and hogget fleece weight decreased linearly as CV of pasture growth increased. The relative importance of adult fleece weight was the same for all regions. These results show that relationships between relative contributions and CV of pasture growth for each trait reflect the relationships between economic values and CV of pasture growth.
Relative contribution of each trait (%) to the breeding objective across regions

wwt=weaning live weight; ywt=yearling live weight; hwt=hogget live weight; awt=adult live weight; hcfw=hogget clean fleece weight; acfw=adult clean fleece weight; hfd=hogget fibre diameter; afd=adult fibre diameter; nlw=number of lambs weaned.
1 No relationship between economic value and CV of pasture growth.
2 Linear relationship between economic value and CV of pasture growth (P<0.05).
3 Quadratic relationship between economic value and CV of pasture growth (P<0.01).
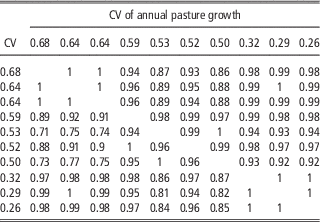
These differences in relative contributions across regions affected the correlations between breeding objectives (Table 6). There appears to be three distinct groups of regions:
-
1. High pasture reliability: Mt Barker, Kojonup and Cranbrook with CV of pasture growth from 0.29 to 0.32.
-
2. Medium pasture reliability: Broomehill, Tambellup, Katanning and Dumbleyung with CV of pasture growth from 0.50 to 0.59.
-
3. Low pasture reliability: Narembeen, Kondinin and Kulin with CV of pasture growth from 0.64 to 0.68.
Correlations between regions represented by CV of annual pasture growth for relative contribution (above diagonal) and response to selection (below diagonal)

The breeding objectives of the high and low pasture reliability groups were highly correlated (0.98 to 1.00), whereas the medium reliability group had lower correlations with both the low and medium group (0.86 to 0.98). Therefore, there appears to be two breeding objectives, one for low and high reliability pasture regions and another for the medium reliability pasture growth regions.
Response to selection
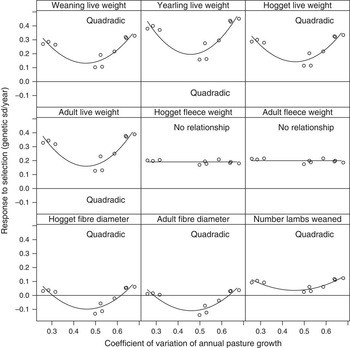
The response to selection in genetic standard deviations per year was highest for live weight traits and fleece weight traits (Figure 2). The response in fleece weight traits was the same for all regions, whereas all other traits had a quadratic relationship (P<0.01) between CV of pasture growth and response to selection. Live weight traits and number of lambs weaned had a minimum response around CV=0.5. Fibre diameter traits had a maximum negative response around 0.5 CV of annual pasture growth. The response in number of lambs weaned was low, whereas the response to selection for live weight traits was high.
Response to selection in genetic standard deviations across regions represented by CV of annual pasture growth for relative contribution for each trait.

The correlations between responses across the regions had the same pattern as the correlations between breeding objectives (Table 6). The responses to selection of the high and low pasture reliability groups were highly correlated (0.97 to 1.00), whereas the medium reliability group had lower correlations with both the low and medium group (0.71 to 0.98). The correlations between responses reflect the correlations between regions for breeding objectives.
Discussion
Variation in pasture growth across years influenced the optimum breeding objectives for Merino-based sheep production systems in different regions of Western Australia. As the reliability of pasture growth across years decreased, the profit per ha decreased. In addition, as the reliability of pasture growth decreased, the economic value of most traits decreased, although this decrease was not always linear. This non-linear decrease for some traits caused differences in the relative contribution of traits to the breeding objective, which also affected the response to selection. Therefore, we accepted the hypothesis that economic values and response to selection of sheep breeding objective traits change depending on the distribution and variation of pasture growth across years.
Furthermore, based on correlations between breeding objectives and responses to selection, we found that a single breeding objective was suitable for regions with high or low reliability of pasture growth between years. This single breeding objective existed despite huge differences in the amount and variation of pasture growth between these regions. This common breeding objective had more emphasis on live weight and number of lambs weaned, whereas the objective for regions with medium pasture growth reliability had more emphasis on fibre diameter traits.
Regions with low or high reliability of pasture growth had similar breeding objectives because of differences in the distribution of pasture growth in each month between regions. Live weight traits at weaning, hogget and adult ages had more value in regions with high or low reliability of pasture growth, because increasing live weight increases potential intake or intake capacity of sheep (Freer et al., Reference Freer, Dove and Nolan2007). This increase of potential intake is important during drought periods, because dry pasture has low digestibility and takes longer to digest, which limits the amount of pasture that can be consumed. If sheep can feed on more dry pasture, a higher proportion of their energy requirements can be met from dry pasture, and the costs of supplementary feeding are reduced, especially in regions with long periods of drought. Regions with high reliability of pasture growth have huge peaks in pasture growth during spring. Despite this high peak in pasture growth, stocking rate is limited by periods of drought. This limitation occurs because a lot of pasture grows in a short period in spring, which is not utilised unless sheep are managed at a high stocking rate. The optimal stocking rate, however, is still limited by the short period of drought during each year. Therefore, increasing the potential intake reduces the influence of drought periods, which means more sheep can be managed and more of the pasture grown in spring is utilised. This extra value of live weight is similar to what Groen and Korver (Reference Groen and Korver1989) found in dairy cattle, where more forage can be given when potential intake increases, reducing concentrate requirements. We found that the benefit of increased intake capacity is also relevant for regions with high pasture growth, which is an important conclusion.
The quadratic relationship between economic value for lambs weaned and CV of pasture growth was due to differences in distribution of pasture growth between years. Every region had pasture growth during July and August in most years, the months with peak energy requirements for pregnancy and lactation. Therefore, when the number of lambs weaned increased, there was mostly green pasture available. As regions became less reliable, pasture started growing later in the years. The growing seasons shortened considerably between the regions with high and medium pasture growth reliability. Because autumn and early winter coincided with the start of pregnancy, the value of weaning more lambs was less for regions with medium pasture growth reliability. The decrease in length of the growing season was not so extreme between regions with medium and low pasture growth reliability. Therefore, the decrease in economic values in relation to CV of pasture growth between regions with medium and low pasture growth was also lower, causing the quadratic relationships.
These quadratic relationships are fundamental to understanding the differences between regions in terms of their reliability. However, because the reliability of pasture growth decreases fast between the three most reliable regions and the next eight regions, about 40% of the range of CV is missing. Therefore, although these quadratic relationships may be valid, the interpretation should be done cautiously. Despite this caution, it is clear that at low CVs, the responses were insensitive to the CV of pasture growth, but at the higher CVs (>0.5 or 0.5 to 0.68) there were a number of linear relationships where the responses to selection increased as the CV of pasture growth increased. Therefore, to strengthen our understanding of these relationships, it is important to include more regions to fill the gap between the most reliable regions and less-reliable regions. The results, however, still remain the same that regions with high and low pasture growth reliability have similar breeding objectives, regardless of the relationships between CV of pasture growth and economic values.
The magnitude of the relative contribution of traits to the breeding objective and the response to selection did not always match. For example, the number of lambs weaned had a low response to selection, despite a high contribution to the breeding objective. This low response was because the number of lambs weaned was only measured in adult ewes, which decreased the accuracy of selection compared with all other traits, which were recorded at higher ages. In addition, the heritability of number of lambs weaned was low, decreasing the accuracy of selection. Live weight, fleece weight and fibre diameter traits were recorded at several ages, with high correlations between each age group. Therefore, high response to selection at one age caused a high response at all other ages. Live weight had a high value at yearling age, which increased response at all other ages, although their economic values were close to zero. This difference in correlations has been demonstrated in cattle (Hirooka and Groen, Reference Hirooka and Groen1999) and pigs (Dube et al., Reference Dube, Mulugeta and Dzama2013). Therefore, responses to selection need to be calculated before comparing breeding programmes, because the differences in economic weights do not directly translate into equal differences in selection responses.
We found that regions with different pasture growth have different breeding objectives, but there could also be differences in the performance of animals within each region. This variation in pasture availability across regions can cause genotype by environment interactions changing the ranking of the best animals to select between environments (Falconer and Mackay, Reference Falconer and Mackay1996). In addition, within each region, changes in pasture growth between years can also cause genotype by environment interactions. For example, several studies in beef cattle (Sousa Júnior et al., Reference Sousa Júnior, IDPS, dos Santos, de Sousa, JLR and Filho2012) and dairy cattle (Kearney et al., Reference Kearney, Schutz, Boettcher and Weigel2004; McCarthy and Veerkamp, Reference McCarthy and Veerkamp2012) found genotype by environment interactions for production traits when resources were different, either because of the time of year, amount of rainfall or amount of grain supplement provided. Therefore, genotype by environment interactions between regions could make it difficult to use one breeding scheme for all environments (e.g. Mulder et al., Reference Mulder, Veerkamp, Ducro, van Arendonk and Bijma2006). Moreover, genotype by environment interactions between seasons make it difficult to select animals that have high performance in all seasons. For example, several studies have shown that selection for the best animals in good years can increase the sensitivity of animals to varying environments (Falconer, Reference Falconer1990; van der Waaij, Reference van der Waaij2004). This environmental sensitivity can reduce performance in poor years, which can have economic and welfare consequences. We did not include genotype by environment interaction in our comparison across or within regions. Including genotype by environment interactions within regions may change the optimal breeding programme in each region, because genotype by environment interactions may differ between traits and between regions. Therefore, optimal breeding programmes for regions could be further affected by the genotype by environment interactions between regions and between seasons.
Rose et al. (Reference Rose, Mulder, Thompson, van der Werf and van Arendonk2014) reported that including varying pasture growth and prices increased the estimated economic values for different traits compared with using average pasture growth and prices. The study by Rose et al. (Reference Rose, Mulder, Thompson, van der Werf and van Arendonk2014) used dynamic programming to simulate farmers altering their management decisions in response to changes in pasture growth and prices each year, whereas in this study we optimised sheep numbers across all years. We can compare the economic values from Katanning in this study to those of Rose et al. (Reference Rose, Mulder, Thompson, van der Werf and van Arendonk2014). The economic values for number of lambs weaned decreased from $AU26 to $AU 15 per ha, for adult fibre diameter increased from −21 to −10 and for adult fleece weight decreased from 22 to 17. The magnitude of economic values decreased between the studies; however, in this study, the relative importance of fleece weight was higher compared with the study by Rose et al. (Reference Rose, Mulder, Thompson, van der Werf and van Arendonk2014). This difference in economic values was because fleece weight made the farm more vulnerable to changes in pasture growth and prices when management was optimised each year. Optimising management across all years meant that fleece weight made the farm less vulnerable, because an optimal stocking rate across all years could be estimated. Although it is difficult to compare the two studies, because they used different study years, it appears that there were big differences in the relative importance of traits when sheep numbers were optimised in each year or across years. In conclusion, this study provides a set of economic values for farmers that manage variation in pasture growth by managing the same number of sheep at a lower stocking rate, which is a different type of farm simulated in the study by Rose et al. (Reference Rose, Mulder, Thompson, van der Werf and van Arendonk2014).
We used the CV as the indicator of pasture reliability, but average pasture growth decreased as the CV increased. Therefore, it was difficult to disentangle the effects of total pasture growth and variation across years. Within the groups of regions with low, medium and high pasture growth, it is possible to investigate the effects of pasture growth, because the CV of pasture growth was similar within the groups. In addition, we could have simulated pasture growth to have the same mean pasture growth and different variation across years. However, using real pasture growth data makes our research more relevant for farmers who have uncertain pasture growth across years than using simulated data.
Acknowledgements
This research was financed by the Department of Food and Agriculture Western Australia, The Sheep Cooperative Research Centre, Meat and Livestock Australia and the Wageningen University.
Supplementary material
To view supplementary material for this article, please visit http://dx.doi.org/10.1017/S1751731115000476