INTRODUCTION
Approximately 70% of individuals suffering mild-moderate depression, particularly older adults, do not seek treatment (Pratt & Brody, Reference Pratt and Brody2008). If and when these individuals are seen medically, many are treatment refractory (Alexopoulos, Reference Alexopoulos2011). Psychomotor speed, i.e., timed activity requiring “movement or action” including perceptual processing, programming, and execution (Schrijvers, Hulstijn, & Sabbe, Reference Schrijvers, Hulstijn and Sabbe2008) has been used as a predictor of poorer treatment response in major depressive disorder (MDD) (Caligiuri et al., Reference Caligiuri, Gentili, Eberson, Kelsoe, Rapaport and Gillin2003). Furthermore, psychomotor slowing has been documented across tasks measuring cognitive and motor aspects of performance in MDD (Schrijvers et al., Reference Schrijvers, Hulstijn and Sabbe2008); however, age has rarely been considered (Caligiuri et al., Reference Caligiuri, Gentili, Eberson, Kelsoe, Rapaport and Gillin2003; Pier, Hulstijn, & Sabbe, Reference Pier, Hulstijn and Sabbe2004a, Reference Pier, Hulstijn and Sabbe2004b; Tucha et al., Reference Tucha, Aschenbrenner, Eichhammer, Putzhammer, Sartor, Klein and Lange2002). Revisiting the role of psychomotor speed in unmedicated younger and older adults with MDD may help determine how age impacts slowing prior to the initiation of anti-depressant medication for more accurate predictive models of treatment response.
To date, MDD studies of psychomotor speed have outlined the negative impact of slowing on simple and complex motor tasks as well as the “upstream” influences on higher-level cognitive processes. For example, studies using a simple handwriting task to assess time to drawing initiation (i.e., cognitive aspects of psychomotor speed including perceptual processing and programming) and total movement time (i.e., “execution” or motor aspects of psychomotor speed) showed that medicated MDD patients were slower than controls across both aspects of performance (Pier, Hulstijn, & Sabbe, Reference Pier, Hulstijn and Sabbe2004c; Sabbe, Hulstijn, van Hoof, Tuynman-Qua, & Zitman, Reference Sabbe, Hulstijn, van Hoof, Tuynman-Qua and Zitman1999). Individuals with MDD were not only slower than non-depressed controls on simple handwriting tasks but also more complex drawing tasks (Lohr, May, & Caligiuri, Reference Lohr, May and Caligiuri2012; Schrijvers et al., Reference Schrijvers, Hulstijn and Sabbe2008; Sobin & Sackeim, Reference Sobin and Sackeim1997). Psychomotor slowing has also been shown to negatively impact performance on complex non-motor tasks including measures of executive functioning, learning, and memory—particularly in older adults diagnosed with depression (Butters et al., Reference Butters, Whyte, Nebes, Begley, Dew, Mulsant and Becker2004; Nebes et al., Reference Nebes, Butters, Mulsant, Pollock, Zmuda, Houck and Reynolds2000; Pimontel, Culang-Reinlieb, Morimoto, & Sneed, Reference Pimontel, Culang-Reinlieb, Morimoto and Sneed2012). Measures of slowing used in these studies were not derived from handwriting or figure drawing tasks per se, but from a variety of tasks incorporating perceptual processing, programming, and motor speed (e.g., Trail Making Test Part A, Digit Symbol, Grooved Pegboard) (Butters et al., Reference Butters, Whyte, Nebes, Begley, Dew, Mulsant and Becker2004; Nebes et al., Reference Nebes, Butters, Mulsant, Pollock, Zmuda, Houck and Reynolds2000; Pimontel et al., Reference Pimontel, Culang-Reinlieb, Morimoto and Sneed2012). Finding a way to disambiguate cognitive (i.e., perceptual processing and programming) from motor aspects of psychomotor slowing using one common and easily administered task that combines simple drawing with more complex functioning may allow for an expedited, more streamlined approach to identify individuals susceptible to negative outcomes in MDD (Schrijvers et al., Reference Schrijvers, Hulstijn and Sabbe2008).
A recent study of specific cognitive constructs underlying speeded deficits in MDD may shed light on the task of choice for streamlining a psychomotor assessment in MDD. Using a finger tapping/button press task with internal versus external cuing for response initiation and selection, investigators revealed differential responses slowing in patients with MDD, but only when they were required to use internal rather than external cues for response selection (Hoffstaedter, Sarlon, Grefkes, & Eickhoff, Reference Hoffstaedter, Sarlon, Grefkes and Eickhoff2012). Investigators concluded the cognitive resources required for responding to internal versus external cues differed and influenced speed of responding accordingly (Hoffstaedter et al., Reference Hoffstaedter, Sarlon, Grefkes and Eickhoff2012). Thus, external cuing required fewer cognitive resources by providing a structure to facilitate motor performance in MDD. In contrast, internal cuing required more self-initiated cognitive processes like executive, attention and perceptual processing speed that took longer to mobilize in MDD and thus, slowed motor performance (Hoffstaedter et al., Reference Hoffstaedter, Sarlon, Grefkes and Eickhoff2012). While this study used one task, it did so in a young population and without a direct measure of cognitive speed to accompany their motor speed metric. Systematic experimentation of internal (high cognitive demand) versus external (low cognitive demand) cuing in combination with an assessment of the cognitive and motor aspects of psychomotor slowing may aid identification of individuals with depression at risk of poor outcomes.
The clock drawing test (CDT) has long provided a quick yet comprehensive snapshot into a patient’s abilities (Cosentino, Jefferson, Chute, Kaplan, & Libon, Reference Cosentino, Jefferson, Chute, Kaplan and Libon2004; Libon, Malamut, Swenson, Sands, & Cloud, Reference Libon, Malamut, Swenson, Sands and Cloud1996; Royall, Cordes, & Polk, Reference Royall, Cordes and Polk1998) and may also prove useful in distinguishing cognitive from motor aspects of slowing in depression across internal and external processing. To complete the CDT, participants draw the face of a clock with the hands set to a pre-designated time (typically “10 after 11”) first to Command and then Copy where a model clock is provided. Given work using internal/external cueing (Hoffstaedter et al., Reference Hoffstaedter, Sarlon, Grefkes and Eickhoff2012), we surmised the Command condition, when the participant initiates and completes the drawing unassisted, necessitates greater cognitive demands including executive, attention and perceptual processes than the Copy condition. In contrast, the Copy condition with its external cue (i.e., clock model) reduced the internal cognitive resources required (e.g., to transform the verbal commands of setting the hands of the clock into a graphomotor representation).
Administering the CDT using digital technology (i.e., the Digital Clock Drawing Test; dCDT) allows the examiner to measure distinct aspects or components of psychomotor slowing (Davis et al., Reference Davis, Penney, Pittman, Libon, Swenson and Kaplan2010; Penney, Davis, et al., Reference Penney, Davis, Libon, Lamar, Price, Swenson and Kaplan2010). The precision with which data are collected also provides greater standardized administration and scoring for a test that has little consensus scoring to date (Cosentino et al., Reference Cosentino, Jefferson, Chute, Kaplan and Libon2004; Libon et al., Reference Libon, Malamut, Swenson, Sands and Cloud1996; Royall et al., Reference Royall, Cordes and Polk1998). The digital technology of the current research measures pen position on coded paper 80 times per second, enabling position detection and facilitating the distinctions between overlapping cognitive and motor components of psychomotor slowing in the CDT. Combining digital technology with standardized administration and computer-assisted scoring procedures (Davis et al., Reference Davis, Penney, Pittman, Libon, Swenson and Kaplan2010; Penney, Davis, et al., Reference Penney, Davis, Libon, Lamar, Price, Swenson and Kaplan2010) allowed for the dissection of the total time to complete the dCDT into discrete segments such as time spent drawing on the paper versus time spent not drawing (i.e., pauses between pen strokes when the participant performed unobservable cognitive activity). We referred to these activity distinctions as Ink time and Think time, respectively (Cunningham et al., Reference Cunningham, Penney, Davis, Tanner, Nguyen, Schwab and Price2012). Additionally, because the dCDT collected data across both Command and Copy conditions, exploration of the degree of resources required under each condition were possible.
Our study aim was to determine the utility of the dCDT to distinguish the cognitive and motor aspects of slowing in unmedicated depressed and non-depressed younger and older adults. We sought to determine the separate and interactive effects of Age and Affect on Ink time versus Think time for both Command and Copy dCDT conditions in a comprehensive 2X2 (AgeXAffect) study design. We investigated our variables of interest within the context of the resources previously assumed to be important in internally versus externally mediated performance in MDD (Hoffstaedter et al., Reference Hoffstaedter, Sarlon, Grefkes and Eickhoff2012). For example, given the potential internal, i.e., self-initiated, nature of the Command condition, we hypothesized that speed would be affected by depression within this dCDT condition. Given internal cuing may require self-initiated cognitive processes including executive, attention and perceptual processing speed (Hoffstaedter et al., Reference Hoffstaedter, Sarlon, Grefkes and Eickhoff2012), we further hypothesized that cognitive Think times would be lower relative to motor Ink times, and primarily in the older depressed group. We based our hypothesis regarding the older depressed group on studies showing deficits on tasks that incorporate aspects of psychomotor slowing, i.e., perceptual processing, programming, and motor speed in a similarly aged depressed cohort (Butters et al., Reference Butters, Whyte, Nebes, Begley, Dew, Mulsant and Becker2004; Nebes et al., Reference Nebes, Butters, Mulsant, Pollock, Zmuda, Houck and Reynolds2000; Pimontel et al., Reference Pimontel, Culang-Reinlieb, Morimoto and Sneed2012). We also explored associations between Think and Ink time variables to indices of cognitive functioning and hypothesized that only Think times would correlate with higher-level cognition in depressed and non-depressed groups.
METHODS
Participants
Data were collected from a larger research program at the University of Illinois at Chicago (UIC) Department of Psychiatry including an observational study of type 2 diabetes in depression. Informed consent was obtained according to the Institutional Review Board guidelines at UIC and in accordance with the Declaration of Helsinki.
Participants, ≥30 years old, were recruited through community outreach (e.g., advertisements, fliers). An initial telephone screen determined eligibility. Exclusion criteria at the time of the telephone screen included a diagnosis of any Axis I disorder except MDD, a history of head trauma or loss of consciousness, a history or presence of any neurological (e.g., dementia, stroke, seizure) disorders and a history or presence of any substance abuse or dependence. Depressed participants were free of antidepressant medication for at least 2 weeks to study MDD in an untreated state (no individual was taken off medication to participate). A portion of participants were medication naïve. A history of stable or remitted medical disorders was not an exclusionary factor.
Following the phone screen, participants were scheduled for an evaluation that included cognitive (Mini Mental State Examination; MMSE) (Folstein, Folstein, & McHugh, Reference Folstein, Folstein and McHugh1974) and affective (Structured Clinical Interview for the DSM-IV; SCID) (Spitzer, Williams, Gibbon, & First, Reference Spitzer, Williams, Gibbon and First1992) screens, administered by a trained research assistant for final inclusion/exclusion criteria. A board certified (A.K.) or board eligible (O.A.) psychiatrist then completed the 17-item Hamilton Rating Scale of Depression (HAM-D) (Hamilton, Reference Hamilton1960) for final determination of the presence/absence of depression. Euthymic adults were defined by a HAM-D score ≤8 and an absence of depressive symptoms on the SCID. Adults with depression were defined by a presence of depressive symptoms on the SCID and a HAM-D score ≥15 (criteria for MDD per the DSM). All raters were blind to telephone screen information.
Of the 148 participants deemed eligible for inclusion based on the criteria above and the age bands below, 36 were excluded for: treatment non-compliance for thyroid dysfunction or sleep apnea-2; taking gabapentin for nerve pain secondary to type 2 diabetes-2; English as a second language-6. Ten were excluded to match groups on type 2 diabetes and/or education; 16 were excluded to match euthymic and depressed older adults on age. Diabetes matching was conducted using presence/absence counts by group; age/education matching was based on mean/standard deviation.
Procedures
Vascular risk assessment
Given that depression in older adults may be associated with cardiovascular risk factors including diabetes (Alexopoulos et al., Reference Alexopoulos, Meyers, Young, Campbell, Silbersweig and Charlson1997), we calculated a Framingham Stroke Risk Profile score (FSRP) (Wolf, D’Agostino, Belanger, & Kannel, Reference Wolf, D’Agostino, Belanger and Kannel1991) based on: age, systolic blood pressure, anti-hypertensive therapy, diabetes, current cigarette smoking, cardiovascular disease, atrial fibrillation, and left ventricular atrophy. Laboratory testing from non-fasting blood draws at the time of the study documented levels of health related variables including hemoglobin A1c (hA1c).
Neuropsychological assessment
Participants completed a comprehensive neuropsychological protocol that included the dCDT. In addition to the four cognitive domains below, it included a subjective measure of depressive symptomatology (Center for Epidemiological Study of Depression scale, CESD) (Radloff, Reference Radloff1977; Radloff & Teri, Reference Radloff and Teri1986) and a measure of gross motor speed (Motor Trail Making Task, TMT-M) modeled after the Delis-Kaplan Executive Function System (D-KEFS) (Delis, Kaplan, & Kramer, Reference Delis, Kaplan and Kramer2001), but confined to one-page to mimic the traditional Trail Making Test (TMT) used in this study. Cognitive domains were based on the following: executive functioning (EF) included D-KEFS Verbal Fluency Category Switching total switching accuracy raw score (Delis et al., Reference Delis, Kaplan and Kramer2001), TMT-B time to completion, Stroop Interference Score (Golden, Reference Golden1978), Wechsler Adult Intelligence Scale 3rd Edition (WAIS-III) (Wechsler, Reference Wechsler1997a) Digit Span-Backward subtest raw score, and Self-Ordered Pointing Task total errors (Petrides, Alivisatos, & Frey, Reference Petrides, Alivisatos and Frey2002); attention and information processing (AIP) included raw scores from the Stroop Color Naming and Word Reading trials (Golden, Reference Golden1978), TMT-A time to completion, and WAIS-III Digit-Symbol Coding raw score (Wechsler, Reference Wechsler1997a); learning, memory, and recognition (LMR) included California Verbal Learning Test – 2nd Edition (CVLT) (Delis & Kramer, Reference Delis and Kramer2000) Short and Long Delay Free Recall totals and Recognition Discriminability Index calculated by [1-(false positive+misses/# possible correct)]*100, Wechsler Memory Scale – 3rd Edition (WMS-III) (Wechsler, Reference Wechsler1997b) Logical Memory I and II and Recognition raw scores, as well as Visual Reproduction I and II and Recognition raw scores; and semantic language (SEM) included Animal fluency measures of total correct, percent in cluster, and the Association Index (Carew, Lamar, Cloud, Grossman, & Libon, Reference Carew, Lamar, Cloud, Grossman and Libon1997). Participants also completed the Wechsler Test of Adult Reading (WTAR) (Wechsler, Reference Wechsler2001) to obtain a predicted verbal IQ (pVIQ).
Cognitive scores were standardized using the non-depressed control sample means and standard deviations by age group, with scores reversed where appropriate so that high scores reflected better performance. Composite Z-scores were then calculated for EF, AIP, LMR, and SEM. Cronbach’s alpha was computed for each cognitive domain to evaluate how well the variables measured each latent construct across the entire sample; resulting values suggested each composite score measured a unidimensional latent construct (EF, α=.82; AIP, α=.78; LMR, α=.90; SEM, α=.71).
The Digital Clock Drawing Test (dCDT) (Davis et al., Reference Davis, Penney, Pittman, Libon, Swenson and Kaplan2010; Penney, Davis, et al., Reference Penney, Davis, Libon, Lamar, Price, Swenson and Kaplan2010)
The dCDT was developed by Lahey Clinic and MIT in collaboration with the ClockSketch Consortium to provide a degree of detail and accuracy in the CDT impossible to achieve with ordinary pen and paper; potentially enabling a new degree of diagnostic information not hitherto detected. The dCDT uses digital pen technology developed by Anoto, Inc. The pen works as an ordinary ballpoint pen while capturing pen position 80 times ±.002. The Lahey/MIT software classifies each pen stroke (e.g., determines whether a stroke is the clock face, a hand, a digit, etc.) with up to 84% accuracy in healthy controls (Penney, Libon, et al., Reference Penney, Libon, Lamar, Swenson, Price, Weninger and Davis2010). The data reported by the pen is time-stamped, allowing the pen to capture both the final product (i.e., the clock drawing) and the behavior that produced it. This allows for more accurate classification of pen strokes.
As with the traditional CDT, the dCDT uses two conditions: Command and Copy. In the Command condition, participants are asked to “draw the face of a clock with all of the numbers and set the hands to 10 after 11.” Copy condition asks participants to copy a model of a clock with the hands set for “10 after 11”. The Copy condition is presented only after the Command condition is complete. Below are the dCDT parameters for the current research.
dCDT variables
-
∙ Total Time To Completion (TTC) – The time taken for the dCDT to be completed for Command and Copy, separately measured from when the participant begins drawing the clock to the end of the clock’s final element, but excludes the time taken to draw the clock circle. Clock circle drawing time was excluded because, unlike other clock elements, it is a single conceptual unit involving a large amount of ink placed quickly.
-
∙ Percent Ink Time (%Ink) – The total time the pen is in contact with the paper for each (Command and Copy) clock, excluding the time taken to draw the clock circle. %Ink is computed as (total ink time/TTC)*100. It indicates what percent of the TTC was spent drawing, and may serve as a way to assess motor execution or “doing” while taking into account individual differences in total drawing time.
-
∙ Percent Think Time (%Think) – The total time the pen is not in contact with the paper, measured from the completion of the first pen stroke to the beginning of the last pen stroke made during each clock. The intervening period of time between verbal instruction and drawing start time is not included in %Think. This is because the Command condition calculations for time begins at the first Command pen stroke and ends at the completion of the last Command stroke—determined using the computerized scoring program. Timing for the Copy condition was conducted in the same manner. %Think may provide a way to assess unobservable cognitive activity during the dCDT, e.g., “thinking” activity including perceptual processing and programming, and is calculated as: (total think time/TTC)*100 for each clock separately. (It is also 1 - %Ink.)
-
∙ Total Number of Strokes – This is a measure of the total number of distinct graphomotor marks completed with the pen during clock drawing to Command and Copy test conditions separately excluding strokes made in drawing the clock circle.
Statistical Analyses
Participants were divided into four groups based on age and affect: younger (30–50 years) euthymic and depressed groups, older (60+ years) euthymic and depressed groups. We constructed these groups with the expectation that providing a gap between young and old would better discriminate effects of cognitive and motor speed in aging and depression.
Group differences for demographic variables were measured using IBM SPSS Statistics 20 analysis of variance (ANOVA) for continuous variables and χ2 tests for categorical variables. Where indicated, significant demographic differences were then entered as covariates in all subsequent analyses. For our dCDT variables of interest, individual 22 analyses of covariance (ANCOVAs) were performed for Command and Copy conditions separately. Follow-up comparisons of estimated marginal means using least squares difference (LSD) were performed as needed. A series of Pearson Product Moment Correlations (2-tailed) explored the relationship between %Ink and %Think times and cognitive domains (EF, AIP, LMR, SEM). Given the exploratory nature of these correlations, significance was set at p=.05. While %Think and %Ink sum to 100% and thus results for each will mirror the other, it is still important to consider the data from both perspectives, given that increased ink time could be due to drawing more rather than drawing slower, and vice versa.
RESULTS
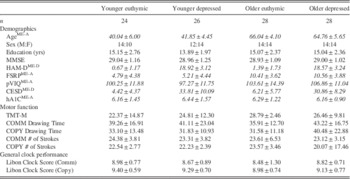
Of the 112 eligible participants, 106 (54 men, 52 women) had complete neuropsychological test data including the dCDT. Younger adults averaged 41 years of age (40.98±5.27) while older adults averaged 65 years of age (65.41±4.92). Both the depressed and euthymic groups averaged ~54 years of age (depressed=53.74±12.62; euthymic=54.04±14.01). All subjects were native English speakers (39 Caucasian, 51 African American, 16 Hispanic/Asian/Other) with ~15 years of education (14.78 ± 2.40) and all had MMSE scores ≥26 (Table 1).
Demographics and gross motor function across all groups

Note. ME-A=main effect across age; ME-D=main effect across depression (see p-values below); M:F=male:female; yrs=years; pVIQ=predicted verbal intelligence quotient; MMSE=Mini-Mental State Examination; HAM-D=Hamilton Depression Rating Scale; CESD=Center for Epidemiological Study of Depression; FSRP=Framingham Stroke Risk Profile; TMT-M=Trails part Motor. ME-A=age (Y<O, p<.001); pVIQ (Y<O, p=.008); FSRP (Y<O, p<.001); hA1c (Y>O, p=.008) but only after controlling for FSRP and verbal IQ, please note hA1c data shown in table are unadjusted; ME-D=HAM-D (E<D, p<.001), CESD (E<D, p<.001).
All participants produced “normal” clock performance. Clocks were deemed normal (Table 1) based on a comparison to previously published work in healthy controls using a well-known scoring system that quantifies the size, shape, and position of the clock face, numbers, and hands on a 0–10 scale (Libon et al., Reference Libon, Malamut, Swenson, Sands and Cloud1996; Libon, Swenson, Barnoski, & Sands, Reference Libon, Swenson, Barnoski and Sands1993). Participants showed nearly identical means and standard deviations to Libon healthy controls across command (our sample=8.73 ± 0.96; Libon sample=8.7 ± 1.1) and copy (our sample=9.18 ± 0.71; Libon sample=9.2 ± 0.8) conditions (Libon et al., Reference Libon, Malamut, Swenson, Sands and Cloud1996; Libon et al., Reference Libon, Swenson, Barnoski and Sands1993).
Demographics and Vascular Risk
Individual 2 (Age)×2 (Affect) ANOVAs were not significant for MMSE or years of education. χ2 analyses revealed an equal distribution of sex (51.1% male, 48.9% female) and race across groups. As expected given group divisions, there was a significant difference between groups on age [F(1,102)=611.35; p<.001, ηp 2=.85], and affect [CESD: F(1,102)=342.21; p<.001, ηp 2=.77]. There was a main effect of Age for pVIQ with older adults scoring higher than younger adults [F(1,102)=7.24; p<.01, ηp 2=.06].
There was a main effect of Age for FSRP scores with older adults showing higher risk of stroke than their younger counterparts [F(1,98)=46.00; p<.001, ηp 2=.32], although there was no significant difference in duration of diabetes. More specific assessment of type 2 diabetes (37 of our 106 participants had type 2 diabetes) revealed equal numbers of diabetics across our 4 groups: each group included 8–10 diabetics equally distributing the impact of this variable across Age and Affect. This was confirmed by a separate series of (non-significant) analyses investigating type 2 diabetes within each group (i.e., younger depressed, younger euthymic, older depressed, and older euthymic) for affect, dCDT, and neuropsychological domain variables of interest. Only after controlling for FSRP and verbal IQ was there a significant difference in hA1c levels (Table 1). Thus, covariates in all dCDT analyses included FSRP and pVIQ and we re-ran all analyses controlling for the additional covariate of hA1C.
dCDT
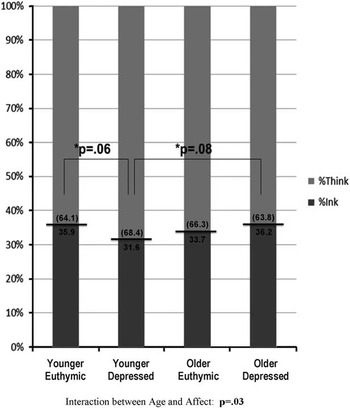
There were no main effects or significant interactions for TTC and total strokes in either the Command or Copy condition. In contrast, analyses of %Ink and %Think revealed a significant interaction of Age and Affect for the Command condition only [%Ink: F(1,96)=4.55, p=.03, ηp 2=.05; %Think: F(1,96)=4.55, p=.03, ηp 2=.05] (Figure 1). Results did not change if we included the clock circle in the %Ink time variable. Follow-up LSD comparisons revealed younger depressed participants tended to spend a relatively larger percentage of their time thinking compared to the younger euthymic (p=.06) or older depressed participants (p=.08) with the younger/older depressed comparison reaching significance (p=.03) when the clock circle was included in %Ink time calculation. As expected, this pattern of results was reversed for %Think during the Command condition such that younger depressed participants tended to spend a smaller percentage of their time drawing compared to the younger euthymic (p=.06) or older depressed (p=.08/p=.03 without/with clock circle) groups. Results did not change if we added the additional covariate of hA1c.
Percent of Ink and Think times across all groups with individual percentages for each variable outlined by group.

Neuropsychological Assessment
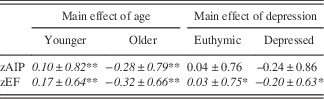
Individual 2 (Age) × 2 (Affect) ANCOVAs controlling for FSRP and pVIQ revealed significant main effects for Age (p-values<.001, ηp 2 ≥.13) and Affect (p-values<.05, ηp 2 ≥.04) within the cognitive domains of EF and AIP (Table 2). There were no significant interactions for either composite score. Across both EF and AIP, however, younger groups performed significantly better than older groups and euthymic groups performed significantly better than depressed groups. Neither the interactions nor main effects of the 2×2 ANCOVAS for LMR, SEM, or gross motor speed measured by TMT-M (Table 1) were significant. Results did not change with the additional covariate of hA1c.
Cognitive performance by Age or Affect

Note. zAIP=z-score for Attention and Information Processing; zEF=z-score for Executive Functioning.
**p<.001.
*p<.05.
Neuropsychological Associates to dCDT Performance
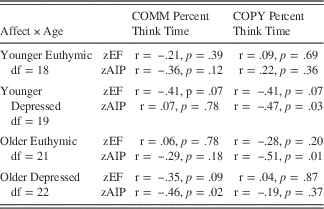
Partial correlations controlling for FSRP and pVIQ examined the relationship between %Ink and %Think times across Command and Copy for EF and AIP given the group differences reported above. Within the younger groups, only individuals with depression showed a significant negative correlation between AIP and %Think during the Copy condition r(19)=−.47, p=.03, 95% confidence interval (CI) [−.74, −.07]. Similarly, the older euthymic group had a significant negative correlation between AIP and %Think during the Copy condition, r(21)=−.51, p=.01, 95% CI [−.75, −.14]. In contrast, the older depressed group had a significant negative association between AIP and %Think during the Command condition only, r(22)=−.46, p=.02, 95% CI [−.72, −.09] (see Table 3 for details). For completeness, we ran a similar set of correlations for SEM, LMR, and TMT-M; none of the results for SEM and LMR were significant. Results did not change if we added hA1c as an additional covariate. TMT-M associated with Copy condition %Ink only and only for young depressed, r(20)=−.52, p=.01, 95% CI [−.76, −.15]; however, this did not remain significant once hA1c was added as an additional covariate.
Correlations between %Think under Command and Copy conditions and cognitive performance

Note. COMM=Command condition; COPY=Copy condition; df=degrees of freedom; zEF=composite z-score for Executive Functioning; zAIP=composite z-score for Attention and Information Processing.
DISCUSSION
This study dissociated aspects of psychomotor slowing in depression using an innovative digital CDT in younger and older adults. Unlike previous studies (Caligiuri et al., Reference Caligiuri, Gentili, Eberson, Kelsoe, Rapaport and Gillin2003; Pier et al., Reference Pier, Hulstijn and Sabbe2004b, Reference Pier, Hulstijn and Sabbe2004c; Sabbe et al., Reference Sabbe, Hulstijn, van Hoof, Tuynman-Qua and Zitman1999; Tucha et al., Reference Tucha, Aschenbrenner, Eichhammer, Putzhammer, Sartor, Klein and Lange2002), we investigated performance across distinct age bands of unmedicated individuals to examine speed in MDD without the confounding effects of medication-related slowing. Furthermore, we assessed different aspects of psychomotor speed within the same task and capitalized on increasing levels of difficulty inherent in the task (i.e., internal/Command versus external/Copy conditions), eliminating confounds due to different test measures. Thus, by applying novel technology to the widely used CDT, the dCDT provided precise and standardized measurement of the duration of drawing (%Ink) and non-drawing (%Think) activities to differentiate between motor and cognitive aspects of psychomotor slowing in aging and depression.
Our results suggested Ink/Think alterations within the context of equivalent overall performance by age and depression. There were no differences in dCDT TTC or total number of strokes between groups; nor were there differences in gross motor speed (TMT-M). Despite these non-significant results, the younger depressed group spent a greater proportion of time thinking (hence a smaller proportion of time drawing) than the younger euthymic or older depressed groups. Furthermore, this significant interaction was seen only during the Command condition when internal cuing was high. We suggest that the Command condition required greater cognitive resources due to a reliance on internal cues for response selection (Cosentino et al., Reference Cosentino, Jefferson, Chute, Kaplan and Libon2004; Hoffstaedter et al., Reference Hoffstaedter, Sarlon, Grefkes and Eickhoff2012). The higher demand for cognitive resources appeared to have slowed %Think only in younger adults with depression. In contrast, no significant differences were seen during the Copy condition when internal cuing was low and fewer cognitive resources were required given the presences of an external cue. This is consistent with other studies that showed external cuing facilitated performance in depressed individuals who were relatively younger in age (Hoffstaedter et al., Reference Hoffstaedter, Sarlon, Grefkes and Eickhoff2012).
Between-group analyses supported the increased cognitive demands of internal cuing in the younger depressed group. Additionally, correlation analysis suggested that %Think may be associated with cognitive demands that differ based on age and affect. Among older adults with depression, as AIP scores increased (suggesting greater availability of cognitive resources in this domain), the proportion of time spent thinking during the internal/Command condition decreased. In contrast, younger adults with depression and older euthymics showed increased AIP with decreased proportion of time spent thinking only in the external/Copy condition. While the increased focus on the model during Copy may have eliminated between-group differences in %Think time seen during the Command condition in younger adults with depression, it revealed a pattern of increased AIP associated with decreased %Think that was comparable to older adults without depression. Perhaps the presence of the model subtly stressed the importance of accuracy for these groups and led to heightened use of AIP resources for completion under an otherwise less demanding “externally mediated” Copy condition. Another possibility, at least for the younger depressed group, may be related to the impact of excessive rumination – often seen in depression and linked to attentional dysfunction (Koster, De Lissnyder, Derakshan, & De Raedt, Reference Koster, De Lissnyder, Derakshan and De Raedt2011); perhaps increased attention to the model decreased rumination in this group and hence decreased %Think as well. More directed studies are needed to explore these possibilities.
Although we hypothesized that deficits would be greatest in the older depressed cohort, this was not the case. Similarities in cognitive correlates existed across younger depressed and older euthymic groups, while only the older depressed group showed a pattern of association between Command condition %Think and AIP. This may be due in part to differences in the manifestation of depressive symptomatology known to exist at different ages (Charlton, Lamar, Ajilore, & Kumar, Reference Charlton, Lamar, Ajilore and Kumar2013; Gallo & Rabins, Reference Gallo and Rabins1999). Depression in younger adults lends itself to the stereotypic symptoms of sadness and slowed initiation of activities, the latter of which may also occur during normal aging. In contrast, depression in older adults, particularly in our sample cohort, is more reflective of physical symptoms (Charlton et al., Reference Charlton, Lamar, Ajilore and Kumar2013), which may lead to widespread slowing across cognitive and motor aspects. In fact, older adults with depression spent almost equivalent time thinking and drawing in contrast to other groups. The need for greater AIP during %Think under the Command condition may reflect internal cuing in depression that may be more specific to older adults than that seen in previous studies of younger medicated inpatients with depression (Hoffstaedter et al., Reference Hoffstaedter, Sarlon, Grefkes and Eickhoff2012).
Between-group comparisons of cognitive performance are in keeping with the literature (Butters et al., Reference Butters, Whyte, Nebes, Begley, Dew, Mulsant and Becker2004; Grant, Thase, & Sweeney, Reference Grant, Thase and Sweeney2001; Jungwirth et al., Reference Jungwirth, Zehetmayer, Hinterberger, Kudrnovsky-Moser, Weissgram, Tragl and Fischer2011; Nebes et al., Reference Nebes, Butters, Mulsant, Pollock, Zmuda, Houck and Reynolds2000; Pimontel et al., Reference Pimontel, Culang-Reinlieb, Morimoto and Sneed2012; Stordal et al., Reference Stordal, Lundervold, Egeland, Mykletun, Asbjørnsen, Landrø and Lund2004) and show age negatively impacts cognition, as does depression. Both older groups, regardless of depression, performed worse than their younger counterparts on EF and AIP. Similarly, there was a main effect of depression on these scores that favored the euthymics over the depressed groups. There was not, however, a significant interaction, which suggests that older and younger euthymics were not different on cognitive measures per se, nor were depressed older adults overly burdened by possible vascular dementia (VaD) when compared to their older euthymic counterparts. Thus, while the possibility of vascular cognitive impairment (VCI) or even VaD cannot be completely ruled out, the fact that older adults with depression were not disproportionately “slowed” in %Ink versus %Think by increasing cognitive demands (internal cuing) provides evidence against VCI/VaD claims and for widespread slowing secondary to MDD as noted above. Additionally, our results suggested similarities between cognition and dCDT performance in younger depressed and older euthymic groups; further evidence against VCI/VaD in our older adults.
Study results should be considered within the context of our sample: community-dwelling participants responding to advertisements about untreated depression. It could be suggested that their depressive symptoms were not severe enough to seek treatment; however, participants met DSM criteria for MDD. Furthermore, HAM-D scores suggested a mild-moderate form of depression; however, this still resulted in relatively intact overall clock performance. We would argue that this makes detecting differences in the subtle metrics of %Think and %Ink even more important, given that this potentially milder form of depression may be more representative of the larger community (Little et al., Reference Little, Reynolds, Dew, Frank, Begley, Miller and Kupfer1998; Pratt & Brody, Reference Pratt and Brody2008). Thus, the dCDT may be clinically useful in identifying individuals in this vulnerable population, given that it capitalizes on both internal and external resource allocation to disambiguate aspects of psychomotor slowing. Furthermore, while there are other ways to distinguish depression via clock drawing error analyses (Bodner et al., Reference Bodner, Delazer, Kemmler, Gurka, Marksteiner and Fleischhacker2004; Royall et al., Reference Royall, Cordes and Polk1998), these methods are labor intensive with scoring procedures that are potentially subjective compared to our digitized, semi-automated technique sensitive to reaction times. Thus, the dCDT provides an efficient and standardized way to differentiate the impact of depression on aspects of psychomotor speed in an otherwise highly functioning cohort.
While we attempted to disentangle behavior by dividing TTC into time spent drawing (%Ink) and time spent not drawing (%Think), our metrics are still not “pure” measures of one construct versus the other—some “thinking” undoubtedly occurred during “inking”. The pattern of %Think and %Ink results did, however, differentiate performance in depression at different age ranges and associated with distinct aspects of cognition. This study, and the directions suggested for future research, answered calls in the literature for a simple way to measure and understand the psychomotor aspects of depression (Buyukdura, McClintock, & Croarkin, Reference Buyukdura, McClintock and Croarkin2011). As such, continued research is needed exploring dCDT variables with distinct metrics of gross (e.g., finger tapping) and fine (e.g., grooved pegboard) motor functioning, as well as more detailed analysis of cognitive (e.g., impulsivity and planning) and depressive symptoms. Incorporating the dCDT in this work may allow for new constructs like %Ink and %Think to emerge and inform our conceptualizations of a variety of normal and pathological processes in addition to aging and depression.
ACKNOWLEDGMENTS
This work was supported by National Institute of Mental Health Grants (A.K., R01MH073989, 7R01MH063764) and (O.A., K23MH081175-01A2). We thank the Lahey Clinic, MIT, and the ClockSketch Consortium for the development of the Digital Clock Drawing Test, as well as their helpful comments and manuscript preparation. The authors have nothing to disclose. Dr. Libon has received support from the Bayer Corporation.