
Introduction
The study of two-dimensional (2D) and layered materials has expanded beyond graphene and the relatively well-researched MoS2 to include many more transition metal dichalcogenides (TMDs). In the current crop of layered materials, HfSe2 is enjoying renewed interest.[Reference Yin, Xu, Wen, Wang, Huang, Wang, Shifa, Cheng, Ma and He1, Reference Yue, Barton, Zhu, Azcatl, Pena, Wang, Peng, Lu, Cheng, Addou, McDonnell, Colombo, Hsu, Kim, Kim, Wallace and Hinkle2] Studies on the structure and electronic behavior of HfSe2 go back decades,[Reference Greenaway and Nitsche3–Reference Wieting and Verble5] and ongoing studies are buoyed both by improvements in synthesis techniques and by some exciting results from both theoretical[Reference Rasmussen and Thygesen6, Reference Zhang, Huang, Zhang and Li7] and experimental[Reference Najmaei, Neupane, Nichols, Burke, Mazzoni, Chin, Rhodes, Balicas, Franklin and Dubey8] work. In particular, the predicted HfSe2 room temperature mobility is about 100 times the prediction for MoS2.[Reference Zhang, Huang, Zhang and Li7] HfS2, a material analogous to HfSe2, was recently shown[Reference Najmaei, Neupane, Nichols, Burke, Mazzoni, Chin, Rhodes, Balicas, Franklin and Dubey8] to exhibit interesting inter-layer transport properties which may lead to new applications. HfSe2 is one of the most reactive layered TMDs, readily forming Se-rich blisters which has been shown to negatively affect performance. By comparison, other layered TMDs such as HfS2,[Reference Mirabelli, McGeough, Schmidt, McCarthy, Monaghan, Povey, McCarthy, Gity, Nagle, Hughes, Cafolla, Hurley and Duffy9] MoS2[Reference George, Mutlu, Ionescu, Wu, Jeong, Bay, Chai, Mkhoyan, Ozkan and Ozkan10] and SnS2[Reference Mutlu, Wu, Wickramaratne, Shahrezaei, Chueh, Temiz, Patalano, Ozkan, Lake, Mkhoyan and Ozkan11] are much more stable. Despite recent seminal work on the Raman characteristics of polymorphic group six-layered TMDs,[Reference Zhang, Qiao, Shi, Wu, Jiang and Tan12] to our knowledge a systematic Raman study of the 2H and 1T polytypes of any group 4 TMD has not yet been conducted; thus, the differences between their spectra and any related properties remain unexamined in the bulk, few-layer and monolayer regimes.
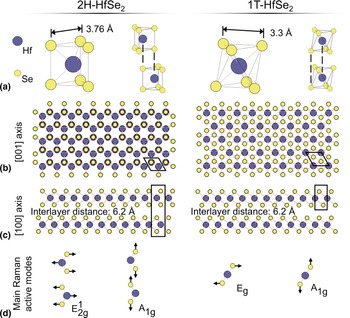
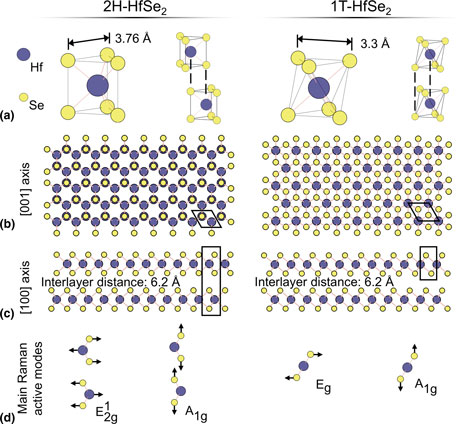
2H-MX 2 is hexagonal with trigonal prismatic coordination and two layers per unit cell [Fig. 1(a)]. The 2H polytype can be further subdivided into 2Ha, 2Hb and 2Hc polytypes, depending on the stacking order. 2Hc is the most common; 2Ha has been observed only under high-pressure conditions and 2Hb has not yet been observed.[Reference Samadi, Sarikhani, Zirak, Zhang, Zhang and Moshfegh13] Hereafter, the use of “2H” will refer specifically to the 2Hc polytype. Each layer of 2H-MX 2 is made up of a tri-layer (TL) of atomic monolayers. Metal atoms in adjacent TLs sit directly above or below chalcogen atoms such that the unit cell contains two TLs [Figs. 1(b) and 1(c)]. In the octahedrally coordinated 1T polytype [Fig. 1(a)], corresponding atoms in adjacent layers sit directly above each other, and the unit cell is a single layer [Figs. 1(b) and 1(c)]. Within a TL, atoms are covalently bonded, and TLs are held together by van der Waals forces. The bulk 2H polytype corresponds to the  $D_{6h}^4 $ (P63/mmc) space group. Even and odd numbers of layers in few-layer 2H-MX 2 correspond to
 $D_{3d}^3 $ and
 $D_{3h}^1 $, respectively. 1T-MX 2 belongs to the space group
 $D_{3d}^3 $ (P
 $\bar 3\,\hbox{mL}$) in both bulk and few-layer forms and its space group symmetry is independent of the number of layers. These symmetries result in the following irreducible representations at the Brillouin zone center[Reference Samadi, Sarikhani, Zirak, Zhang, Zhang and Moshfegh13]:
 $$\Gamma _{{\rm 2H}} = A_{{\rm 1g}}^{} + E_{{\rm 1g}}^{} {\rm + 2}E_{{\rm 2g}}^{} + A_{{\rm 2u}}^{} {\rm + 2}B_{{\rm 2g}}^{} + B_{{\rm 1u}}^{} + E_{{\rm 1u}}^{} + E_{{\rm 2u}},$$
and
 $$\Gamma _{{\rm 1T}} = A_{{\rm 1g}}^{} + E_{\rm g}^{} {\rm + 2}A_{{\rm 2u}}^{} {\rm + 2}E_{\rm u}.$$
Structure and Raman active vibrational modes of HfSe2. (a) Coordination of metal atoms and lattice parameters in 2H (left) and 1T (right) polytypes. (b) [001] axis and (c) [100] axis views showing the stacking order of the polytypes. (d) Characteristic Raman active modes.
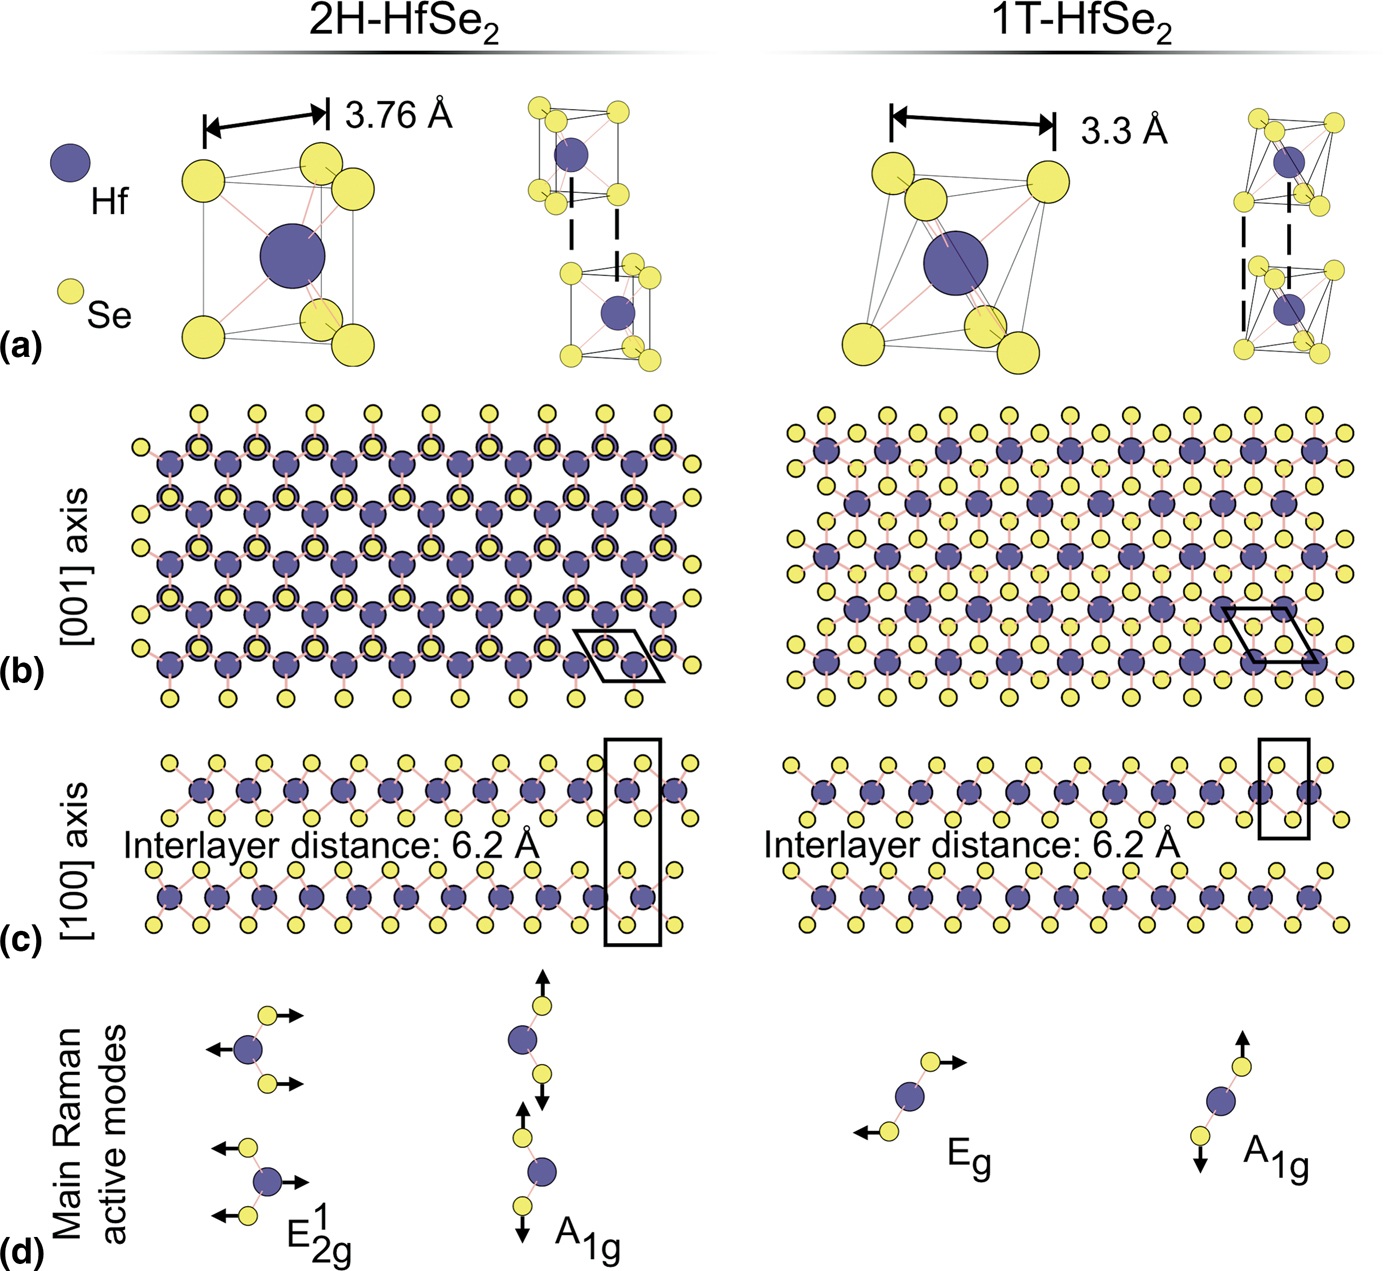
 $A_{{\rm 1g}}^{} $ and E g modes are Raman active for 1T-MX 2 [Fig. 1(d)] whereas 2H-MX 2 has four Raman active modes:
 $A_{{\rm 1g}}^{} $, 2
 $E_{{\rm 2g}}^{} $, and
 $E_{{\rm 1g}}^{} $. In 2H-MX 2,
 $A_{{\rm 1g}}^{} $ and
 $E_{{\rm 2g}}^1 $ are the main Raman modes [Fig. 1(d)] used for identification because the selection rules operating in the common 180° backscattering Raman setup forbid the
 $E_{{\rm 1g}}^{} $ mode, and strong Rayleigh scattering at the laser frequency wash out the
 $E_{{\rm 2g}}^2 $ mode without proper filters in place.[Reference Samadi, Sarikhani, Zirak, Zhang, Zhang and Moshfegh13] For a more detailed discussion of the structures and polytypes of TMDs see Refs. Reference Greenaway and Nitsche3,Reference Wieting and Verble5,Reference Zhang, Qiao, Shi, Wu, Jiang and Tan12,Reference Samadi, Sarikhani, Zirak, Zhang, Zhang and Moshfegh13 and especially the careful group theory work by Ribeiro-Soares et al.[Reference Ribeiro-Soares, Almeida, Barros, Araujo, Dresselhaus, Cancado and Jorio14]
Kim et al. have studied the semiconductor-to-metal transition between the 2H and 1T polytypes of MoS2.[Reference Kim, Kim, Zhao, Kim, Lee, Jin, Choi, Moon, Bae, Lee and Lim15] They showed that pristine 2H-MoS2 Raman spectra exhibit the characteristic A 1g and  $E_{{\rm 2g}}^1 $ peaks. Upon lithium intercalation and deintercalation, regions of 2H-MoS2 transformed to 1T-MoS2. Raman spectra of 1T-MoS2 showed both the absence of the characteristic A 1g peak, and the appearance of E g and J peaks. Ataca et al. performed DFT modeling on select TMDs to search for other stable polymorphic compounds.[Reference Ataca, Sahin and Ciraci16] Their analysis of TiTe2, the only group 4 TMD in the study, indicated that it would be stable in both the 1T and 2H polytypes and would have metallic properties. Most previous studies of HfSe2 were of the 1T polytype. DFT calculations suggest 1T-HfSe2 has a lower energy of formation than 2H-HfSe2,[Reference Rasmussen and Thygesen6] making it the preferred configuration during fabrication. Further DFT modeling[Reference Gong, Zhang, Wang, Colombo, Wallace and Cho17] explains this preference as group 4 transition metals failing to fill the
 $d_{z^2}$ subband that splits off at lower energy in the trigonal prismatic configuration. 1T-HfSe2 is an indirect band gap semiconductor with a measured band gap of 1.13 eV.[Reference Yin, Xu, Wen, Wang, Huang, Wang, Shifa, Cheng, Ma and He1, Reference Yue, Barton, Zhu, Azcatl, Pena, Wang, Peng, Lu, Cheng, Addou, McDonnell, Colombo, Hsu, Kim, Kim, Wallace and Hinkle2] Computational work by Zhang et al.[Reference Zhang, Huang, Zhang and Li7] has predicted the room temperature mobility of HfSe2 to be above 3500 cm2/(V/ s). This value is an order of magnitude greater than the study's prediction for MoS2, which is currently one of the most-studied layered materials for devices. They base their prediction on the Takagi model of electron mobility which suggests that in HfSe2, compared to MoS2, the low electron effective mass in the K–M direction and the relatively weak electron–phonon interaction play significant roles in high mobility. Single crystals of 2H-HfSe2 can be grown using flux zone growth methods.[18] 2H-HfSe2 has an indirect band gap of 1.16 eV.[18] The interlayer distance for 2H-HfSe2 is about 6.2 Å, and the in-plane lattice parameter, corresponding to the d-spacing of {100} planes, is about 3.76 Å.[18] The interlayer distance and in-plane lattice parameter of 1T-HfSe2 are 6.2 and 3.3 Å, respectively.[Reference Yin, Xu, Wen, Wang, Huang, Wang, Shifa, Cheng, Ma and He1, Reference Yue, Barton, Zhu, Azcatl, Pena, Wang, Peng, Lu, Cheng, Addou, McDonnell, Colombo, Hsu, Kim, Kim, Wallace and Hinkle2]
In this study, we report atomic force microscopy (AFM), Raman and transmission electron microscopy (TEM) analyses confirming previous findings that HfSe2 forms Se-rich surface features upon exposure to air. We also performed convergent beam electron diffraction analysis and observed that 2H-HfSe2 undergoes a spontaneous phase change to 1T-HfSe2.
Methods
Materials synthesis
Four-inch silicon wafers with a 300-nm top layer of silicon dioxide were cut into roughly 10×10-mm2 pieces and cleaned with acetone and isopropyl alcohol to remove any contaminants. HfSe2 and HfS2 crystals were purchased from 2D Semiconductors. Flakes of each crystal were exfoliated from the bulk and deposited onto the SiO2/Si substrates using the Scotch Tape method. Exfoliation was typically carried out under ambient atmosphere. In one experiment, samples of HfSe2 were exfoliated inside a glove box, in argon atmosphere. When not in use, samples were kept in desiccators under low vacuum.
For TEM experiments, samples were once again exfoliated with Scotch Tape, then deposited onto 3-mm copper grids with holey carbon mesh. Rather than the tape being peeled away by hand, the tape and grids were washed first with acetone and then with isopropanol. The acetone caused the tape to warp and self-separate from the grid as the adhesive dissolved. The isopropanol helped to further remove contaminants and residues.
Characterization
Thick and thin regions of the samples were identified on optical micrographs by inspection.[Reference Li, Wu, Huang, Lu, Yang, Lu, Xiong and Zhang19] Raman spectra were gathered with a Horiba LabRAM spectroscope while varying several experimental parameters: sample thickness, laser power and wavelength, exfoliation conditions and time of air exposure. HfSe2 was extremely sensitive to laser exposure (Fig. S1 in Supplementary Information) so spectra were gathered using a low-energy, low-power 785-nm laser at no more than 3 mW to avoid burning the sample. HfS2 is less sensitive to the laser, and a 532-nm laser at 10–20 mW was used. Previous work by Yumnam et al.[Reference Yumnam, Pandey and Singh20] suggests this difference in sensitivity may be due to the lower thermal conductivity of HfSe2, resulting in an inability to dissipate the heat generated by the laser quickly enough. Both to quantitatively compare the thicknesses of the analyzed regions and to gather data on the surface morphology, atomic force microscopy (AFM) was performed with an AIST-NT AFM fitted with Bruker NCHV-A silicon AFM tips which had resonant frequencies of around 310 kHz. TEM micrographs and diffraction patterns were gathered on a FEI Titan X-FEG. In particular, selected area electron diffraction (SAED) and convergent-beam electron diffraction (CBED) patterns were gathered to determine the polytype of HfSe2.
Results and discussion
As detailed in the methods section, we mechanically exfoliated samples of HfSe2 onto SiO2/Si wafers. Using an optical microscope, we identified flakes by the differences in color and contrast, which has been used reliably with MoS2 on 300 nm SiO2/Si.[Reference Li, Wu, Huang, Lu, Yang, Lu, Xiong and Zhang19] Exfoliated flakes ranged in area from tens to hundreds of μm2, with lateral sizes of a few μm to tens of μm (Fig. S1 in Supplementary Information).
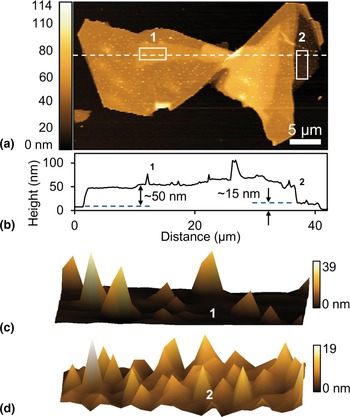
AFM was performed to characterize the thickness and surface of the flakes. On one large flake, we observed regions of varying thickness, between 10 and 200 nm [Figs. 2(a) and 2(b)]. AFM images of several HfSe2 flakes showed spire-like features over the entire flake surface [Figs. 2(c) and 2(d)]. Other flakes exfoliated under Ar atmosphere in a glove box did not show the spire-like features.
AFM of HfSe2 flake exfoliated in air. (a) AFM height image and (b) corresponding height profile of a HfSe2 flake. (c), (d) 3D AFM height images of the regions 1 and 2, respectively, as demarcated by the rectangle in (a).

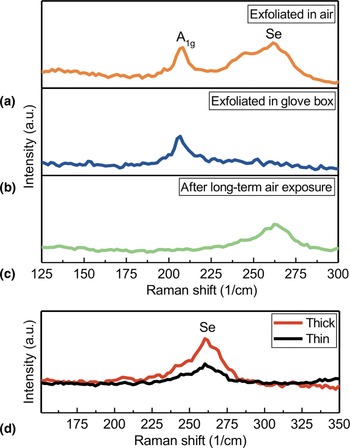
Raman characterization was carried out on several samples, under ambient conditions. In addition to the strong characteristic A 1g peak at 199 cm−1, HfSe2 flakes exfoliated in air showed a broad peak around 260 cm−1 [Fig. 3(a)]. At room temperature, amorphous selenium has a Raman peak at that frequency.[Reference Nagata, Ishibashi and Miyamoto21] Additionally, Mirabelli et al. previously investigated the air stability of HfSe2[Reference Mirabelli, McGeough, Schmidt, McCarthy, Monaghan, Povey, McCarthy, Gity, Nagle, Hughes, Cafolla, Hurley and Duffy9] and found similar surface features which they characterized as Se-rich blisters. Raman spectra taken immediately after exfoliation in a glove box did not have the broad peak at 260 cm−1 [Fig. 3(b)]. After long-term air exposure, however, Raman spectra of all HfSe2 flakes had the amorphous Se peak and no A 1g peak [Fig. 3(c)].
Raman study of air stability of HfSe2. Raman spectra of the HfSe2 flakes taken immediately after exfoliation in (a) air and (b) glove box. (c) Raman spectra of HfSe2 after long-term exposure to air. (d) Raman spectra comparison of the thin and thick regions of a HfSe2 flake after long-term air exposure.

AFM of HfS2 flakes (Fig. S2 in Supplementary Information) did not display such surface features; we observed HfS2 to be stable in air, which is also consistent with the findings of Mirabelli et al.[Reference Mirabelli, McGeough, Schmidt, McCarthy, Monaghan, Povey, McCarthy, Gity, Nagle, Hughes, Cafolla, Hurley and Duffy9] One explanation for this difference is the lower electronegativity of Se compared to S, making HfS2 less susceptible to oxidation.[Reference Mirabelli, McGeough, Schmidt, McCarthy, Monaghan, Povey, McCarthy, Gity, Nagle, Hughes, Cafolla, Hurley and Duffy9] A comparison of the surface morphologies of thick [labeled 1 in Fig. 2(c), about 50 nm] and thin [labeled 2 in Fig. 2(d), about 15 nm] regions showed a difference in blister density. AFM data revealed maximum height and root-mean-squared (RMS) roughness differences between the two regions. The thicker region 1 had a maximum blister height of about 39 nm, compared to the maximum 19-nm height of region 2. Their respective RMS roughness values were 4.32 and 2.79 nm, which agrees with previously reported[Reference Mirabelli, McGeough, Schmidt, McCarthy, Monaghan, Povey, McCarthy, Gity, Nagle, Hughes, Cafolla, Hurley and Duffy9] values (Table S1 in Supplementary Information). The Se Raman peaks of thick and thin regions for a single HfSe2 flake were also compared [Fig. 3(d)]. The thicker region had a stronger peak, indicating more Se on the surface. More Se would correlate with having more HfSe2 available during the formation of the blisters.
TEM analysis was carried out to confirm the polytype of exfoliated HfSe2 flakes [Fig. 4(a)]. TEM images of the flake surface revealed amorphousness with many small, misaligned regions, in contrast with the single-crystalline nature of the as-received bulk sample [Fig. 4(b)]. The observed amorphousness is consistent with the presence of amorphous Se on the surface of the flake. SAED [Fig. 4(c)] confirmed that the crystal structure was hexagonal but could not differentiate between trigonal prismatic and octahedral coordination of the 2H and 1T polytypes. CBED analysis [Fig. 4(d)] found that the out-of-plane periodicity of the material is 6.2 Å, which is consistent with the 1T polytype since 2H-HfSe2 has two layers per unit cell. XRD performed by the supplier[18] indicate the as-received samples of HfSe2 are of the 2H polytype. The 2H phase as metastable agrees with previous work[Reference Rasmussen and Thygesen6, Reference Mirabelli, McGeough, Schmidt, McCarthy, Monaghan, Povey, McCarthy, Gity, Nagle, Hughes, Cafolla, Hurley and Duffy9] showing that HfSe2 prefers the 1T phase over the 2H phase due to its slightly lower calculated energy of formation. Phase transitions have also been reported to result from strain[Reference Song, Keum, Cho, Perello, Kim and Lee22] and lithium intercalation and deintercalation.[Reference Kim, Kim, Zhao, Kim, Lee, Jin, Choi, Moon, Bae, Lee and Lim15] If the surface reaction and formation of blisters induce strain in the extant HfSe2 crystal, the strain in turn may provide the driving force for the phase change; that is, exposure to air, which causes surface reactions that form the Se-rich blisters, may be the ultimate cause of the transformation. These possibilities suggest methods for phase engineering of polymorphic HfSe2 devices.
TEM and diffraction analysis. (a) TEM image of HfSe2 flake. (b) TEM image of HfSe2 surface showing amorphousness. (c) SAED pattern showing hexagonal crystal structure. (d) CBED analysis, consistent with 1T polytype of HfSe2.

Conclusion
We have reported on the air stability of HfSe2. HfSe2 was found to grow spire-like Se-rich surface features upon exposure to air, in agreement with previous work. The morphology of the Se-rich features appeared to depend on the thickness of the flake: approximately 15 nm-thick flakes showed more numerous, 20 nm-tall spikes, whereas approximately 50 nm-thick flakes showed fewer but taller spikes, which were about 40 nm in height. Thicker regions have more HfSe2 present, thus more Se is available for the reaction, allowing growth and coalescence of the spikes. Thinner regions deplete the available HfSe2 sooner, and the reaction stops before the spikes can grow tall. We were able to confirm the presence of Se using Raman spectra. We observed a peak at 199 cm−1, characteristic of HfSe2, and a peak at approximately 260 cm−1, characteristic of amorphous Se. We found one possible method for suppressing the growth of Se-rich spikes on exfoliated HfSe2. By exfoliating HfSe2 in a glove box under Ar, the Se peak disappeared, which we attribute to a suppression of oxidation whereby the formation of blisters is prevented. TEM images showed amorphous structures in the flake, which is consistent with the spontaneous growth of amorphous Se surface features. CBED analysis showed the presence of 1T-HfSe2; the as-received sample was 2H-HfSe2, indicating that a phase transformation took place. We suggest that the 2H phase of HfSe2, due to its higher energy of formation, is metastable, and thus transforms to the 1T phase upon exposure to air. Another possibility is that the formation of Se-rich spikes on the surface of the flakes induces strain in the crystal, and the strain drives the phase change.
Supplementary material
The supplementary material for this article can be found at https://doi.org/10.1557/mrc.2018.185.
Acknowledgments
This work was made possible by support from C-SPIN, a funded center of STARnet, through a SRC program sponsored by MARCO and DARPA. Raman measurements were performed in the ACIF at the UC Riverside. TEM analysis was performed in the CFAMM at the UC Riverside. The authors thank Dr. Krassimir N. Bozhilov for his assistance with TEM analysis.