





Maternal obesity and excessive gestational weight gain (GWG) due to an increased fat accumulation may result in serious health risks for both mother and child, including various pregnancy complications such as gestational diabetes, preterm birth, child mortality and adverse long-term health outcomes such as metabolic syndrome, obesity across generations and neurodevelopmental disorders later in life(Reference Champion and Harper1–Reference Sanchez, Barry and Sabhlok5). Moreover, pregnant women with overweight or obesity experience more challenges adhering to a healthy diet(Reference Dubois, Diasparra and Bédard6–Reference Muhli, Koivuniemi and Laitinen8), often consuming an energy-rich diet with poor-quality macronutrients(Reference Charnley, Newson and Weeks9), as well as more depressive and anxiety symptoms(Reference Griffiths, Shannon and Brown10–Reference Molyneaux, Poston and Khondoker12). One critical explanatory factor linking weight gain to both nutrition and psychological symptoms appears to be eating behaviour(Reference Jaakkola, Hakala and Isolauri13–Reference van Strien, Konttinen and Homberg15), but there are only a few publications describing the psychological dimensions of eating behaviour with a focus on pregnant women.
Eating behaviour is a broad multidimensional concept of practices related to food and eating, including the psychological dimensions underlying the motivation to eat(Reference Bellisle16). The 18-item Three-Factor Eating Questionnaire (TFEQ-R18) is a useful tool for evaluating three dimensions of eating behaviour: cognitive restraint (CR), uncontrolled eating (UE) and emotional eating (EE)(Reference Karlsson, Persson and Sjöström17). There is evidence that by combining the information conveyed in TFEQ-R18, one can obtain a more holistic perspective to understanding eating behaviour. Indeed, Pentikäinen et al.(Reference Pentikäinen, Arvola and Karhunen18) investigated the interactive occurrence of CR, UE and EE and distinguished four similar segments that differed in relation to well-being, coping strategies and food choices in both Finnish and German general populations. While this holistic approach has been utilised in identifying specific eating behaviour profiles(Reference Pentikäinen, Arvola and Karhunen18), the technique has not been applied in pregnant women.
According to previous studies, during pregnancy, a higher restrained eating as measured by the Dutch Eating Behaviour Questionnaire (DEBQ) has been associated with a healthier diet, such as lower intakes of fat and added sugar(Reference Nansel, Lipsky and Faith19,Reference Shriver, Eagleton and Hosseinzadeh20) . However, no connections have been identified between emotional eating and dietary intake in pregnant women(Reference Shriver, Eagleton and Hosseinzadeh20). While there are a few studies which have linked an unhealthier dietary intake with UE as measured by the TFEQ-R18 at preconception(Reference Loh, Loy and Appannah21) and at postpartum(Reference Jaakkola, Hakala and Isolauri13), this connection has not been investigated over the course of pregnancy. In addition, less attention has been paid to examining changes in eating behaviour and their relation to dietary intake throughout pregnancy.
There are a few publications describing links between excessive GWG and eating behaviour dimensions which applied other assessment tools, such as the Eating Disorder Examination measuring loss of control(Reference Levine, Tavernier and Conlon22) and binge eating(Reference Nunes, Pinheiro and Camey23) and the DEBQ measuring emotional eating(Reference Blau, Orloff and Flammer24). Specifically, higher levels of emotional eating have been associated with a higher pre-pregnancy BMI(Reference Hajian and Fathnezhad-Kazemi25). In relation to restrained eating, the associations have remained unclear since the linkage to excessive GWG has not been found using TFEQ(Reference Tang, Andres and West26) or DEBQ(Reference van der Wijden, Steinbach and van der Ploeg27), which are both deemed acceptable measures of dietary restraint regardless of the weight status(Reference Bohrer, Forbush and Hunt28). However, some investigators have linked restrained eating to a higher absolute GWG using TFEQ(Reference Slane and Levine29) and other measurements(Reference Heery, Wall and Kelleher30,Reference Sparks, Redman and Drews31) . Nevertheless, previous studies have overlooked adiposity, measured by fat mass and body fat percentage, which could provide a more precise insight about obesity.
Women with overweight or obesity may experience more depressive and anxiety symptoms and display more unfavourable psychological dimensions of eating behaviour than women with normal weight. These connections have been detected particularly with UE and EE measured by TFEQ-R18(Reference Dakanalis, Mentzelou and Papadopoulou32,Reference Konttinen, Männistö and Sarlio-Lähteenkorva33) and emotional eating measured by DEBQ(Reference van Strien, Konttinen and Homberg15), less consistently in relation to CR(Reference Czepczor-Bernat, Razmus and Mikulska34,Reference Witaszek, Babicki and Brytek-Matera35) and anxiety in non-pregnant women(Reference Cifuentes, Campos and Silgado36–Reference Schulz and Laessle38). Researchers have identified a group of pregnant women who are suffering from poor psychological well-being; they have detected associations of increased depressive symptoms with emotional eating(Reference Carandang, Epel and Radin39) and being unable to control eating(Reference Kolko, Emery and Marcus40). While emotional eating has been connected to postpartum anxiety symptoms(Reference Emerson, Hurley and Caulfield41), it is not known whether these links are already present during pregnancy. Unfortunately, these symptoms have been rarely examined in eating behaviour studies in pregnant women despite their potential role in mediating the associations between the psychological dimensions of eating behaviour, diet and weight gain during pregnancy.
As pregnant women with overweight or obesity are at a heightened risk of harmful effects which will impact on the health of both mother and child, a deeper understanding of the psychological dimensions of eating behaviour and its connections to diet, body weight and psychological symptoms during pregnancy could benefit this specific risk group. This study aimed to determine if there were distinctive eating behaviour profiles which could be identified among pregnant women with overweight or obesity and subsequently to utilise the profiles to elucidate the eating behaviour change from early to late pregnancy as well as the associations of eating behaviour with (1) dietary patterns, diet quality and dietary intake of energy-yielding nutrients, (2) pre-pregnancy BMI, GWG and body composition and (3) depressive and anxiety symptoms during early and late pregnancy.
Methods
Study design and participants
Pregnant women with overweight or obesity (n 439) were recruited into a mother-child dietary clinical study at Turku University Hospital and University of Turku in Finland between 2013 and 2017 (ClinicalTrials.gov, NCT01922791). The inclusion criteria were pre-pregnancy BMI ≥ 25 kg/m2, gestational weeks less than eighteen and the absence of chronic diseases except for asthma and allergies. The study followed the guidelines of the Declaration of Helsinki, and an ethical review statement was obtained from the Ethics Committee of the Hospital District of Southwest Finland. Women provided written informed consent before participating. Further study details have been described previously(Reference Pellonperä, Mokkala and Houttu42).
Descriptive characteristics (e.g. age, education and smoking behaviour) were collected using questionnaires and interviews. Eating behaviour dimensions, dietary intake, body weight and composition and depressive and anxiety symptoms were measured in early (mean 13·8, sd 2·15 gestational weeks) and late pregnancy (mean 35·2, sd 0·97 gestational weeks). Participants were excluded due to familial hypercholesterolaemia (n 1) and failure to complete the TFEQ in early pregnancy (n 4). An additional fifty-nine women were lost at follow-up. All data were pseudonymised before the analyses and stored in a password-protected folder on the secure server of the University of Turku.
Psychological dimensions of eating behaviour
Eating behaviour was assessed using the dimensions (CR, UE, EE) of the TFEQ-R18 translated into Finnish(Reference Karlsson, Persson and Sjöström17). The TFEQ-R18 contains seventeen items on a 1–4 response scale and one item on a 1–8 response scale. CR (6 items) measures conscious restraint of food intake in order to regulate weight, UE (nine items) assesses excessive appetite and a loss of control with respect to eating, and finally EE (three items) examines the tendency to overeat in the presence of dysphoric emotions, including feeling anxious, blue or lonely(Reference Karlsson, Persson and Sjöström17). In the UE dimension, item one was modified by replacing ‘a juicy piece of meat’ with ‘delicious food’ so that it would also apply to those participants who do not consume meat. The cases with missing values were omitted in order to obtain complete datasets for the confirmatory factor analyses. After reverse recoding, the item scores were summed into the raw scores of the eating behaviour dimensions. The three raw scores were transformed into scale scores from 0 to 100 [((raw score – lowest possible raw score)/possible raw score range) * 100](Reference de Lauzon, Romon and Deschamps43). A higher scale score indicated a greater tendency of the dimension in question.
Diet
Three-day food diaries were used to collect data on the dietary intake. Participants received oral and written instructions on how to fill in the food diary, and the completeness and accuracy of the intake were inspected with the help of a portion picture booklet. Daily intakes of energy and energy-yielding nutrients were calculated using the computerised software AivoDiet (version 2.0.2.3; Aivo, Turku, Finland). The nutrient intakes were expressed as a percentage of total energy intake (E%) and in grams per day.
Principal component analysis was performed based on the mean consumption of twenty-four food groups, and a dichotomous variable of dietary patterns was created for all participants (n 439). The detailed procedure has been presented previously(Reference Pajunen, Korkalo and Koivuniemi44,Reference Saros, Setänen and Hieta45) . Following principal component analysis, a scree plot and eigenvalues (>1·5) were used in the selection of the components. The first two components were translated into dietary patterns based on the loadings of different food group variables (min −0·48, max 0·57). Each woman received a component coefficient score for both patterns, the pattern with the higher score being designated as her predominant diet(Reference Pajunen, Korkalo and Koivuniemi44). Food groups such as vegetables, fruits and berries, rye bread, fish and seafood and margarine and oils had higher loadings (0·17–0·57) in the ‘healthier dietary pattern’. Conversely, food groups such as dairy desserts, pastries, sugar and sweets, potato crisps and beverages had higher loadings (0·22–0·41) in the ‘unhealthier dietary pattern’(Reference Pajunen, Korkalo and Koivuniemi44).
The overall diet quality was evaluated using the 18-question Index of Diet Quality inquiring about the amount and frequency of food consumption, including whole-grain products, dietary fat, vegetables, fruits and berries, sugar-containing drinks and sweets and dairy products(Reference Leppälä, Lagström and Kaljonen46). As defined by Leppälä et al.(Reference Leppälä, Lagström and Kaljonen46), the index score ranged from 0 to 15, where ≥10 signified a good diet quality and <10 a poor diet quality. A high diet quality score indicated health-promoting properties attributable to a higher intake of protein and fibre, a higher ratio of unsaturated to SFA and a lower intake of SFA and sucrose(Reference Leppälä, Lagström and Kaljonen46). Unsaturated fatty acids were divided into MUFA and PUFA.
Body weight and body composition
Women were classified as with overweight (BMI 25–29·9 kg/m2) or obesity (BMI ≥ 30 kg/m2) based on their pre-pregnancy BMI, which was calculated by self-reported pre-pregnancy weight obtained from health clinic records and height measured using a wall stadiometer to the nearest 0·1 cm at the early pregnancy study visit. The mean gestational weeks was 38·1 (sd 2·14) weeks at the last weight measurement either at the maternity clinic or at the late pregnancy study visit, depending on whichever occurred the latest(Reference Pellonperä, Koivuniemi and Vahlberg47). Excessive, ideal and inadequate GWG were defined based on pre-pregnancy BMI according to the guidelines issued by the Institute of Medicine(Reference Rasmussen and Yaktine48). The overall adiposity was investigated in detail by conducting body composition measurements with air displacement plethysmography, complying with the manufacturer’s instructions (the BOD POD system, software version 5.4.0, COSMED, Inc., Concord, CA).
Gestational diabetes
Gestational diabetes was diagnosed by a 75 g, 2-hour oral glucose tolerance test performed in health care clinics as described by Pellonperä, Mokkala et al.(Reference Pellonperä, Mokkala and Houttu42), complying with the guidelines of Finnish Current Care(49) and the American Diabetes Association(50). A total of 393 (90·6 %) participants provided an available test result.
Psychological symptoms
Maternal depressive symptoms were measured by the 10-item self-report Edinburgh Postnatal Depression Scale(Reference Cox, Holden and Sagovsky51). Despite being developed as a postnatal depression scale, Edinburgh Postnatal Depression Scale has also been used to measure antenatal depression(Reference Molyneaux, Poston and Khondoker12). Each item was scored on a four-point Likert scale from zero to three. The cut-off ≥thirteen out of thirty points signifies the possibility of a major depressive disorder that would demand further clinical evaluation according to the Finnish Institute of Health and Welfare(52). Maternal anxiety symptoms were assessed using the ten-item subscale of the Symptom Checklist-90 questionnaire(Reference Derogatis and Unger53). Questions measuring the feelings of nervousness, tension, panic and terror and the somatic correlates of anxiety(Reference Holi54) were scored on a five-point Likert scale from zero to four. This study considered a cut-off ≥11 out of forty points as an indicator of anxiety in line with the previous research examining associations between diet and maternal psychological symptoms(Reference Hulkkonen, Kataja and Vahlberg55).
Statistical analyses
Confirmatory factor analyses were performed for the TFEQ-R18 using the CFA function in IBM SPSS Amos with the maximum likelihood estimation to test the fit of this three-factor model with our datasets and to determine the most appropriate factor structure. When assessing the model’s fit, we used the goodness of fit indices and the cut-off criteria that were a relative χ 2 (χ 2/df) ratio of ≤5(Reference Wheaton, Muthén and Alwin56), a comparative fit index value of ≥0·95, a root mean square error of approximation value of ≤0·06 and a standardised root mean square residual value of ≤0·08(Reference Hu and Bentler57). We also calculated Cronbach’s alphas in IBM SPSS Statistics to estimate the internal consistency of the factors with values above 0·70 being considered acceptable(Reference Cortina58).
After confirmatory factor analysis, segmentation was performed for the baseline data from early pregnancy by applying a hybrid approach consisting of two main stages in IBM SPSS Statistics; first, the number of segments was explored by hierarchical cluster analysis, and second, segmentation was accomplished using K-means cluster analysis(Reference Helsen and Green59,Reference Punj and Stewart60) . We ran the clustering procedures on the complete sample using the three dimensions of eating behaviour. In the hierarchical cluster analysis, we used Ward’s method with squared Euclidean distances and determined the number of possible segments based on observation of a dendrogram and scatter-plots(Reference McDonald, Leckie and Karg61,Reference Napoli, Dickinson-Delaporte and Beverland62) . It was observed that a four-segment solution was the most appropriate. In order to validate this cluster solution, we used the mean values of these four segments as initial cluster centres in K-means clustering(Reference Napoli, Dickinson-Delaporte and Beverland62,Reference Homburg, Workman and Jensen63) . Lastly, ANOVA confirmed that the segments, representing the eating behaviour profiles, differed significantly (P < 0·001), and the result of the segmentation was regarded as valid. The revealed four eating behaviour profiles were similar to those previously recognised in Finnish and German populations(Reference Pentikäinen, Arvola and Karhunen18). Therefore, we decided to use the same designations for the profiles in this study: Struggling, Susceptible, Rational and Easy-going (Figure 1).
Identified eating behaviour profiles from the segmentation analysis in early pregnancy. Bars represent the mean scores of the eating behaviour dimensions ranging from 0 to 100, and error bars represent standard deviations.

Figure 1. Long description
The horizontal axis represents different eating behaviour groups: Total, Struggling, Susceptible, Rational, and Easy-going, with sample sizes indicated below each group. The vertical axis represents the score ranging from 0 to 100. The graph includes three sets of bars for each group, representing Cognitive restraint, Uncontrolled eating, and Emotional eating. Each set of bars has different patterns and colors: solid black for Cognitive restraint, diagonal stripes for Uncontrolled eating, and cross-hatched for Emotional eating. Error bars represent standard deviations. The Total group has a sample size of 434, with scores around 40 for Cognitive restraint, 30 for Uncontrolled eating, and 40 for Emotional eating. The Struggling group has a sample size of 139, with scores around 50 for Cognitive restraint, 40 for Uncontrolled eating, and 40 for Emotional eating. The Susceptible group has a sample size of 126, with scores around 40 for Cognitive restraint, 40 for Uncontrolled eating, and 70 for Emotional eating. The Rational group has a sample size of 93, with scores around 50 for Cognitive restraint, 20 for Uncontrolled eating, and 10 for Emotional eating. The Easy-going group has a sample size of 76, with scores around 10 for Cognitive restraint, 30 for Uncontrolled eating, and 20 for Emotional eating.
The normality of the data was checked visually from histograms and using skewness evaluations. Means and sd are presented for normally distributed continuous variables, while medians and interquartile ranges are reported for non-normally distributed variables. Categorical variables are summarised as frequencies and percentages. Descriptive characteristics of the sample were analysed using one-way ANOVA for normally distributed variables and χ 2 test or Fisher’s exact test for categorical variables with the Bonferroni method in further post hoc comparisons. Paired t-test was used to compare differences in eating behaviour dimensions between early and late pregnancy, and Cohen’s d was used to determine the effect size. Continuous outcomes were analysed using a general linear model with partial eta-squared as the effect size estimate, and categorical outcomes were analysed with a binary and multinomial logistic regression model. The models were adjusted for maternal education due to significant group differences in eating behaviour profiles at baseline. This covariate was selected to eliminate the confounding effect of education on the associations between the eating behaviour and outcome variables. The correlations between the eating behaviour dimensions and other variables were analysed with Pearson’s and Spearman correlation coefficients for normally and non-normally distributed variables, respectively, corrected with the Benjamini–Hochberg false discovery rate method and shown visually using heat maps. The false discovery rate correction threshold of q < 0·05 was used to control for false positives in the multiple correlation analyses. Overall, two-tailed P < 0·05 was considered statistically significant. Statistical analyses were conducted with IBM SPSS Statistics and Amos version 28·0 for Windows (IBM Corp, Armonk, NY).
Results
Confirmatory factor analysis
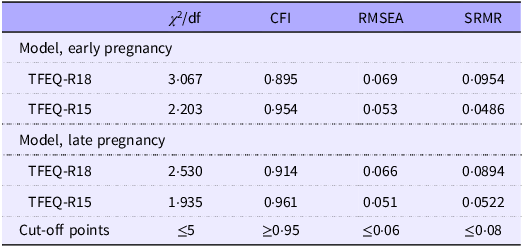
The final sample size for the current analyses was 434 participants in early pregnancy and 375 in late pregnancy (Supplement 1 Figure S1). Each item of the Finnish TFEQ-R18 was endorsed by 434 individuals in early pregnancy and 354 in late pregnancy. The fit indices for the original TFEQ-R18 suggested that this model needed refinement since only the χ 2/df ratio met the cut-off criteria (Table 1). Cronbach’s alphas showed acceptable reliability for all the factors in both early (UE = 0·84, CR = 0·71, EE = 0·88) and late pregnancy (UE = 0·85, CR = 0·73, EE = 0·89). In early pregnancy, the standardised loading of item 16 was 0·27, and it was therefore identified as a weak item (<0·30) (Supplement 2 Table S1). Nonetheless, when item sixteen was removed, the cut-off values of the fit indices were still not fulfilled. The factor loadings of items 14, 15 and 18 appeared similarly weak (0·39, 0·41 and 0·42, respectively), whereas other item loadings of the TFEQ-R17 were above 0·50. In addition, the squared multiple correlations for items 14, 15 and 18 were less than 0·20, signifying high levels of errors(Reference Hooper, Coughlan and Mullen64). Therefore, we estimated the fit indices repeatedly after deleting different combinations of these items.
Model fit statistics of the confirmatory factor analyses of the TFEQ in early and late pregnancy

Table 1. Long description
In both early and late pregnancy, the relative chi-square of the TFEQ-R18 was acceptable, i.e. lower than 5, but CFI was below the cut-off, i.e. 0·95, and RMSEA and SRMR were above the cut-off, i.e. 0·06 and 0·08, respectively. All these fit indices improved to an acceptable level in the TFEQ-R15 in early and late pregnancy.
Note: TFEQ = Three-Factor Eating Questionnaire; TFEQ-R18 = the original version; TFEQ-R15 = revised version with three omitted items; χ 2/df = relative chi-square; CFI = comparative fit index; RMSEA = root mean square error of approximation; SRMR = root mean square residual.
Finally, the revised 15-item model without items 15, 16 and 18 from the CR factor met all the cut-off criteria and showed the best fit for our data from early pregnancy (Supplement 2 Table S2). This model was also acceptable in late pregnancy (Supplement 2 Table S3). The CR factor remained reliable as Cronbach’s α value was 0·702 in early pregnancy and improved from 0·730 to 0·752 in late pregnancy. The items of the TFEQ-R15 are presented in Supplement 3. We decided to use this TFEQ-R15 model in the subsequent analyses instead of the TFEQ-R18, which was in accordance with previous studies performed using the same Finnish-translated version of the TFEQ-R18(Reference Pentikäinen, Arvola and Karhunen18,Reference Halali, Lapveteläinen and Karhunen65) .
Descriptive characteristics of the sample
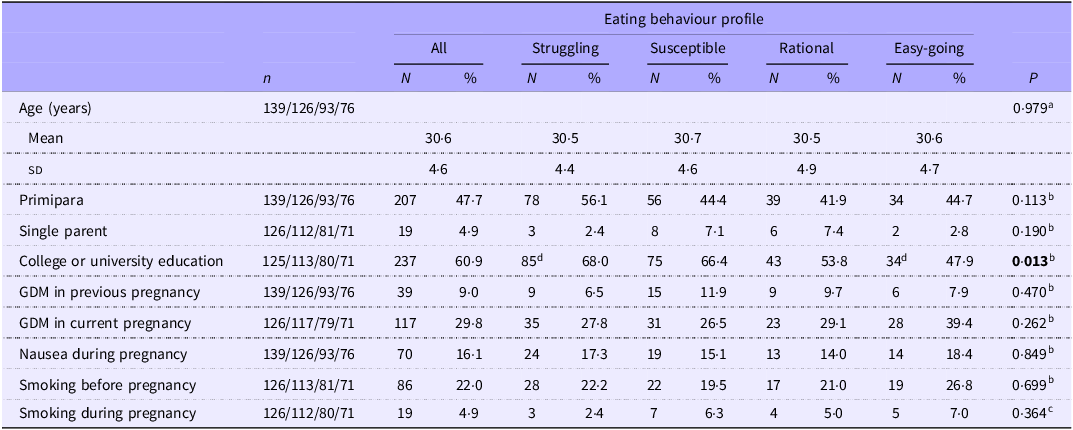
The descriptive characteristics of the participants (n 434) are shown in Table 2. Approximately two-thirds (60·9 %) had a college or university education; the women were highly educated in the Struggling group (68·0 %), while less than half (47·9 %) had a higher education level in the Easy-going group, the difference being significant between these groups. Gestational diabetes was diagnosed in almost every third woman (29·8 %) in her current pregnancy, with no statistically significant difference among the groups.
Descriptive characteristics of all pregnant women, subdivided according to their eating behaviour profiles

Table 2. Long description
The descriptive characteristics include mean age, primipara, single parent, college or university education, GDM in previous pregnancy, GDM in current pregnancy, nausea during pregnancy, smoking before pregnancy and smoking during pregnancy. There was one significant difference among the groups: the frequency of college or university education (chi-squared test p = 0·013) that was 237 (60·9 %) in total, 85 (68·0 %) in the Struggling group, 75 (66·4 %) in the Susceptible group, 43 (53·8 %) in the Rational group and 34 (47·9 %) in the Easy-going group (group sizes n 125/113/80/71), where the Struggling and Easy-going groups differed significantly.
Note: GDM = gestational diabetes mellitus. The statistical significance between the eating behaviour profiles was tested by aone-way ANOVA with age as a continuous variable and by b χ 2 test or cFisher’s exact test for categorical variables. dPairwise comparisons with Bonferroni adjustment, the same superscript letter in a row indicates a significant difference (P < 0.05) between these values.
Eating behaviour profiles and changes in eating behaviour
The Struggling group (n 139, 32·0 %) had high CR scores, indicating clear attempts to restrain eating in a cognitive manner. The Susceptible group (n 126, 29·0 %) had especially high scores for EE, thus being highly susceptible to emotions as cues to eating. The Rational group (n 93, 21·4 %) showed high attempts to restrain eating consciously, yet their scores for the other dimensions were low. The Easy-going group (n 76, 17·5 %) had low scores for all three dimensions, indicating a carefree eating behaviour. Each eating behaviour dimension differed significantly between the profiles in early pregnancy (P < 0·001; η 2 = 0·47/0·26/0·80 for CR/UE/EE, respectively) except for the CR scores between the Struggling and Rational groups (P = 1·000) and UE between the Struggling and Susceptible groups (P = 0·073) (Figure 1). Similarly, the differences were significant in late pregnancy (P < 0·001; η 2 = 0·20/0·18/0·45 for CR/UE/EE, respectively) except for the CR scores between the Struggling group and the Susceptible (P = 0·500) and Rational groups (P = 0·274), UE between the Rational and Easy-going groups (P = 0·460) and EE between the Struggling and Easy-going groups (P = 0·258) (Supplement 4 Figure S2).
The changes taking place in eating behaviour during the pregnancy are presented in Table 3. Overall, there was a significant decrease in EE and UE over the course of pregnancy (Cohen’s d = 0·16 for both). When evaluating the dimensions according to the eating behaviour profiles, CR decreased in the Struggling group, increased in the Easy-going group and did not change in the Susceptible or Rational groups (with partial η 2 = 0·07). UE decreased in the Struggling group but did not change in the other groups (with partial η 2 = 0·04). EE decreased in the Struggling and Susceptible groups and increased in the Rational and Easy-going groups (with partial η 2 = 0·15).
Changes in eating behaviour from early to late pregnancy

Table 3. Long description
Mean score change (95% CI) during pregnancy was -1·8 (-3·0, -0.6) for UE and -3·2 (-5·3, -1.1) for EE (paired t-test p = 0·003 for both). Pairwise comparisons of the mean changes showed that CR differed significantly in the Easy-going (mean change 7·3, 95% CI 2·9, 11·7) when compared to all other groups, UE was significantly different between the Struggling (mean change -4·9, 95% CI -6·9, -2·9) and Rational (mean change 1·0, 95% CI –1·2, 3·2) and EE differed significantly when comparing the Rational (mean change 6·3, 95% CI 2·6, 10·0) and Easy-going (mean change 5·1, 95% CI 0·4, 9·8) to the Struggling (mean change -6·3, 95% CI -9·8, -2·8) and Susceptible (mean change -12·1, 95% CI -16·1, -8·1).
Note: EP = early pregnancy (mean 13.8, sd 2.15 gestational weeks, n 139/126/93/76); LP = late pregnancy (mean 35.2, sd 0.97 gw, n 113/102/78/61); Δ = change from EP to LP.
a Paired t-test to compare means in EP and LP, n 113/102/78/61.
b General linear model adjusted for college or university education, n 111/101/75/61. c–f Pairwise comparisons with Bonferroni adjustment, the same superscript letter in a row indicates a significant difference (P < 0.05) between these values.
Dietary patterns, diet quality and intakes of energy-yielding nutrients
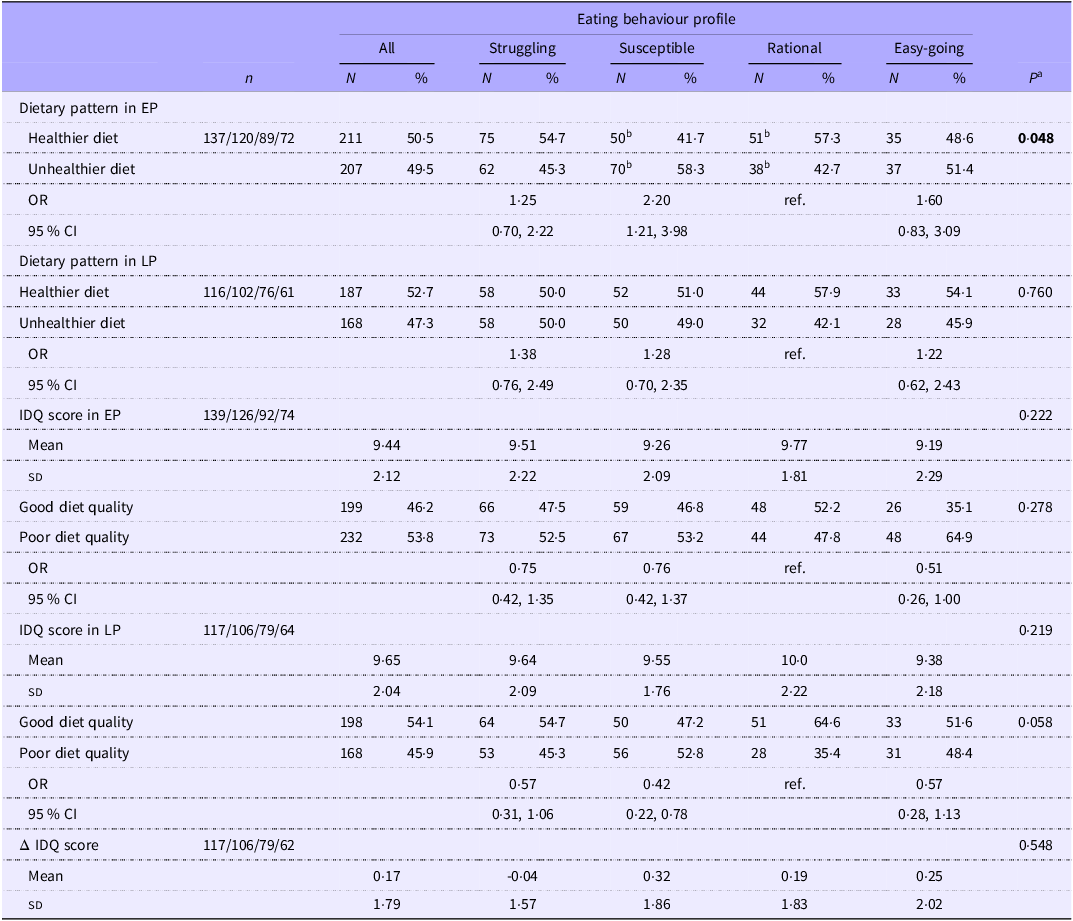
In early pregnancy, women in the Susceptible group had increased odds of an unhealthier diet when compared with the participants in the Rational group (P = 0·010) (Table 4). In late pregnancy, the dietary patterns did not differ among the groups. There were no significant differences in diet quality scores among the groups in early or late pregnancy or in change over the course of pregnancy.
Dietary patterns and diet quality of all pregnant women, subdivided according to their eating behaviour profiles

Table 4. Long description
There was one significant difference among the groups: the frequency of unhealthier dietary pattern in early pregnancy (binary logistic regression model with Wald’s test adjusted for education p = 0·048) that was 207 (49·5 %) in total, 62 (45·3 %) in the Struggling group (OR 1·25; 95% CI 0·70, 2·22), 70 (58·3 %) in the Susceptible group (OR 2·20; 95% CI 1·21, 3·98), 38 (42·7 %) in the Rational group (ref.) and 37 (51·4 %) in the Easy-going group (OR 1·60; 95% CI 0·83, 3·09) (group sizes n 137/120/89/72).
Note: EP = early pregnancy (mean 13.8, sd 2.15 gestational weeks); LP = late pregnancy (mean 35.2, sd 0.97 gw); Δ = change from EP to LP; IDQ = Index of Diet Quality, IDQ ≥ 10 out of 15 indicates good and IDQ < 10 poor diet quality.
a Binary logistic regression model with Wald’s test for dichotomic dependent variables (total n varied between 352–386) and general linear model with Bonferroni adjustment for mean IDQ scores as continuous dependent variables (total n varied between 358–386), adjusted for college or university education.
b Pairwise comparisons, the same superscript letter in a row indicates a significant difference (P < 0.05) between these values.
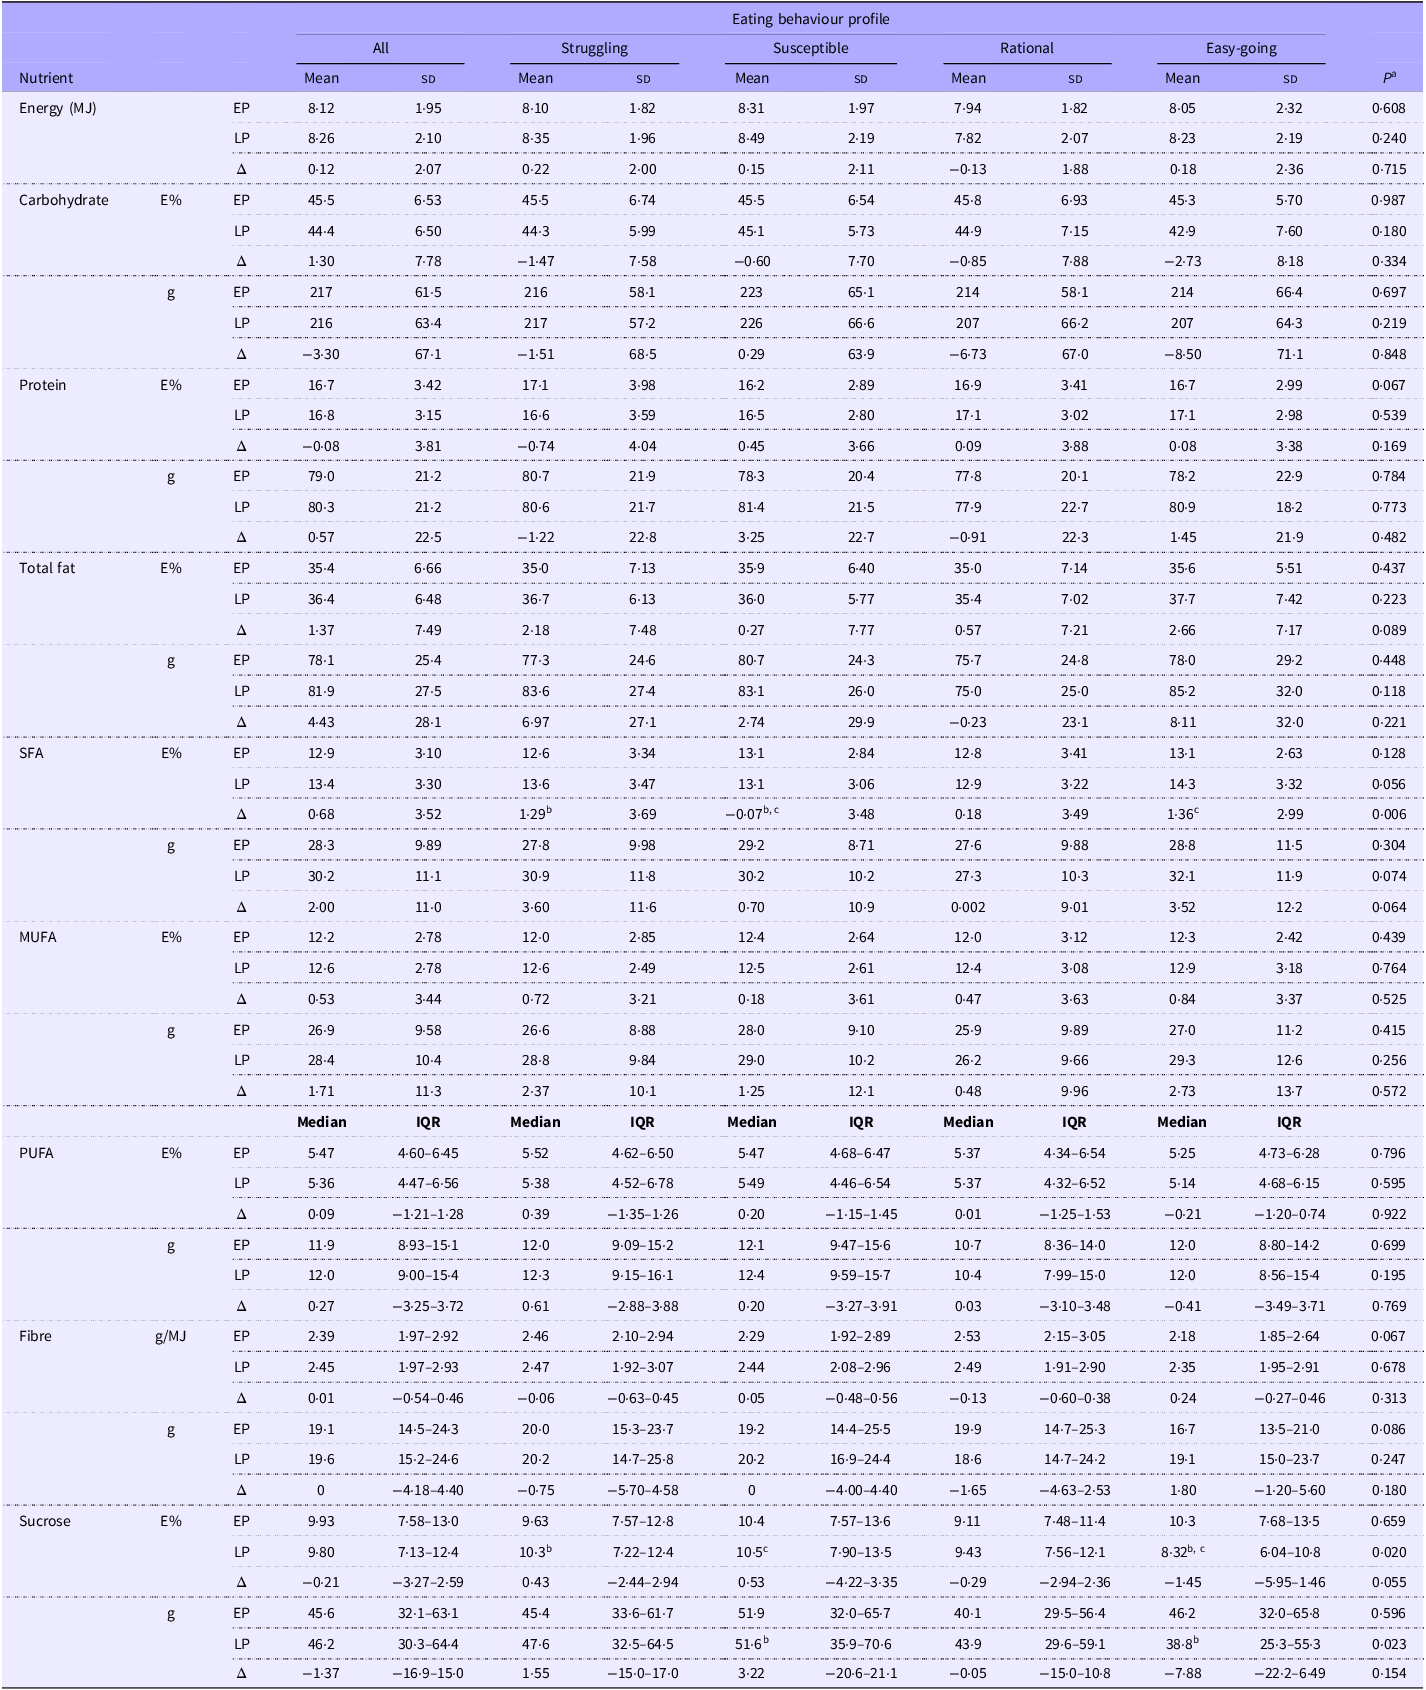
SFA intake (E%) differed significantly between the groups (with partial η 2 = 0·04), increasing in the Struggling (mean change 1·29; 95 % CI 0·62–1·97) and Easy-going groups (mean change 1·36; 95 % CI 0·58–2·14) from early to late pregnancy but not changing in the Susceptible (mean change −0·07; 95 % CI − 0·77–0·62) or Rational groups (mean change 0·18; 95 % CI − 0·63–0·99) (Table 5). There was a significant difference in sucrose intake in late pregnancy (with partial η 2 = 0·03 for E% and grams); in the Easy-going group, sucrose intake E% (P = 0·023) and in grams (P = 0·044) were lower than in the Susceptible group and E% (P = 0·040) lower than in the Struggling group.
Intakes of energy and energy-yielding nutrients of all pregnant women, subdivided according to their eating behaviour profiles

Table 5. Long description
General linear model adjusted for education indicated significant differences in the mean change in SFA E% intake (p = 0·006) and median sucrose intake in late pregnancy (E%, p = 0·020; in grams p = 0·023). Change in SFA E% was 1·29 E% (SD 3·69) in the Struggling and 1·36 E% (SD 2·99) in the Easy-going, both significantly higher than −0·07 E% (SD 3·48) in the Susceptible. This change was 0·68 E% (SD 3·52) in total and 0·18 E% (SD 3·49) in the Rational. Sucrose intake in late pregnancy was 9·80 E% (IQR 7·13–12·4) and 46·2 g (IQR 30·3–64·4) in total, 10·3 E% (IQR 7·22–12·4) and 47·6 g (IQR 32·5–64·5) in the Struggling, 10·5 E% (IQR 7·90–13·5) and 51·6 g (IQR 35·9–70·6) in the Susceptible, 9·43 E% (IQR 7·56–12·1) and 43·9 g (IQR 29·6–59·1) in the Rational and 8·32 E% (6·04–10·8) and 38·8 g (IQR 25·3–55·3) in the Easy-going. There was no significant difference in the intakes of energy (MJ), carbohydrate, protein, total fat, MUFA, PUFA or fibre E% or in grams.
Note: EP = early pregnancy (mean 13.8, sd 2.15 gestational weeks, n 137/120/89/72); LP = late pregnancy (mean 35.2, sd 0.97 gw, n 116/102/76/61); Δ = change from EP to LP (n 116/99/74/59); E% = intake of energy as a percentage of total energy intake.
aGeneral linear model with logarithmic transformations for skewed data adjusted for college or university education, n 125/109/78/68 EP; n 115/101/75/61 LP; n 115/98/73/59 Δ.
b, cPairwise comparisons with Bonferroni adjustment, the same superscript letter in a row indicates a significant difference (P < 0.05) between these values.
In the Struggling group, we detected positive correlations between CR and the diet quality score and protein intake (E%) in both early and late pregnancy (Figure 2a,b), as well as with UE and intakes of total fat, SFA and MUFA (g) in late pregnancy (Figure 2b). This group also displayed negative correlations with CR and intakes of SFA (E%, g) and sucrose (g) in early pregnancy (Figure 2a). In the Susceptible group, CR correlated positively with diet quality score and fibre intake (g/MJ) and negatively with intakes of total fat, SFA and MUFA (E%, g) in late pregnancy and over the course of pregnancy (Figures 2b and 3). In the Rational group, there were positive correlations between CR and the diet quality score and protein intake (E%, g) in early pregnancy (Figure 2a). In the Easy-going group, the women with higher UE scores had higher intakes of total energy (MJ), carbohydrate, protein, total fat, SFA, MUFA, fibre and sucrose (g) in early pregnancy (Figure 2a)
The heat maps representing Pearson and Spearman correlation coefficients between eating behaviour dimensions in each eating behaviour profile and diet, weight and psychological symptoms variables in A. early and B. late pregnancy. *P < 0·05 before the correction for the false discovery rate (FDR). **P < 0·05 before the FDR correction and q < 0·05 after the FDR correction.

Figure 2. Long description
After the FDR correction in EP: CR correlates positively with IDQ score and protein E% in the Struggling and Rational, and with protein in grams, pre-pregnancy BMI and EP weight in the Rational. CR correlates negatively with SFA E% and in grams and sucrose in grams in the Struggling. UE correlates positively with energy intake and with carbohydrate, protein, total fat, SFA, MUFA, fibre and sucrose in grams in the Easy-going. After the FDR correction in LP: CR correlates positively with IDQ score and protein E% in the Struggling and Susceptible, and with fibre g/MJ and pre-pregnancy BMI in the Susceptible. CR correlates negatively with total fat, SFA and MUFA E% and in grams in the Susceptible. UE correlates positively with total fat, SFA and MUFA in grams in the Struggling, and with energy intake and carbohydrate, total fat and MUFA in grams in the Susceptible, and with SCL-90 score in the Rational. EE correlates positively with EPDS score in the Struggling and Susceptible. There were no significant correlations between the eating behaviour dimensions and fat percentage.
The heat map representing Pearson correlation coefficients between the changes over the course of pregnancy in the eating behaviour dimensions of each eating behaviour profile and the changes in diet, body weight and psychological symptoms variables. aFrom EP to LP (kg), bFrom EP to LM (kg), cFrom pre-pregnancy to LM (kg). Δ = change from EP to LP; EP = early pregnancy (mean 13·8, sd 2·15 gestational weeks); LP = late pregnancy (mean 35·2, sd 0·97 gw); LM = last measurement (mean 38·1, sd 2·14 gw). *P < 0·05 before the correction for the false discovery rate (FDR). **P < 0·05 before the FDR correction and q < 0·05 after the FDR correction.

Figure 3. Long description
There are significant correlations after the FDR correction. Change in CR correlates positively with change in IDQ score, carbohydrate E% and fibre g/MJ in the Susceptible group. Change in CR correlates negatively with change in total fat, SFA and MUFA E% and in grams, GWG from EP to LP and EP to LM, change in fat percentage and fat mass in the Susceptible group. Change in EE correlates positively with change in EPDS score and SCL-90 score in the Susceptible group. There were no significant correlations between the change in eating behaviour dimensions and change in energy intake, carbohydrate in grams, protein E%, fibre in grams, sucrose E% or in grams.
Pre-pregnancy BMI, GWG and body composition
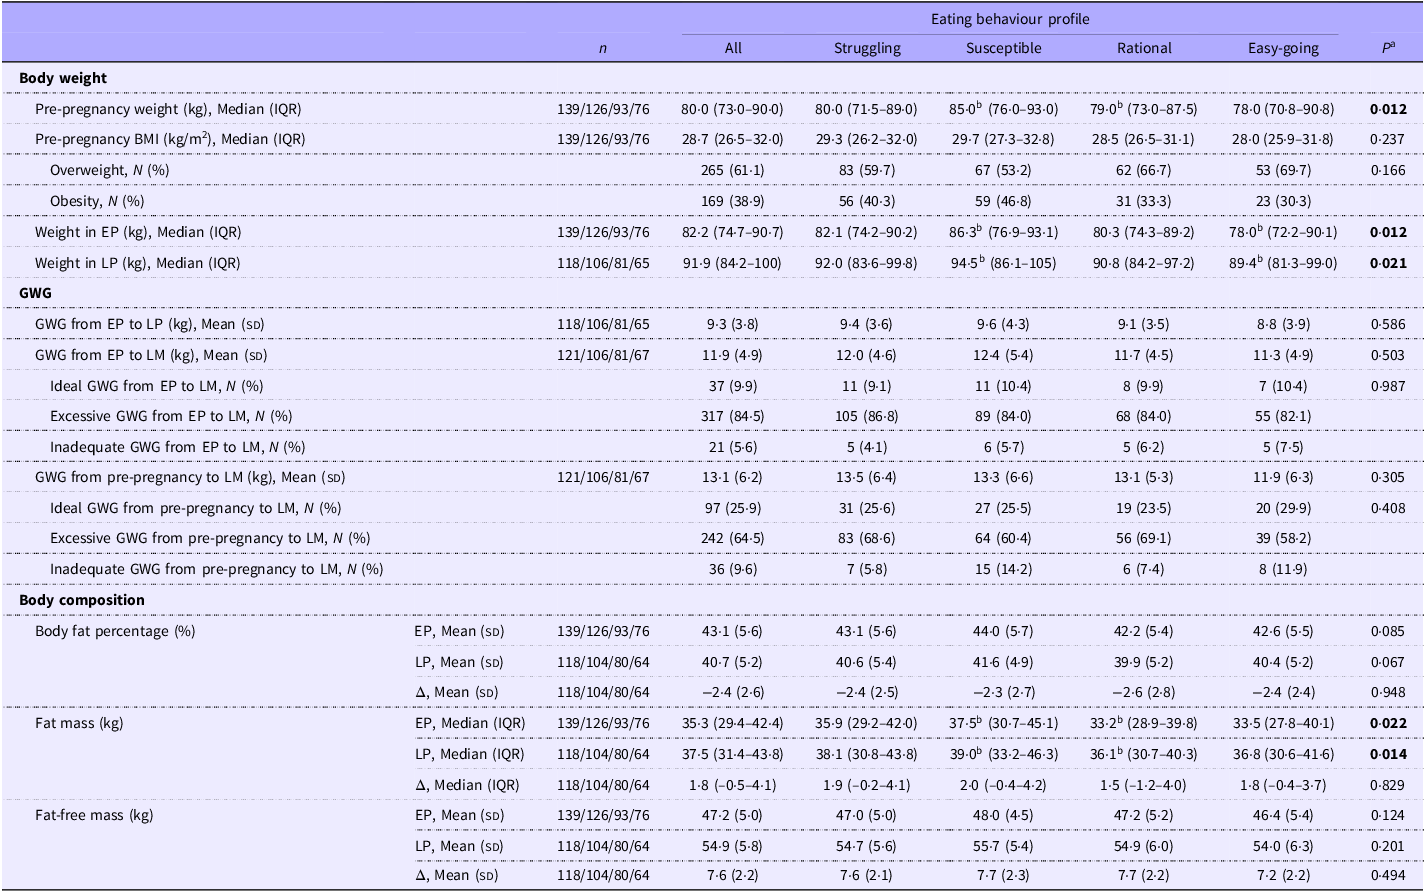
The greatest pre-pregnancy weights were present in the Susceptible group (median 85·0, IQR 76·0–93·0 kg; partial η 2 = 0·03), and the difference was significant as compared with the Rational group (P = 0·038) (Table 6). However, no significant difference was found in pre-pregnancy BMI among the groups. The Susceptible group had the highest body weight and fat mass in early pregnancy and late pregnancy (with partial η 2 = 0·03 for both in EP and LP) when compared with the Easy-going (weight in EP P = 0·029; LP P = 0·044) and Rational groups (fat mass in EP P = 0·042; LP P = 0·023), respectively. There were no significant differences in GWG among the groups.
Body weight and body composition of all pregnant women, subdivided according to their eating behaviour profiles

Table 6. Long description
There were significant differences in medians (IQR) of pre-pregnancy weight (n 139/126/93/76, 85·0 (76·0–93·0) kg in the Susceptible and 79·0 (73·0–87·5) in the Rational) and weight in early pregnancy (86·3 (76·9–93·1) kg in the Susceptible and 78·0 (72·2–90·1) kg in the Easy-going), weight in late pregnancy (n 118/106/81/65, 94·5 (86·1–105) kg in the Susceptible and 89·4 (81·3–99·0) kg in the Easy-going), fat mass in early pregnancy (n 139/126/93/76, 37·5 (30·7–45·1) kg in the Susceptible and 33·2 (28·9–39·8) kg in the Rational) and fat mass in late pregnancy (n 118/104/80/64, 39·0 (33·2–46·3) kg in the Susceptible and 36·1 (30·7–40·3) kg in the Rational). No significant difference was found in the continuous or categorical (ideal, excessive, inadequate) variables of GWG from early to late pregnancy, from early pregnancy to last measurement or from pre-pregnancy to last measurement. No significant difference was found in the mean fat percentage or mean fat-free mass.
Note: Overweight BMI 25–29.9 kg/m2, obesity BMI ≥ 30 kg/m2. Ideal, excessive and inadequate gestational weight gain (GWG) were defined by the recommendations of the Institute of Medicine. EP = early pregnancy (mean 13.8, sd 2.15 gestational weeks); LP = late pregnancy (mean 35.2, sd 0.97 gw); LM = last measurement (mean 38.1, sd 2.14 gw); Δ = change from EP to LP.
a General linear model for continuous dependent variables with logarithmic transformations for skewed data (total n varied between 360–389), binary logistic regression model with Wald’s test for pre-pregnancy BMI (n 125/113/80/71) and multinomial logistic regression model with likelihood ratio test for GWG (n 119/105/78/67) adjusted for college or university education.
b Pairwise comparisons with Bonferroni adjustment, the same superscript letter in a row indicates a significant difference (P < 0.05) between these values.
In the Rational group, higher pre-pregnancy BMI values and greater body weights in early pregnancy were associated with higher CR scores in early pregnancy (Figure 2a), which also applied to the Susceptible group regarding pre-pregnancy BMI in late pregnancy (Figure 2b). In the Susceptible group, the change in CR was negatively correlated with GWG as well as with the change in body fat percentage and fat mass (Figure 3).
Depressive and anxiety symptoms
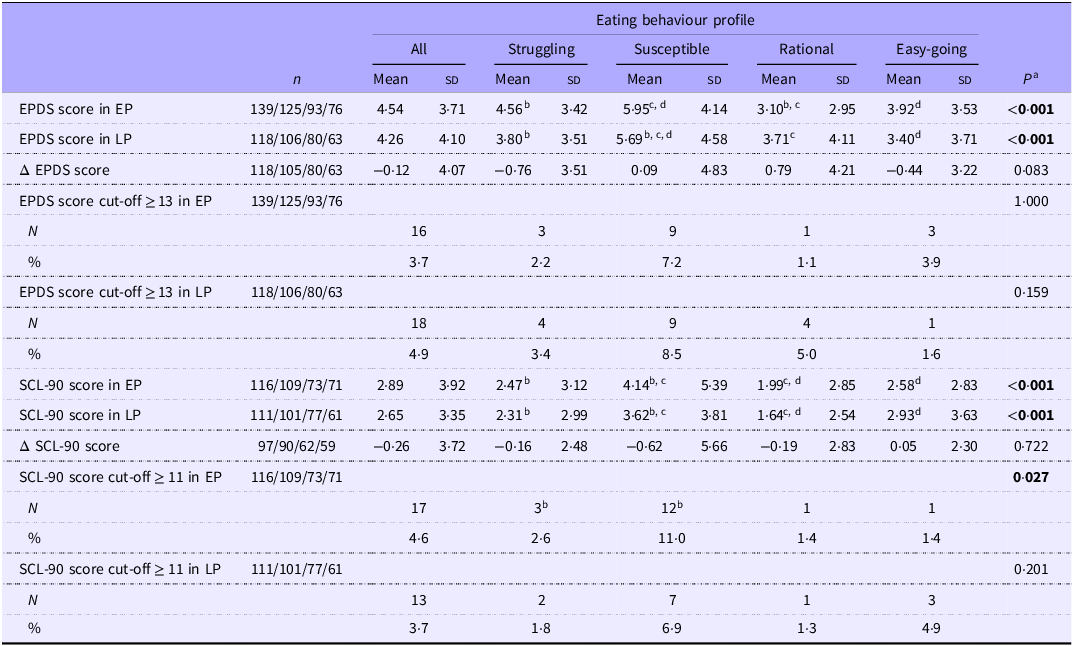
The Susceptible group had the highest depression scores in early pregnancy and late pregnancy (with partial η 2 = 0·08 and 0·05, respectively), and the group difference was significant between these women and those in the Rational (P < 0·001) and Easy-going groups (P = 0·001) in early pregnancy and with all other groups in late pregnancy (P < 0·05) (Table 7). In early pregnancy, the depression score also differed significantly between the Struggling and Rational groups (P = 0·002). The anxiety score was the highest in the Susceptible group, whereas it was the lowest in the Rational group in early and late pregnancy (with partial η 2 = 0·07 and 0·06, respectively). In pairwise comparisons, the anxiety scores of the Susceptible group differed from those of the Struggling (EP P = 0·029; LP P = 0·033) and Rational groups (EP and LP P < 0·001) and the anxiety scores of the Rational group differed from those of the Easy-going group (EP P = 0·029; LP P = 0·039). In early pregnancy, the highest percentage (11·0 %) of women with clinically significant anxiety symptoms (the cut-off ≥ 11) was detected in the Susceptible group.
Depressive and anxiety symptoms of all pregnant women, subdivided according to their eating behaviour profiles

Table 7. Long description
There were significant differences in the mean EPDS scores in early pregnancy (n 139/125/93/76, highest 5·95 (SD 4·14) in the Susceptible and lowest 3·10 (SD 2·95) in the Rational) and late pregnancy (n 118/106/80/63, highest 5·69 (SD 4·58) in the Susceptible and lowest 3·40 (SD 3·71) in the Easy-going), the mean SCL-90 scores in early pregnancy (n 116/109/73/71, highest 4·14 (SD 5·39) in the Susceptible and lowest 1·99 (SD 2·85) in the Rational) and late pregnancy (n 111/101/77/61, highest 3·62 (SD 3·81) in the Susceptible and lowest 1·64 (SD 2·54) in the Rational) and the frequency of the exceeded SCL-90 score cut-off in early pregnancy (highest 12 (11·0 %) in the Susceptible, low (1·4–2·6 %) in other groups).
Note: EP = early pregnancy (mean 13.8, sd 2.15 gestational weeks); LP = late pregnancy (mean 35.2, sd 0.97 gw); Δ = change from EP to LP; EPDS = Edinburgh Postnatal Depression Scale, the cut-off ≥ 13 out of 30 points signifies the possibility of a major depressive disorder; SCL-90 = the anxiety subscale of the Symptom Checklist 90, the cut-off ≥ 11 out of 40 points indicates anxiety.
aGeneral linear model with Bonferroni adjustment for continuous dependent variables (total n varied between 303–388) and binary logistic regression model with Wald’s test for score cut-offs as dichotomic dependent variables (total n varied between 328–388) adjusted for college or university education.
b–dPairwise comparisons, the same superscript letter in a row indicates a significant difference (P < 0.05) between these values.
In late pregnancy, the women with higher depression scores in both the Struggling and Susceptible groups had significantly higher EE (Figure 2b). In the Susceptible group, the change in EE correlated positively with the change in depression and anxiety scores (Figure 3). In the Rational group, there was a significant positive correlation between the anxiety score and UE in late pregnancy (Figure 2b). Eating behaviour dimensions were not found to correlate with either the depression or the anxiety scores in early pregnancy.
Discussion
We identified four eating behaviour profiles from the segmentation analyses: the Struggling (high scores for CR), Susceptible (high scores for EE), Rational (high scores for CR and low scores for UE and EE) and Easy-going groups (low scores for CR, UE and EE). The women in the Susceptible group had most often an unhealthier dietary pattern as well as the highest sucrose intake, body weight, fat mass and level of depressive and anxiety symptoms. A higher CR score was associated with higher pre-pregnancy BMI values, a healthier dietary intake and a better diet quality in the Susceptible and Rational groups. Lastly, we detected no significant difference in GWG between the groups. However, exploring the changes in the eating behaviour dimensions over the course of pregnancy revealed that the change in CR correlated negatively with GWG and the change in body fat percentage in the Susceptible group.
The identified eating behaviour profiles were similar to those previously observed in Finnish and German samples(Reference Pentikäinen, Arvola and Karhunen18), although in our study, EE was slightly more accentuated. This is possibly due to our study sample which consisted of only women since men with obesity tend to have less emotional eating(Reference Guerrero-Hreins, Stammers and Wong66). When examining the eating behaviour changes during pregnancy, EE decreased significantly in all of the women in concordance with one recent study(Reference Yu, Van Blyderveen and Schmidt67). The Susceptible group was found to exhibit a prominent decrease in EE, possibly related to their previously higher EE level that regressed towards the mean during the follow-up. The high EE level may also have increased their motivation and behavioural attempts to reduce stress-related EE and food cravings. It can be speculated that pregnancy might be associated with reduced negative emotions stimulating EE or with the Susceptible group using different coping mechanisms other than EE, calling for further research on this topic. Here, higher education was unexpectedly more common in the Susceptible group rather than in the Rational group, in which women were in better control of eating. One might have assumed that those better-educated participants would be more aware of the benefits of good nutritional health, as has often been observed previously(Reference Rosenqvist, Kiviruusu and Konttinen68,Reference Wesołowska, Jankowska and Trafalska69) .
When examining the intakes of energy-yielding nutrients, a higher sucrose intake was observed in the Susceptible group with both EE and unhealthier dietary pattern as distinct features, but nonetheless their sucrose intake was not correlated directly with EE in contrast to previous studies in non-pregnant populations(Reference Dakanalis, Mentzelou and Papadopoulou32,Reference Konttinen, Männistö and Sarlio-Lähteenkorva33,Reference van Strien, Cebolla and Etchemendy70) . This could be explained by the motivational effects of pregnancy to eat less foods containing high sugar levels as postulated by Jaakkola et al.(Reference Jaakkola, Hakala and Isolauri13), a proposal that is supported by similar results in postpartum women. In addition, cravings and alternating tastes for foods do occur during pregnancy, which might affect the dietary intake during EE and explain the varying results in pregnant women. Furthermore, we found that SFA intake increased in the Struggling and Easy-going groups indicating a move towards a more unhealthy diet. Nevertheless, the carefree eating behaviour of the Easy-going group was not reflected in their lower sucrose intake in late pregnancy, likely because their CR increased over the course of pregnancy. Although the feelings of pregnancy-related nausea may also modify dietary intake, there was no significant difference in nausea between the eating behaviour profiles.
We detected that women with higher CR had a higher diet quality score in the Struggling, Susceptible and Rational groups. Overall, it seemed that the CR score was found to correlate positively with intakes of carbohydrate, protein and dietary fibre and negatively with intakes of fat and sucrose. Likewise, prior research has found similar associations between a healthier diet and CR in the general population(Reference de Lauzon, Romon and Deschamps43) and dietary restraint as measured by DEBQ in pregnant women(Reference Shriver, Eagleton and Hosseinzadeh20). One recent study has also reported an opposite result between dietary restraint and carbohydrate intake in pregnant women(Reference Yeh, Meng and Fernandez71). However, the consumption of whole-grain carbohydrate foods with dietary fibre could explain our differing results, while this previous study using another measure of restrained eating did not analyse the fibre intake. Here, a higher UE was associated with a higher energy intake in the Susceptible and Easy-going groups in agreement with one study focusing on eating behaviour in preconception(Reference Loh, Loy and Appannah21).
In this study, there was a positive correlation between pre-pregnancy BMI and CR in the Susceptible and Rational groups. Similarly, a high CR score has been suggested to indicate a previous weight gain in men and women(Reference Konttinen, Llewellyn and Silventoinen72). Furthermore, a higher body weight and greater amounts of fat were accentuated in the Susceptible group. We also found that the more the CR score increased during the pregnancy in the Susceptible group, the lower was their GWG, although restrained eating has been previously associated with higher values of GWG(Reference Slane and Levine29,Reference Sparks, Redman and Drews31) . It should be noted that previous studies have assessed restrained eating at individual time points in pregnancy using other behaviour measurements and not the TFEQ-R18, which could explain the contrasting results. Additionally, possible confounders to this connection might be other eating behaviour dimensions. Nonetheless, neither UE nor EE was associated with GWG, consistent with a recent study regarding preconception eating behaviour(Reference Loh, Loy and Appannah21) and other previous reports measuring disinhibition and susceptibility to hunger in pregnant women(Reference Tang, Andres and West26,Reference Plante, Lemieux and Drouin-Chartier73) .
We observed that women in the Susceptible group had the highest level of depressive symptoms and clinically significant anxiety symptoms, which were furthermore associated with an increase in EE over pregnancy, in line with a recent study suggesting that psychological distress might predict emotional eating during pregnancy(Reference Carandang, Epel and Radin39). Furthermore, the anxiety scores correlated positively with UE in the Rational group, although their levels of psychological symptoms were overall lowest among the eating behaviour profiles. Anxiety, as an internal cue, has been reported to increase disinhibition(Reference Hussenoeder, Conrad and Engel74), and this has been related to both UE and EE in women with overweight or obesity(Reference Witaszek, Babicki and Brytek-Matera35,Reference Cifuentes, Campos and Silgado36) . These dimensions act as a mechanism to comfort and regulate the feeling of anxiety, whereas this negative emotion tends to lessen the ability to restrain food intake(Reference Cifuentes, Campos and Silgado36). However, we found no connections between CR and depressive or anxiety symptoms.
As strengths, this study was based on data from a clinical study with precise data collection and a long-term follow-up. In order to reduce the risk of coincidental findings, we used the false discovery rate correction that powerfully controls for any possible errors obscuring our significant correlations. Examining data from both early and late pregnancy allowed for a broader understanding of changes in eating behaviour during pregnancy. By using the TFEQ-R18 instead of the original 51-item TFEQ, we were able to improve our ability to evaluate UE and EE separately, since these dimensions overlap in the disinhibition scale of the original TFEQ version. In previous studies, this overlapping may have accounted for the uncertain internal consistency of the disinhibition scale, which has been recognised when measuring individuals with overweight(Reference Bohrer, Forbush and Hunt28). By using confirmatory factor analyses, we validated the factors of the TFEQ-R18 to fit specifically to our data in early pregnancy and to ensure good-quality analyses. After excluding the three least satisfactory items (15, 16 and 18) of the TFEQ-R18, the psychometric properties indicated that the TFEQ-R15 functioned as expected in both early and late pregnancy. Consistently, these omitted items have been perceived as challenging to estimate in Finnish populations(Reference Pentikäinen, Arvola and Karhunen18,Reference Halali, Lapveteläinen and Karhunen65,Reference Malkki-Keinänen, Lankinen and Karhunen75) as well as in other cultural settings(Reference de Lauzon, Romon and Deschamps43,Reference Chong, Ayob and Chong76–Reference Mostafavi, Akhondzadeh and Mohammadi78) .
In the TFEQ-R18, the challenge of item 18 may relate to it being the only numeric Likert scale with the extremes characterised by total uncontrolled eating and complete restraint in eating. In addition, the varying response options of items 14–18 have been speculated to explain their weak loadings to CR and UE(Reference Malkki-Keinänen, Lankinen and Karhunen75). Furthermore, the CR factor has been recognised as problematic due to a tendency to subdivide into separate components(Reference Kavazidou, Proios and Liolios77). The CR of the TFEQ-R15 that consists of items 2, 11 and 12 reflects restrained eating with the intent to control weight, whereas the omitted items 15, 16 and 18 measure restrained eating from a more general aspect without a direct reference to weight. Hence, this could explain why this three-item dimension provided the best-fitting model among women with overweight or obesity. Additionally, item 16 ‘How likely are you to consciously eat less than you want?’ might not apply to pregnant women since dieting is not advised during pregnancy, even with overweight or obesity.
Given that women with overweight or obesity are a notably increasing proportion, currently 49·6 % of the population of pregnant women in Finland(79), we intentionally sought to examine this specific group who carry a significant risk for developing health problems. However, this limits the generalisability of our results to pregnant women with normal or underweight. Furthermore, women with overweight or obesity may have reported information inaccurately in the self-reported food diaries and questionnaires, which in turn may bias the findings towards more favourable results. For example, an under-reporting of energy intake has been associated with a higher pre-pregnancy BMI and EE(Reference McNitt, Hohman and Rivera80). Filling in the food diaries could also have influenced the participants’ conceptions of their dietary intake, possibly leading to behavioural changes such as decreased EE during pregnancy. Women with overweight or obesity have likely received targeted counselling at maternity clinics to prevent excessive GWG, although the amount and level of guidance may be variable(Reference Huurre, Laitinen and Hoppu81). At maternity clinics in Finland, pregnancy-related advice is mainly offered by nurses instead of obstetricians and women with overweight or obesity are referred to a dietitian as well as a psychologist when support in well-being is needed. Thus, some cultural differences in the accessibility and use of public maternal health care may limit the adaptation of eating behaviour profiles to other populations.
In conclusion, pregnancy is a unique and vulnerable phase when lifestyle factors, such as eating behaviour, may affect the health of both the mother and child even for years to come. Previously, higher values of GWG have been associated with dietary restraint(Reference Slane and Levine29,Reference Sparks, Redman and Drews31) . Since dietary restraint is also associated with a healthier diet in pregnant women(Reference Shriver, Eagleton and Hosseinzadeh20), it could be speculated that previous excessive GWG drives restrained eating during pregnancy. However, this causality has not been studied. Increasing CR also appears to result in less GWG as well as lower fat mass and body fat percentage, as we reported. Moreover, pregnancy may increase psychological distress through stress and depressive symptoms that could drive emotional eating(Reference Carandang, Epel and Radin39). The prevalence of anxiety disorders is also higher during pregnancy compared with women in the general population(Reference Viswasam, Eslick and Starcevic82). In addition to this, our results show that anxiety symptoms are associated with higher UE and increasing EE during pregnancy.
Overall, this study provides novel insights into eating behaviour patterns since there is very little previous scientific data about psychological dimensions of eating behaviour and their changes during pregnancy. Similar eating behaviour profiles have been recognised previously in the general population(Reference Pentikäinen, Arvola and Karhunen18), suggesting that pregnancy does not exert an independent effect on the profiles and they apply to many groups of people. If these eating behaviour profiles are confirmed in future research, they could be validated and used directly to analyse data without the need to undertake the laborious segmentation procedures. It could be argued that the populations with overweight or obesity might have certain features in eating behaviour profiles that are reflected in their dietary intakes. Furthermore, eating behaviour does not remain constant during pregnancy. Thus, exploring changes in eating behaviour may explain the connections to GWG and body composition more than evaluating eating behaviour only at a single time point.
It is important to identify those pregnant women with problematic eating behaviour profiles. In this respect, the Susceptible group seems to be especially prone to increased adiposity, an unhealthier dietary intake and clinically relevant anxiety during pregnancy. Together, these physiological and psychological factors may result in a disadvantageous nutritional and behavioural system increasing the risk for harmful health effects(Reference Gilmore, Klempel-Donchenko and Redman2,Reference Saros, Setänen and Hieta45,Reference Saros, Lind and Setänen83,Reference Staneva, Bogossian and Pritchard84) . Furthermore, identifying the women who represent the Susceptible group already in early pregnancy could permit us to implement earlier interventions focused on managing emotional eating triggers, such as methods of alleviating anxiety. Moreover, although the Easy-going group seemed to display less unfavourable eating behaviour dimensions as reflected in UE and EE, their dietary intake may be challenging during pregnancy due to their lower CR scores, which could require enhanced dietary advice from a dietitian.
One could argue that the changes in diet may arise from a specific eating behaviour profile. This should be considered in maternity clinics since the early nutritional environment has far-reaching influences on the offspring’s health through foetal programming(Reference Hoffman, Powell and Barrett85). In practical terms, these profiles could offer crucial information for the health care of pregnant women as they may allow the health care professionals to identify potential health risks concerning unhealthy diet, excessive GWG and psychological symptoms, and to help the mothers-to-be to obtain assistance if necessary. Therefore, it will be beneficial to clarify the physiological and psychological framework of eating behaviour, diet and body weight and to establish the clinical relevance of the eating behaviour profiles occurring during pregnancy.
Supplementary material
The supplementary material for this article is available at https://doi.org/10.1017/S0007114526108319.
Data availability statement
All data used in this study are confidential because of containing information that may compromise participants’ privacy and consent. The data could only be accessed by the members of the study group.
Acknowledgements
The authors would like to thank all the participants for their contribution to this study.
Elisa Liimatainen: Formal analysis-Equal, Investigation-Equal, Validation-Equal, Visualisation-Equal, Writing – original draft-Equal, Writing – review & editing-Equal; Lotta Saros: Resources-Equal, Writing – review & editing-Equal; Tero Vahlberg: Formal analysis-Equal, Writing – review & editing-Equal; Leila Karhunen: Conceptualisation-Equal, Investigation-Equal, Methodology-Equal, Supervision-Equal, Validation-Equal, Writing – review & editing-Equal; Kirsi Laitinen: Conceptualisation-Equal, Funding acquisition-Equal, Investigation-Equal, Methodology-Equal, Project administration-Equal, Resources-Equal, Supervision-Equal, Validation-Equal, Writing – review & editing-Equal.
This work was supported by the State Research Funding for university-level health research in the Turku University Hospital Expert Responsibility Area, Academy of Finland (#258 606), the Diabetes Research Foundation, the Juho Vainio Foundation, the Päivikki and Sakari Sohlberg Foundation and the Signe and Ane Gyllenberg Foundation. These funding sources were not involved in the design, execution, analyses, interpretation of data, writing or decision to submit results.
The authors declare no conflict of interest.






 Open access

