Introduction
Development of ultrafine eutectics is an important and a fast-growing topic of research [Reference He, Eckert, Löser and Schultz1, Reference Park, Sohn, Kim, Kim, Kim and Kim2, Reference Louzguine, Kato and Inoue3]. It has been reported that in situ bulk nanostructure–dendrite composites of Ti-base and Fe-base eutectic alloys are able to merge high strength and good plasticity, which are benefits of such unique microstructures [Reference He, Eckert, Löser and Schultz1, Reference Park, Sohn, Kim, Kim, Kim and Kim2, Reference Louzguine, Kato and Inoue3].
A recent research on eutectic growth of the ternary Al81Cu13Si6 (at.%) alloy resulted in the formation of novel bimodal nano-/ultrafine eutectic arrays with fine and coarse length scales under fast cooling conditions. It was demonstrated that microstructures formed by a fine binary eutectic colony (α-Al + Al2Cu) embedded in a nanometer-scale anomalous ternary eutectic (α-Al + Al2Cu + Si). It is suggested that the microstructure and scale heterogeneities are the main reasons for the excellent mechanical properties at room temperature, that is, strength of 1.1 GPa and ductility of 11% under compressive load. The feature length scales of solidification microstructure of Al–Cu–Si were categorized as eutectic colony having the average size from 10 to 20 μm and eutectic lamellar spacing in the variety from 300 to 700 nm [Reference Park, Mattern, Kühn, Eckert, Kim, Kim, Chattopadhyay and Kim4].
Ultrafine Al alloys for structural applications have their practical usage very limited as a result of their low plasticity. Recently, bimodal ultrafine eutectic alloys composed of multiscale eutectic structures have deserved attention due to their improved plasticity and prolonged life in service conditions [Reference He, Eckert, Löser and Schultz1, Reference Ma5, Reference Liddicoat, Liao, Zhao, Zhu, Murashkin, Lavernia, Valiev and Ringer6]. As demonstrated by Wang et al. [Reference Wang, Chen, Zhou and Ma7], the application of selected compositions is supported by an optimal construction of either microstructural or chemical heterogeneities. Furthermore, considering that promising ultrafine Al–Cu–Si alloys are characterized by quite high total contents of Si + Cu, the design concepts must include thermodynamic computations for describing the microstructural evolution during solidification of multicomponent alloys. Simulated aspects may involve transformation temperatures, temperature ranges, proportions of phases, and different variant and invariant reactions along solidification.
Literature specialized in ultrafine Al alloys [Reference Koch8, Reference Lee, Hong, Kim, Park, Song, Park, Suh, Seo, Qian and Kim9] agrees on specifying size, fraction, morphology, and distribution of constituent phases as important factors to determine the resulting mechanical properties. However, there is a lack of investigations emphasizing the correlations between feature length scales of ultrafine alloys and solidification operating parameters such as cooling rate and growth velocity. Experimental correlations between microstructure and cooling rate of various types of metallic alloys can be found in the literature [Reference Reyes, Bello, Kakitani, Costa, Garcia, Cheung and Spinelli10, Reference Eskin and Katgerman11, Reference Jackson and Hunt12, Reference Jones13, Reference Mertinger, Szabó, Bárczy, Kovács and Czél14, Reference Juarez-Hernandez and Jones15, Reference Zhuang, Zhang, Zhu and Hu16, Reference Verissimo, Brito, Santos, Cheung, Spinelli and Garcia17].
Kim and co-authors [Reference Kim, Lee, Hong, Park, Park, Lee, Seo, Wang, Park and Kim18] examined ternary Al–Cu–Si alloys by five-compositional tuning and investigated the compressive properties. They claimed that ductile α-Al solid solution phase has a significant effect on the plasticity, while the Al2Cu and Si phases constitute obstacles in accommodation of plastic strain. Bimodal eutectic matrix alloy samples resulted in better compressive strength than single eutectic matrix alloys. Ramakrishnan et al. [Reference Ramakrishnan, Lei, Misra and Mazumder19] demonstrated that bimodal-type structures in Al81Cu13Si6 alloy (at.%) ceased to form at cooling rates greater than 4 × 10⁴ K/s.
The formation of the eutectic colony is mainly reported to be related to the presence of a ternary impurity element, leading to the constitutional supercooling at the solidification interface [Reference Tiller20]. Tiller [Reference Tiller20] successfully applied the constitutional supercooling criterion to the instability of a planar eutectic interface to determine limiting conditions permitting a colony to be formed. The formation of a two-phase cellular constituting the bimodal ultrafine eutectic of Al alloys is often referred to as a eutectic colony structure. Most of the investigations so far have focused on the fast cooling growth of the eutectic colony structure. Under such conditions, variations in the size of the colony and their phases with cooling rate have not been demonstrated. Moreover, the ranges of applied cooling rates are restricted to a range from 102 to 104 K/s.
It is worth noting the importance of distinguishing the relationships between microstructure and solidification operating parameters in ultrafine eutectic composites. The understanding of solidification owing to such relationships has fundamental importance for planning of manufacturing processes, hence allows a better understanding of the factors affecting microstructure of the ultrafine Al alloys. In order to assess microstructure–cooling rate relationships, the present research explores the feature length scale across the longitudinal axis of the Al–15 wt% Cu–7 wt% Si and Al–22 wt% Cu–7 wt% Si alloy castings directionally solidified under transient heat flow regime. Specific goals are to determine the variations in the primary (λ1) and secondary (λ2) dendrite arm spacings associated with the range of experimental cooling rates and growth velocities and to express eutectic structure in terms of the variation in Al2Cu interphase spacing. Correlations between the mechanical properties (i.e., tensile strength and hardness) and the λ1 are also envisaged. Thermodynamic computations will allow the fractions of the phases and constituents in both Al alloys to be outlined.
So far, the methods to produce ultrafine eutectic composites from rapid solidification (RS) have not permitted the calculation of cooling rates. This means that the effects of cooling rate on the size and the distribution of the bimodal eutectic composite remain unknown. In present research, a methodology permitting microstructure scaling laws to be determined over a wide range of cooling rates becomes available.
Results and discussion
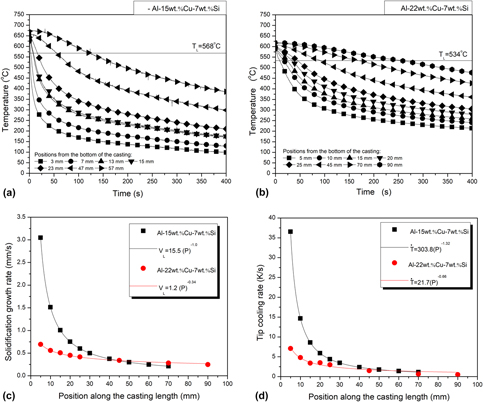
The thermal profiles recorded during the solidification of the studied alloys are shown in Figs. 1(a) and 1(b). Each profile of each alloy reveals the shifts on temperature with time evolution. A suitable consideration of these profiles may provide the experimental variations in solidification cooling rates and growth velocities.
Thermal profiles recorded during the water-cooled DS of the (a) Al–15 wt% Cu–7 wt% Si and (b) Al–22 wt% Cu–7 wt% Si alloys and plots of (c) growth rate and (d) cooling rate across the axial length of the castings.

Based on the plots in Figs. 1(a) and 1(b), evolutions of the liquidus isotherm along the length of both Al alloy castings could be expressed during cooling. The necessary information for that is the liquidus temperature of the alloy, which has been previously determined, based on the separately registered cooling curves. Another piece of information refers to transit of the liquidus isotherm on each of the engaged thermocouples at various positions (P) along the length of the casting. As a consequence, position × time (P × t) plots could be generated.
The values of growth velocities, V L, in Fig. 1(c) are direct results of the time derivatives of the P × t experimental functions. Significant shifts of  $\dot T_{\rm{L}}$ can be noted in Fig. 1(d) if compared different positions across the castings. Analogously, rates of displacement of the Al–Si–Al2Cu ternary eutectic (V E) could be calculated from the thermal profile analyses of both alloys. The calculation of such velocities is very important since their magnitudes may have an impact on either the eutectic scales or the morphology developed from the eutectic reaction.
The determination of the tip cooling rate,  $\dot T_{\rm{L}}$, as a function of position (P) in the casting, was carried out by computing the time derivative of each cooling curve (dT/dt) right after the passage of the liquidus isotherm by each thermocouple. A large spectrum of cooling rates is shown in Fig. 1(d), which vary from 0.5 to 37.0 K/s. One can establish that cooling rates of these directionally solidified Al alloys reached both slow and intermediate cooling regimes of solidification. This allows a comprehensive analysis of inherent aspects occurring during solidification, such as the scale of the phases forming the microstructure, such as dendrite arm spacings and interphase spacings, and the size, morphologies, and distribution of such phases. This is quite scarce on the literature devoted to the development of Al–Cu–Si ultrafine eutectic alloys. This is because most findings available in literature for ultrafine metallic alloys have been obtained so far by methods without measuring/estimating cooling rates.
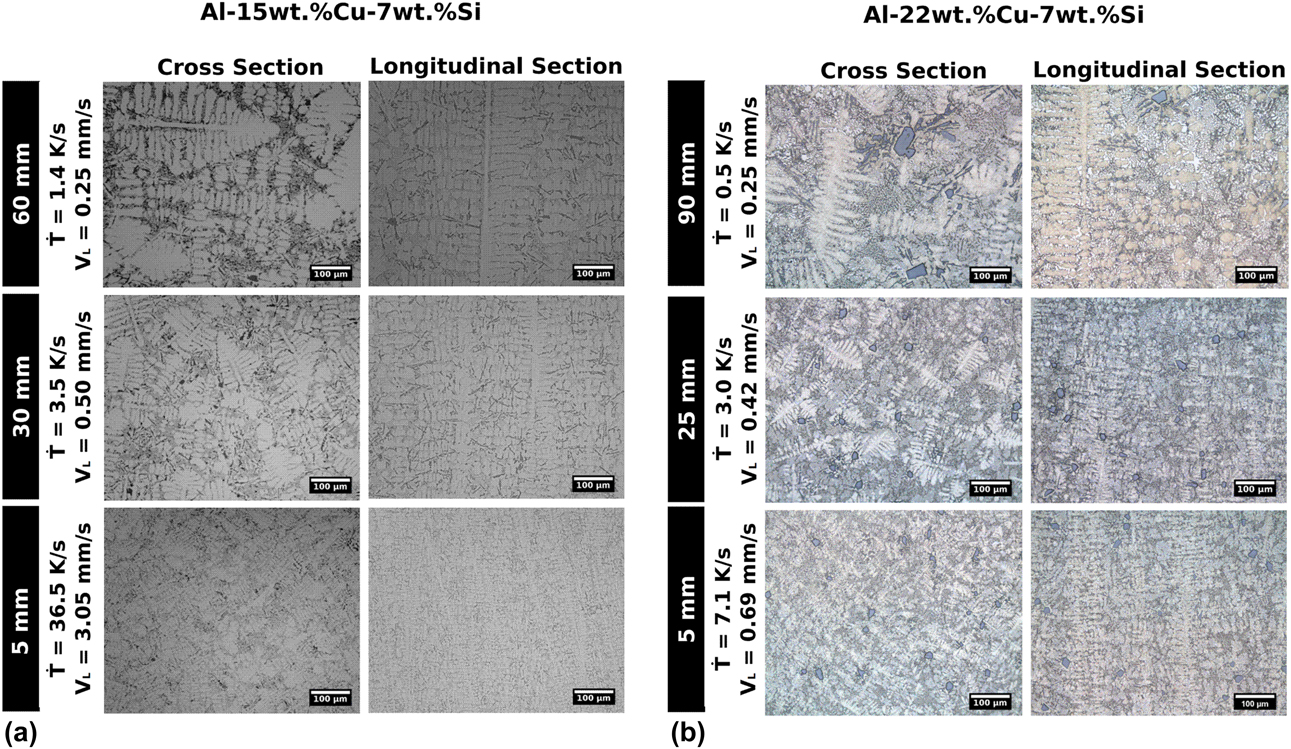
Growth of columnar grains predominated in both alloys. In order to give an idea of the microstructural evolutions, Figs. 2(a) and 2(b) show a collection of cross and longitudinal microstructures associated with very distinct regions across the directionally solidified castings. The relative positions as well as cooling rates and growth rates are specified in Figs. 2(a) and 2(b). The microstructures of both Al–15 wt% and Al–22 wt% Cu–7 wt% Si alloys consist of an α-Al dendritic matrix surrounded by the eutectic mixtures.
Representative optical microstructures from the cooled bottom to the top of the (a) Al–15 wt% Cu–7 wt% Si and (b) Al–22 wt% Cu–7 wt% Si alloy castings.

The dimensions of the dendrites clearly increase for positions farther from the bottom of the casting. This is well known to be related to the deceleration of solidification in upper positions due to the increase in thermal resistances generated as solid thickness increases from the bottom. As a consequence, both V L and  $\dot T_{\rm{L}}$ tend to decrease, resulting in larger structures in size. This is demonstrated in the experimental evolutions of V L and
 $\dot T_{\rm{L}}$, as shown in Fig. 1.
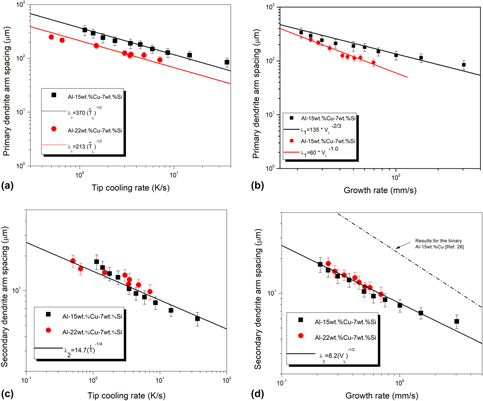
The experimental scatters of the primary (λ1) and secondary (λ2) dendritic spacings are shown in Fig. 3. Experimental data fittings resulted in power functions, which are able to represent the experimental scatters of each alloy. It can be inferred that the 47% increase in the Cu alloying (from 15 to 22 wt%) had a significant impact on λ1, whereas λ2 remained unaffected by the Cu alloying. As such, single λ2 ×  $\dot T_{\rm{L}}$ and λ2 × V L power functions representing both Al alloys are shown in Figs. 3(c) and 3(d), respectively.
Microstructural spacing evolutions of the Al–15 wt% Cu–7 wt% Si and Al–22 wt% Cu–7 wt% Si alloys: (a) λ1 versus cooling rate; (b) λ1 versus growth rate; (c) λ2 versus cooling rate, and (d) λ2 versus growth rate.

The representative exponents of each microstructural parameter were preserved regardless of the considered alloy. The −1/2 power laws characterize the experimental variations in λ2 with V L as well as those in λ1 with  $\dot T_{\rm{L}}$.
For comparison purposes, a growth law determined for hypoeutectic Al–15 wt% Cu alloy in a previous article [Reference Quaresma, Santos and Garcia26] has also been included in Fig. 3(d). It can be seen that a much lower λ2 spacing characterizes the Al–15 wt% Cu–7 wt% Si alloy of the present study as compared with that of the binary alloy. This decrease in the size of the λ2 of the Si-containing alloy appears to be correlated with a more enriched liquid in solute circulating in between the primary dendrite trunks grown in Al–Cu–Si alloy.
According to Mondolfo [Reference Mondolfo27], the higher the Si:Cu ratio, the smaller the λ2 at any given total Al–Cu–Si alloy content. Si:Cu ratios of about 0.47 and 0.32 characterize the examined Al–15 wt% Cu–7 wt% Si and Al–22 wt% Cu–7 wt% Si alloys, respectively. In view of such proportions, very similar secondary dendrite arm spacings can be noted if a same growth velocity or cooling rate is considered. As such, the current results under transient conditions for the Si:Cu alloying proportions of 0.47 and 0.32 do not match with previous results.
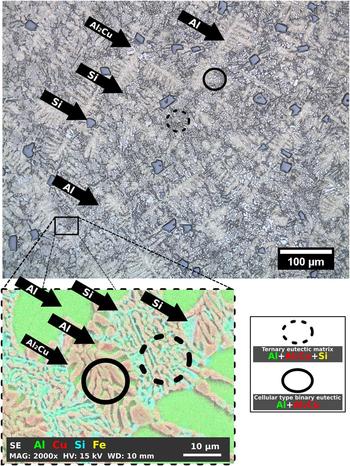
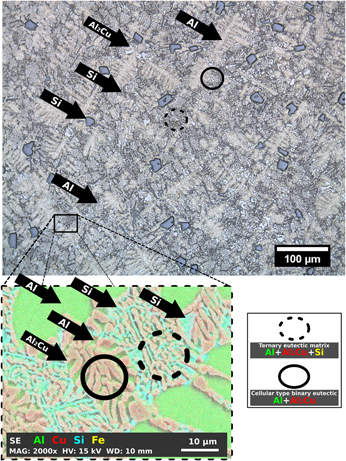
Figure 4 shows the optical image together with the scanning electron microscope–energy-dispersive X-ray spectrometer (SEM-EDS, Philips, Amsterdam, Netherlands) color map, showing the features characterizing the Al–22 wt% Cu–7 wt% Si alloy directionally solidified. The phases constituting the microstructures are indicated by arrows. Surprisingly for this composition, primary Si particles appeared embedded within the α-Al matrix, as observed by Liao and co-authors [Reference Liao, Zhang, Bi, Ding, Xi and Wu28] and Tiedje and co-authors [Reference Tiedje, Taylor and Easton29]. Such spots appear to be a consequence of the accumulation of Si during the initial fast growth of α-Al dendrites. Most of the microstructures can be identified as being a hypoeutectic-like structure formed by α-Al dendrites, embedded in the bimodal eutectic structure. The inset SEM-EDS image in Fig. 4 confirmed such character of the eutectic, which can be classified in two constituents: an α-Al + Al2Cu cellular-type binary eutectic and an ultrafine α-Al + Al2Cu + Si ternary eutectic matrix. It can be noted that the coarse eutectic colonies (cells) appeared surrounded by the fine eutectic matrix structure as reported for the suction cast Al81Cu13Si6 alloy (at.%) [Reference Kim, Lee, Hong, Park, Park, Lee, Seo, Wang, Park and Kim18]. There is no clear presence of the binary α-Al + Si eutectic.
Optical micrograph emphasizing the distinct types of eutectic as well as the components constituting such structures for the Al–22 wt% Cu–7 wt% Si alloy as diagrammed through SEM-EDS color maps at the bottom image.

The presence of composite-type unique microstructures as those observed at this point has already been reported elsewhere [Reference Park, Mattern, Kühn, Eckert, Kim, Kim, Chattopadhyay and Kim4, Reference Lee, Kim, Hong, Park, Park, Lee, Seo, Suh, Eckert, Kim, Park and Kim30, Reference Park, Kim, Kim, Mattern, Li, Liu and Eckert31]. It is claimed to be possible due to the high cooling rates and the composition undercooling effect provided by Si addition. Despite such possible reasons, the effects of cooling rate on the size and distribution of the bimodal eutectic composite remain undetermined.
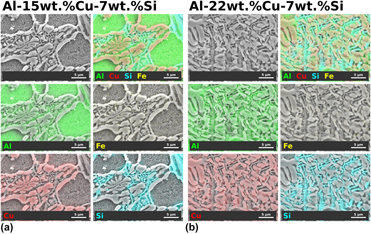
The microstructural features of the bimodal ultrafine eutectic composite constituting both Al alloys were extensively examined through the elemental SEM-EDS mapping, as shown in in Figs. 5(a) and 5(b). The final distribution of the elements can be seen within the phases and constituents.
Examples of SEM images in secondary electron signal of the (a) Al–15 wt% Cu–7 wt% Si and (b) Al–22 wt% Cu–7 wt% Si alloy samples: X-ray maps of different elements through EDS: Al-Kα, Fe-Kα, Si-Kα, and Cu Kα.

A recent investigation with the laser surface remelted Al81Cu13Si6 (at.%) alloy claimed that the ternary eutectic structure as well as the bimodal nature of the microstructure may be inhibited to form at cooling rates higher than 4 × 10⁴ K/s [Reference Ramakrishnan, Lei, Misra and Mazumder19]. In the present investigation, the entire lengths of both directional solidification (DS) castings were monitored to register the variations in phases, morphologies, and feature length scales. The existence of the fine ternary eutectic matrix was remarked in all examined specimens. This means that such structures may grow for cooling rates in between 0.5 and 37 K/s. As such, future directions for research on the low cooling rates associated with the beginning of the bimodal eutectic composite in Al–Cu–Si alloys appear to be necessary.
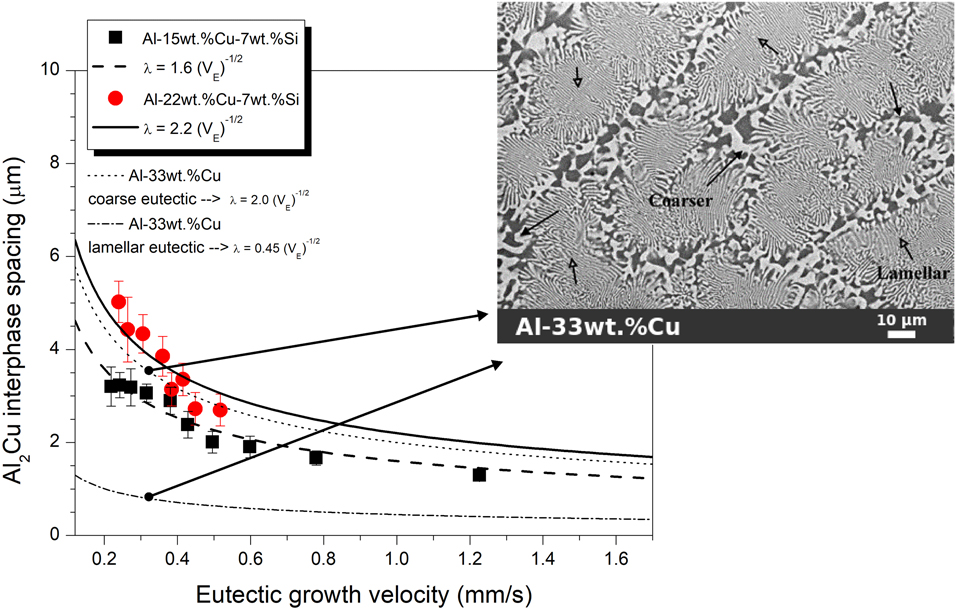
The fabrication of directionally solidified castings were planned to obtain microstructures with fine eutectic of different length scales. Figure 6 shows the variation in the Al2Cu interphase spacing, λ, with the eutectic growth velocity. The λ varied from 2.7 to 5.0 μm and from 1.3 to 3.2 μm for the Al–22 wt% Cu–7 wt% Si and Al–15 wt% Cu–7 wt% Si alloys, respectively. Both λ experimental variations with V obey the power growth law λ2V E = constant, as that proposed originally by Jackson and Hunt for the growth of regular eutectics [Reference Jackson and Hunt12], despite the non-regularity of the Al2Cu phase shown in the features in Figs. 4 and 5.
Experimental variations characterizing Al2Cu interphase spacing versus eutectic growth rate of the ternary DS Al–15 wt% Cu–7 wt% Si and Al–22 wt% Cu–7 wt% Si alloys.

In order to assess the effects of silicon and those related to the formation of bimodal (coarse-fine) composite on the interphase spacing, an extra DS casting was fabricated and investigated. For comparison purposes, the λ values along the directionally solidified Al–Cu eutectic alloy (33.0 wt% Cu) were measured. This allowed λ scaling laws of the Al2Cu eutectic phase to be fitted. As can be seen through the inset image in Fig. 6, a bimodal distribution of Al–Al2Cu occurred, that is, finer eutectic developed at the center zone of the cells and coarser eutectic at the boundaries. Two regions are clearly recognized: very thin lamellae in the center of the cells and random eutectic at the boundaries. The spacings between the Al2Cu were measured in both regions, resulting in two scaling laws introduced within the graph in Fig. 6: λ = 0.45V E−1/2 (dash-dotted line) and λ = 2.0V E−1/2 (dotted line). The morphology of the binary Al + Al2Cu eutectic formed in the coarse boundary of the cells resembles much that characterizing the ternary eutectic structure found in the Al–Cu–Si alloys. The analysis of the “multipliers” when comparing the three compositions (i.e., 33Cu: “2.0,” 22Cu–7Si: “2.2,” and 15Cu–7Si: “1.6”) allows affirming that close spacings of random nature can be obtained apart from the alloy composition. Diverging from that, much lower spacing characterizes the regular lamellar Al–Cu eutectic.
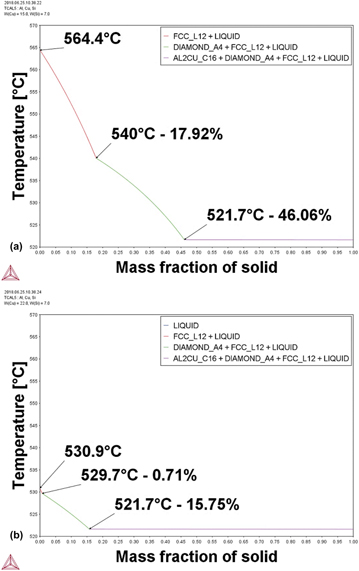
The solidification paths of the two Al alloys were determined by the use of computational thermodynamics software (Thermo-Calc Software, Solna, Sweden) as shown in Fig. 7. These calculations predicted the precipitation of Si occurring at 540 °C and at 529.7 °C for the Al–15 wt% Cu–7 wt% Si and Al–22 wt% Cu–7 wt% Si alloys, respectively. The ternary eutectic reaction occurs at 521.7 °C, whose product of the reaction is α-Al + Al2Cu + Si. According to these calculations, the solidification freezing intervals, ΔT, are 42.7 °C and 9.2 °C for the Al–15 wt% Cu–7 wt% Si and Al–22 wt% Cu–7 wt% Si alloys, respectively. It is well known that the secondary dendrite arm spacing in cast aluminum products increases with the increase in local solidification range [Reference Kurz and Fisher32, Reference Grugel, Lograsso and Hellawell33]. It appears that such very distinct solidification ranges could balance the effects of the different Si:Cu alloying ratios in λ2 [Reference Mondolfo27]. Despite the higher Si:Cu ratio of the Al–15 wt% Cu–7 wt% Si alloy, higher ΔT could induce coarsening of λ2 to the referred composition. Oppositely, lower Si:Cu ratio in combination with lower ΔT may result in similar λ2 for the Al–22 wt% Cu–7 wt% Si alloy if compared with that of the other alloy composition.
Plots of temperature as a function of solid fraction showing the precipitation of phases during solidification of the (a) Al -15 wt% Cu -7% Si and (b) Al -22 wt% Cu -7% Si alloys computed by the Thermo-Calc software.

The following sequence of precipitations is predicted in Fig. 7 for the ternary Al–15 wt% Cu–7 wt% Si alloy: 17.92% of solid fraction of α-Al formed from the open liquid; after that, the growth of the Si phase occurs until 46.06% of mass fraction of solid, and subsequently, a ternary eutectic reaction occurs at about 54% of mass fraction. On the other hand, the ternary Al–22 wt% Cu–7 wt% Si alloy corresponds to 0.71% of solid fraction of α-Al formed from the open liquid; after that, the growth of the Si phase occurs until 15.75% of mass fraction of solid, and finally, a ternary eutectic reaction encompasses of about 84% of mass fraction.
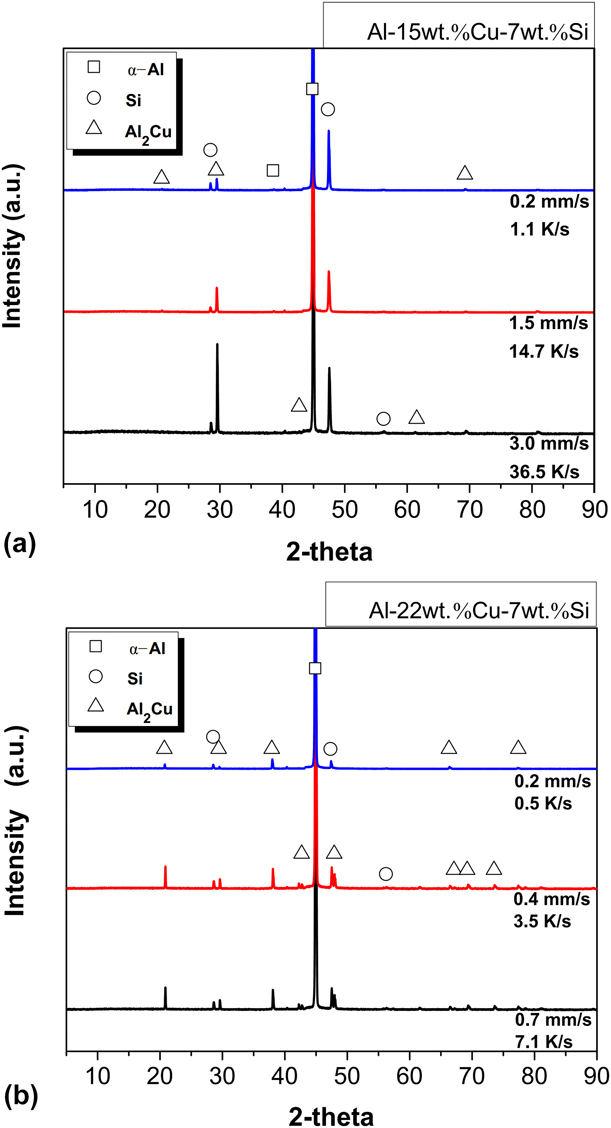
The phases predicted by the thermodynamic software are consistent with those indexed for the directionally solidified alloy samples through the X-ray diffraction (XRD) patterns, as shown in Fig. 8.
XRD patterns for three distinct positions (P) along the length of the directionally solidified castings: (a) Al–15 wt% Cu–7 wt% Si and (b) Al–22 wt% Cu–7 wt% Si alloys.

Figure 8 shows the representative XRD patterns corresponding to different cooling rates of samples along the length of the castings. The peaks consist of three different phases, which are α-Al, Al2Cu, and Si. According to Kim et al. [Reference Kim, Lee, Hong, Park, Park, Lee, Seo, Wang, Park and Kim18], slight differences in the intensity of the XRD peaks can be associated with the differences in volume fractions of the constituent phases. In other words, more intense Al2Cu and Si XRD peaks occur for the higher cooling rate samples. It can be inferred that higher cooling rates may result in increase in volume fraction of the ternary eutectic. It is possible to refine the microstructure and increase the fraction of fine eutectic concurrently for the evaluated Al alloys under the operated cooling regime of solidification.
In 1950s, the strength of materials was recognized to be affected by the effects of size. Such effects may be summarized as “smaller is stronger.” It was demonstrated that the strength of steel increases when the grain size is smaller [Reference Hall34]. Such knowledge has been consolidated for decades. The well-known Hall–Petch relationships have been established so far. This is even more notable for wrought alloys, in which the effect of grain size is (in most of the cases) only considered. However, for the case of as-cast alloys, the grain size from solidification operations has almost no effect on the mechanical properties of Al-based alloys. Ghassemali et al. [Reference Ghassemali, Riestra, Bogdanoff, Kumar and Seifeddine35] proved that secondary dendritic spacing measurements of the Al–10 wt% Si base alloy were in consistency with the Hall–Petch equation. On the other hand, they showed that the grain size did not demonstrate a physically meaningful relationship with the flow stress of the alloy. Such statements were possible thanks to the observations provided from an in situ tensile test in an SEM.
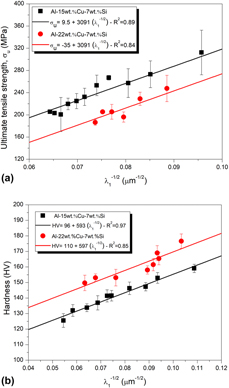
The variations in the experimental tensile strength (ultimate tensile strength, σu) and hardness (Vickers hardness, HV) against the primary dendritic spacing of both Al alloys are shown in Fig. 9. Both Al–(x)wt% Cu–7 wt% Si alloy specimens demonstrated low tensile ductility, less than 1%. Hall–Petch-type experimental expressions were enough to represent the experimental scatters as proposed in Fig. 9.
(a) Tensile strength and (b) Vickers hardness changes as a function of the primary dendrite arm spacing, λ1, for the Al–(x)Cu–7% Si alloys. R2 is the coefficient of determination.

The microstructure of the Al–22 wt% Cu–7 wt% Si alloy is constituted basically by larger amount of the fine-scale eutectic composite (i.e., α-Al + Si + Al2Cu) than that of the Al–15 wt% Cu–7 wt% Si alloy. This explains the lower σu of the Al–22 wt% Cu–7 wt% Si alloy induced by the increase in the stress concentration around sharp structures formed by fragile phases within the eutectic. Due to the higher eutectic fraction, the specimens of the higher Cu content Al alloy failed under lower ultimate stresses. For both alloys, σu increases with decreasing λ1 along the length of the DS Al alloy castings [see Fig. 9(a)]. This is because lower spacings contribute to a more extensive distribution of second phases, which benefits the alloy strength.
The mean diagonal lengths of the Vickers indentations resulted in ranges from 76.2 to 85.8 μm and from 72.4 to 78.6 μm for the Al–15 wt% Cu–7 wt% Si and Al–22 wt% Cu–7 wt% Si alloys, respectively, when applied a load of 0.50 kgf.
The variations in λ1 were also shown to be important to shift the hardness [see Fig. 9(b)]. Vickers hardness is associated with the application of lower stresses as compared with σu. In this case, only beginning of plastic deformation is achieved under compressive load. Differently from the tendency observed for σu, hardness results show that the higher the Cu content, the higher the hardness will be. This can be explained by the same aforementioned reason. The higher the alloy Cu content, higher proportions of fine-scale three-phase eutectic mixture will be developed as compared with those related to the Al–15 wt% Cu–7 wt% Si alloy. Based on the nanoindentation experiment results of intermetallic phases, Chen and co-authors [Reference Chen, West and Thomson36] found that the three-phase hardnesses of silicon, Al2Cu, and α-Al are 11.13 GPa, 5.77 GPa, and 1.45 GPa, respectively. This explains the higher hardnesses characterizing the Al–22 wt% Cu–7 wt% Si alloy.
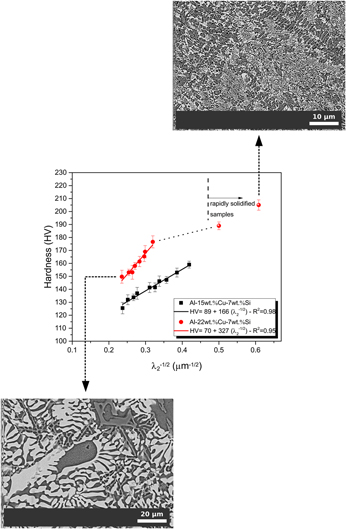
Secondary dendrite arm spacings, λ2, with cooling rate were analyzed for the RS Al–22 wt% Cu–7 wt% Si alloy samples and compared with results obtained for the DS as-cast samples. Cooling rates corresponding to the investigated RS samples have been estimated using the relationship, λ2 = 14.7 $\dot T_{\rm{L}}$−1/4, established between the secondary dendritic spacing and the cooling rate (
 $\dot T_{\rm{L}}$) for the DS as-cast sample [see Fig. 3(c)].
The right side of the graph in Fig. 10 gives a summary of the λ2 and hardness values of the rapidly solidified samples under investigation in comparison with those typifying the DS samples. The estimated cooling rates were 75.4 and 245.2 K/s. Due to the prevalence of fine cellular-type binary eutectic colonies (α-Al + Al2Cu) dispersed within a very fine ternary eutectic matrix (α-Al + Al2Cu + Si), remarkable high hardness was quantified, achieving a value larger than 200 HV.
Plots of HV × λ2−1/2 showing the insertion of hardnesses obtained for the RS Al–22 wt% Cu–7 wt% Si alloy samples. Inset: SEM microstructures related to both DS and RS alloy castings.

Conclusions
The following points can be raised as conclusions:
(1) The microstructures of DS and RS Al–Cu–Si alloys were constituted by α-Al dendritic matrix surrounded by the eutectic mixture. Two constituents composed the interdendritic regions: α-Al + Al2Cu cellular-type binary eutectic colonies and an α-Al + Al2Cu + Si ternary eutectic matrix.
(2) Such unique composite microstructure prevailed for samples related to a broad cooling rate ranging from 0.5 to 250 K/s.
(3) The scaling laws demonstrated that there is a decrease in primary dendritic spacing with increasing Cu content (from 15 wt% to 22 wt% of Cu). However, single trends of correlation between secondary dendritic spacing and growth velocity as well as between secondary dendritic spacing and tip cooling rate could be noted.
(4) Both λ experimental variations with V E obey the classic eutectic law λ2V E. A degenerated distribution of the α-Al + Al2Cu + Si phases characterized the ternary eutectic matrix of the ternary Al alloys.
(5) The use of a thermodynamic software permitted to find changes in the course of the solidification depending on the degree of the Cu-alloying element and, consequently, to trace the influence of the proportions of phases and constituents on the mechanical properties.
(6) The increase in the concentration of fragile phase fraction in the Al–22 wt% Cu–7 wt% Si alloy induced stress concentration around sharp structures, reducing the tensile strength. Hardness results showed that the higher the Cu content, the higher the hardness will be.
(7) Tensile strength was observed to be determined in the imminent crack onset, and hence, it is governed by fracture mechanisms, which are influenced by the presence of sharp structures. Hardness tests, in their turn, are conducted under compressive loading, avoiding cracks.
Experimental procedure
Solidification under fast and slow cooling regimes
The Al–15 wt% Cu–7 wt% Si and Al–22 wt% Cu–7 wt% Si alloy castings were generated using a transient DS system. A quantity of 1400 g of commercial purity Al, Si, and Cu elements was first melted in a silicon carbide with a layer of Y2O3 crucible by induction heating up to 750 °C. Such temperature level permits not only melting the Al but also homogenize the other elements by diffusion. Then, the temperature was brought down to 700 °C and held for 30 min before the DS procedure, which envisage a standardized melt superheat to be attained. This solidification setup typically allows ranges of cooling rates in the order of 10−1 to 101 K/s. Such spectrum may be framed within the slow to intermediate cooling regime of solidification. A detailed description of the transient DS system is given in previous investigations using equivalent systems [Reference Silva, da Silva, Garcia and Spinelli21, Reference Bertelli, Freitas, Cheung, Arenas, Conde, de Damborenea and Garcia22].
An induction furnace was employed for melting procedures of the alloys. After that, a molten alloy was poured into two separated cavities. One of them was used to assess the transformation temperatures by the cooling curves. While the other, which is a cylindrical stainless steel split mold placed inside the solidification system, permitted to assess the thermal profiles. Inside the solidification system, the alloy was remelted by using heat sources from a radial electrical wiring. When the melt temperature achieved 10% above the liquidus temperature, the furnace windings were disconnected and the same time the external water flow at the bottom of the container was initiated to begin the cooling down procedure, thus permitting the onset of solidification.
The temperature of the DS system is monitored by several fine K-type thermocouples (1.6 mm diameter) along the length of the casting. In the case of the present experiments, the thermocouples were strategically spaced between each other in order to acquire thermal data from the cooled bottom toward the top of the casting. The frequency of temperature data acquisition was 1 Hz on each thermocouple.
In order to provide rapidly solidified samples, the Al–22 wt% Cu–7 wt% Si alloy was solidified in a stepped copper mold using centrifugal casting. This kind of process with a cooling rate typically greater than 102 K/s can be considered as RS one [Reference Liebermann23]. Rods having 5 and 9 mm of diameter with 8 mm of length each were fabricated. The alloy was melted in situ and the heating system had its power controlled in order to achieve a desired melting temperature at which the heating system is turned off and the mold rotates, permitting the molten alloy to cool down by the mold surface.
Microstructural characterization and tensile tests
As mentioned before, transformation temperatures, such as liquidus and eutectic temperatures, were determined for the evaluated Al alloys. This was possible through experiments in which an alloy was slowly cooled in a well-insulated crucible, thus permitting the reactions to occur under equilibrium. Finally, the indications of the temperatures of interest could be noted in the cooled curves.
The macrostructure of each DS casting was revealed after assessing and grinding the whole longitudinal middle section surface with #600 grid paper. The etching solution was Keller’s reagent, composed by 95 mL of distilled water, 2.5 mL of HNO3, 1.5 mL of HCl, and 1 mL of HF, which was applied for 20 s.
The DS samples were examined in two distinct sections from the microstructural point of view: longitudinal and transversal. This is essential, so that a complete examination of the morphologies characterizing the dendritic array could be performed in various positions from the cooled bottom of the castings.
For metallographic examination, the samples were polished and etched with a solution of 1% HF in water during 20 s and then examined using an optical microscope. The length scale of the dendritic matrix was characterized by the primary (λ1) and secondary (λ2) dendrite arm spacings. One hundred measurements were performed for a certain microstructural spacing related to each selected position of an alloy composition. A considerable number of measurements are essential to guarantee representative average and standard deviation of λ on each sample. Later, such spacing will be correlated with the solidification thermal parameters, such as the cooling rate and the growth velocity. The scaling law derived for the secondary dendritic spacing shifting with cooling rate will be used to estimate the cooling rates of the RS Al–22 wt% Cu–7 wt% Si alloy samples. For this purpose, measurements of the λ2 were also performed in the RS samples.
Highly magnified microstructures were assessed through an SEM. Back-scattered electron and secondary electron modes of operation were carried on deep etched samples (1% HF in water during 6 min). Features such as binary and ternary eutectics and eutectic colonies could be deeply observed in various DS samples. The instrument used for that was a Philips SEM (XL-30 FEG, Philips, Amsterdam, Netherlands) equipped with an EDS. SEM and optical images were examined permitting measurements of the spacings between the Al2Cu particles, λ. The intercept mode of spacing was employed here [Reference Gündüz and Çadırlı24, Reference Çadırlı, Büyük, Engin and Kaya25]. Approximately, ninety λ values were measured for each position along the length of the DS castings, so that average and standard deviation values could be established.
In order to attain mechanical properties such as strain to failure, δ, and ultimate tensile strength, σu, of the Al–15 wt% Cu–7 wt% Si and Al–22 wt% Cu–7 wt% Si alloys, several specimens were extracted along the length of the DS alloy castings. Each specific position chosen for tensile tests allowed four specimens to be extracted, so that average mechanical properties regarding strength and ductility and their standard deviations could be determined. These specimens were subjected to tensile tests according to specifications of the ASTM Standard E 8M/04 at a strain rate of about 3 × 10⁻³ s−1. Hardness tests were performed on the transversal sections of the DS samples using a test load of 500 gf and a count time of 15 s. Care has been put on the hardness tests in order to ensure that the impression was large enough to involve all the microconstituents, so that a response of the whole microstructure could be obtained. The adopted Vickers microhardness was the average of at least 15 indentation tests on each sample. The same procedure for hardness was performed in the RS Al–22 wt% Cu–7 wt% Si alloy samples for comparison purposes with the hardnesses found for the DS samples.
XRD analysis was carried out to identify the formed phases, using a Siemens D5000 diffractometer (Siemens, Munich, Germany), within an angular range varying from 5° to 90° (2θ) with a step size of 0.02° and a count time of 0.25 s per step. The radiation was Cu Kα with a wavelength of 1.5406 Å.
Data availability
The raw/processed data required to reproduce these findings cannot be shared at this time as the data also form part of an ongoing study.
Acknowledgments
The authors wish to acknowledge funding for this work from the São Paulo Research Foundation, Brazil (FAPESP: Grant 2017/12741-6), and the National Council for Scientific and Technological Development, Brazil (CNPq). The authors thank the Laboratory of Structural Characterization (LCE/DEMa/UFSCar) for the general facilities.