Introduction
Historical lime mortars are an essential source of knowledge on original construction technologies and materials. They have great potential to be used in distinguishing the chronology of building construction phases. To explore this in practice, research was conducted that combined radiocarbon dating of mortar binders with their characterization, as well as archaeological and building history surveys.
The radiocarbon dating of historical lime mortars has been extensively studied and discussed in recent research (e.g., Baxter and Walton Reference Baxter and Walton1970; Daugbjerg et al. Reference Daugbjerg, Lindroos, Heinemeier, Ringbom, Barrett, Michalska, Hajdas, Raja and Olsen2021; Hajdas et al. Reference Hajdas, Maurer and Belen2020; Labeyrie and Delibrias Reference Labeyrie and Delibrias1964; Lindroos et al. Reference Lindroos, Ringbom, Heinemeier, Hodgins, Sonck-Koota, Sjöberg, Lancaster, Kaisti, Brock and Ranta2018; Stuiver and Smith Reference Stuiver, Smith, Olson and Chatters1965). Several published studies have demonstrated that lime mortars can be used to establish an absolute chronology and thus provide information on a structure’s construction history (Addis et al. Reference Addis, Secco, Marzaioli, Artioli, Arnau, Passariello, Terrasi and Brogiolo2019; Caroselli et al. Reference Caroselli, Hajdas and Cassitti2020, Reference Caroselli, Hajdas and Cassitti2023; Hajdas et al. Reference Hajdas, Trumm, Bonani, Biechele, Maurer and Wacker2012; Heinemeier et al. Reference Heinemeier, Ringbom, Lindroos and Sveinbjörnsdóttir2010; Nawrocka et al. Reference Nawrocka, Czernik and Goslar2009; Ortega et al. Reference Ortega, Zuluaga, Alonso-Olazabal, Insausti, Murelaga, Ibañez and Nawrocka2012; Ringbom et al. Reference Ringbom, Lindroos, Heinemeier and Sonck-Koota2014; Van Strydonck Reference Van Strydonck2016).
The production, processing, use, hardening, weathering, and ageing of lime binder are important factors that influence the successful application of radiocarbon dating in establishing absolute chronology (Válek et al. Reference Válek, Kozlovcev, Fialová, Kotková, Frankeová, Světlík and Pachnerová Brabcová2023). Lime is produced by burning limestone, an endothermic reaction in which calcium carbonate decomposes to calcium oxide (quicklime) while carbon dioxide is released into the atmosphere. Quicklime disintegrates into a fine powder (ranging approximately from 1 to 200 µm and larger) through an exothermic reaction with water, forming calcium hydroxide particles (Oates Reference Oates1998). This powder is mixed with an aggregate, typically sand, and water to form a plastic mortar which subsequently hardens through carbonation. It is the reaction of the lime (calcium hydroxide) with atmospheric CO2 that carries the 14C dating signature (Baxter and Walton Reference Baxter and Walton1970). Carbonated lime binder (calcium carbonate) is slightly soluble in water (acidic water enhances its solubility) and thus carbon isotopes exchange may occur during ageing (Cizer Reference Cizer, Rodriguez-Navarro, Ruiz-Agudo, Elsen, van Gemert and van Balen2012). Lime produced from impure raw materials contains other mineral phases that react with water (hydrate) and also carbonate over the long term (Frankeová and Koudelková Reference Frankeová and Koudelková2020). Added aggregates and admixtures can be of a carbonate type or can contain layered double hydroxides containing geogenic CO2, which affects the dating signature (Urbanová et al. Reference Urbanová, Boaretto and Artioli2020).
Therefore, the accuracy of radiocarbon age determination is influenced by a number of factors described in the literature (Hajdas et al. Reference Hajdas, Lindroos and Heinemeier2017). In reality, contaminants can lead to either the ageing or rejuvenation of dated mortars (Lindroos et al. Reference Lindroos, Heinemeier, Ringbom, Braskèn and Sveinbjörnsdóttir2007; Ponce-Antón et al. Reference Ponce-Antón, Ortega, Zuluaga, Alonso-Olazabal and Solaun2018). These dating obstacles are well known, and to ensure conclusive results the current research focuses on samples pretreatment and the analysis of separate fractions of carbon dioxide extracted from the samples (Barrett et al. Reference Barrett, Keaveney, Lindroos, Donnelly, Daugbjerg, Ringbom, Olsen and Reimer2021; Hayen et al. Reference Hayen, Van Strydonck, Boaretto, Lindroos, Heinemeier, Ringbom, Hueglin, Michalska, Hajdas, Marzaioli, Maspero, Galli, Artioli, Moreau, Guibert and Caroselli2016, Reference Hayen, Van Strydonck, Fontaine, Boudin, Lindroos, Heinemeier, Ringbom, Michalska, Hajdas, Hueglin, Marzaioli, Terrasi, Passariello, Capano, Maspero, Panzeri, Galli, Artioli, Addis, Secco, Boaretto, Moreau, Guilbert, Urbanova, Czernik, Goslar and Caroselli2017; Michalska Reference Michalska2019). It is of utmost importance to exclude material containing geogenic carbon from the dated material. Three approaches are practised: (i) the analysis of multiple CO2 fractions collected during the sequential dissolution of mortar powder (typically four or more fractions) (Hajdas et al. Reference Hajdas, Maurer and Belen2020); (ii) the analysis of a single batch of CO2 obtained from the dissolution of a carbonate binder fraction that was previously purified by physical separation (Addis et al. Reference Addis, Secco, Marzaioli, Artioli, Arnau, Passariello, Terrasi and Brogiolo2019; Ricci et al. Reference Ricci, Secco, Addis, Pistilli, Preto, Brogiolo, Arnau, Marzaioli, Passariello and Terrasi2022). In both cases, a concentrated acid is used to dissolve the CO2 from the binder. Another applicable method (iii) is the sequential thermal decomposition of the mortar sample (Barrett et al. Reference Barrett, Keaveney, Lindroos, Donnelly, Daugbjerg, Ringbom, Olsen and Reimer2021, Reference Barrett, Allen, Reimer, Ringbom, Olsen and Lindroos2023).
The aim of the research was to apply the second approach mentioned above in a real archaeological context. To verify its applicability, the validity of the radiocarbon dating was assessed by characterizing the mortars and purified binders using cathodoluminescence and polarized light microscopy. Cathodoluminescence can identify natural carbonates and unburnt particles in a binder and is considered suitable for distinguishing the presence of limestone in a historic binder (Toffolo et al. Reference Toffolo, Ricci, Caneve and Kaplan-Ashiri2019). In combination with image analysis, the amount of geogenic contaminants can be quantified by defining the color spectral range and thus linked to the validity of the radiocarbon dates (Válek et al. Reference Válek, Kozlovcev, Fialová, Kotková, Frankeová, Světlík and Pachnerová Brabcová2023). Petrographic characterization of mortars is important for evaluating the suitability of mortar samples for dating, as it can determine the presence of possible contaminants, as well as contribute to understanding different building phases (Caroselli et al. Reference Caroselli, Hajdas and Cassitti2023; Secco et al. Reference Secco, Dilaria, Addis, Gonetto, Artioli and Salvadori2018). The results of the sample analyses are then used to compare and correlate the chronology of the construction phases determined by in situ surveys.
Archaeology and building history of the St. Peter and Paul Rotunda at Budeč—state of art
The St. Peter and Paul rotunda is situated in the fortified center of the Budeč stronghold. The site is located about 20 km northwest of Prague. From the late 9th to the 12th centuries, it belonged to the most significant centers of the Přemyslid state. The founding of the rotunda is mentioned in the legends of St. Wenceslas from the 10th century. According to these sources, the Church of St. Peter in Budeč was founded by Prince Spytihnev (894–915 AD; Emler Reference Emler1873, 28–29, 183, 148; Hýbl Reference Hýbl1905; Vajs Reference Vajs1929, 89).
For a long time, it was not clear whether the rotunda, which still stands today, is identical to the church mentioned in the legends, or whether it is a younger structure built on the site of an older predecessor. Today, based on building history surveys and archaeological excavations carried out since the end of the 19th century, most researchers agree that the main nave of the rotunda, from the foundations to the dome, is an original building from the turn of the 9th–10th century and corresponds to the building mentioned in the St. Wenceslas legends (Herain Reference Herain1905; Líbal Reference Líbal1981; Macek Reference Macek1992; Šolle Reference Šolle1990). A horseshoe-shaped apse was originally attached to the nave on the east. The remains of the apse were uncovered by archaeological research and are still preserved under the floor of the present presbytery and are accessible through an open archaeological probe from 1978.
The building history surveys suggest, based on formal analysis, that around the middle of the 12th century, a Romanesque three-story tower was added to the nave from the north. The second and third floors of the tower show the use of different building materials: while the ground floor and the first floor are made of carefully worked sandstone blocks, lower-quality and roughly worked sandstone was used for the construction of the second and third floors. This led to the hypothesis that either the tower was built in two phases or that the upper two floors were rebuilt during the tower’s existence. The construction of a Romanesque tribune is implied by an archaeological discovery of limestone blockwork beneath the current choir loft and by uncovering a walled entrance to the raised floor of the western part of the rotunda.
Further extensive building modifications took place in the Baroque period. Probably around 1663, the nave walls were locally repaired, and a rectangular presbytery and a sacristy were added to the north of it. The chancel was added in 1775. Later, between 1835 and 1853, the roof was completely repaired, including the installation of a new roof truss; also, additional walling and repairs were made to the nave shell (Líbal Reference Líbal1981; Macek Reference Macek1992; Šolle Reference Šolle1990; Wirth Reference Wirth1919).
The last major structural alterations occurred in the early 1990s and were related to repairs following intensive archaeological excavations in the late 1970s, which affected the entire interior. The roof was completely repaired in 2007.
Materials and methods
The choice of mortar samples was based on the established knowledge of the construction history of the rotunda. The samples were collected for the following purposes:
-
• to verify the dating of the supposedly original pre-Romanesque parts of the rotunda to the 9th/10th century: foundations of the original eastern apse accessible through an open archaeological probe from 1978 (samples no. 02, 11, 13, 14), above-ground masonry of the main nave (sample no. 01), and the vaulted dome (samples no. 03, 09, 15);
-
• to verify the dating of the Romanesque tower to the mid-12th century, confirm/ refute the distinct construction phases of the upper floors (samples no. 05, 06, 08), and confirm/refute the existence of the Romanesque tribune by dating the breaking of the entrance through the perimeter wall to the choir loft (sample no. 07).
Sample no. 12 was taken from the masonry of the nave on the level of the choir loft, from the position where the floor of the choir loft was connected to the nave. The sample appeared macroscopically different from the other samples: it had a homogenous and porous structure, contained a coarser aggregate, and was richer in the aggregate.
Denomination and description of samples including type of mortar and probable exposure conditions. Expected chronology at the time of sampling is given. Applied analyses: 14C = radiocarbon dating, PLM = polarized light microscopy

Table 1 Long description
The table presents detailed information about mortar samples taken from various parts of the Rotunda. It includes the type of mortar, probable exposure conditions, and the expected chronology at the time of sampling. The table is organized into several rows and columns, with each row representing a different sample and each column providing specific details about that sample. The columns include the sample ID, a description of the mortar, the exposure to water conditions, the probable period it belongs to, and the analyses applied, such as radiocarbon dating (14C) and polarized light microscopy (PLM). Notable samples include those from the foundations of the eastern apse, the nave-aboveground masonry, the dome, and the tower. Each sample's exposure to water is categorized as medium, low, or very low, with additional notes on specific conditions like seasonal elevation of moisture levels, rising dampness, and possible leakage. The expected chronology ranges from pre-Romanesque to Baroque periods, with some samples dated to specific historical figures like Prince Spytihnev.
The mortar samples were photographically documented at the sampling location and in the laboratory. Soiled and dirty parts were removed. Clean samples were split into two parts: one part of the sample was used to produce a thin-section and then characterized by polarized light microscopy and cathodoluminescence, while the other part was treated to obtain purified portions of the binder that was used for the radiocarbon analysis. Prior to radiocarbon analysis, the purified binder was assessed by cathodoluminescence. In two cases, a piece of charcoal embedded in the mortar was found. These charcoals were labeled MBU 9C and MBU 15C and radiocarbon dated.
Polarized light microscopy (PLM)
Polished thin-sections, prepared from the collected samples, were characterized using an Olympus BX53M optical microscope with an Olympus DP27 digital camera. Characterization was carried out to group the mortars according to their similarities (composition and structure), and to evaluate the potential presence of radiocarbon dating contaminants. The selected areas were cross-examined by cathodoluminescence.
Scanning electron microscopy (SEM-EDS)
Scanning electron microscopy (SEM) was performed on selected samples by means of a Tescan MIRA II LMU instrument, with an energy dispersive analytical system (EDS) from Bruker AXS. The EDS measuring conditions were as follows: carbon coated polished surface, accelerating voltage of electrons 15 kV, probe current 1.
Pretreatment
The sample pretreatment methodology was adapted from previously used procedures (Addis et al. Reference Addis, Secco, Marzaioli, Artioli, Arnau, Passariello, Terrasi and Brogiolo2019; Ponce-Antón et al. Reference Ponce-Antón, Ortega, Zuluaga, Alonso-Olazabal and Solaun2018; Ricci et al. Reference Toffolo, Ricci, Caneve and Kaplan-Ashiri2019). The mortar samples were cleaned and carefully crushed, then washed with a defluctuant solution (sodium hexametaphosphate) and placed in an ultrasonic bath (20 min). The suspension obtained was allowed to sediment in 500- mL graduated cylinders, and after 24 hr a top 100 mL portion of the purified binder was pipetted and labeled as the first portion (FP), the 100 mL portion below the FP was pipetted and labeled as the second portion (SP). FP was filtered using a 0.1 μm permeability membrane filter Whatman Nuclepore™ 0.10 µm, SP was sedimented in a centrifuge. In both cases, the purified binder was subsequently dried in an oven at 60°C and prepared for further analysis. Ultrapure water and methanol were used throughout the process, minimizing the possibility of contamination by airborne CO2 and other carbon sources.
Cathodoluminescence (CL)
Samples for CL observation were prepared as follows: FP and SP were first crushed in an agate bowl; subsequently, 0.1 g of material was weighed and evenly imposed onto a standard thin-section glass. Through this process, a uniform layer of material was obtained. The samples were observed using an Olympus BX53M conventional optical/polarizing microscope coupled with a “cold” cathode CITL type CCI 8200 Mk4. The measurement conditions were as follows: beam current 250 lA, electron energy 14–16 kV. Images were taken using a DP74 digital camera with exposure time set to 30 s.
Quantitative phase analysis (QPA) of luminescent particles was performed using Stream Essentials Olympus software. It was based on the detection of RGB spectra of the acquired image and concerned bright luminescent particles with the red compound from 150 to 256 (RGB: R=150-256; G=0; B=0). The result is the surface fraction (xs) of the luminescent particle area in the total imaging area (microscope field of view) calculated as the average of five different images. Some images had the whole background luminescing containing red compound from 20 to 150 (RGB: R=20-150; G=0; B=0). The background had various intensity and was not included in the quantification.
Radiocarbon analysis by AMS
The pretreated FP of mortar samples (about 5 mg) were digested by exposure to concentrated H3PO4 in an evacuated glass reactor with a volume of approximately 6 mL. Charcoals were pretreated according to the acid-base-acid protocol (Pachnerová Brabcová et al. Reference Pachnerová Brabcová, Kundrát and Krofta2023). The resulting CO2 was cryogenically isolated and reduced to graphite with Zn and Fe as catalysts (Orsowszki and Rinyu Reference Orsowszki and Rinyu2015). The graphite samples were pressed into aluminum cathodes and measured with the accelerator mass spectrometry (AMS) system MILEA at the Nuclear Physics Institute of the CAS (lab code CRL) together with radiocarbon Standard Reference Material (oxalic acid II, NIST SRM 4990C) and blank material (anhydride of phthalic acid). The AMS data were processed with BATS software (Wacker et al. Reference Wacker, Christl and Synal2010). The external uncertainty, comprising, among other factors, the laboratory processing of a sample, was also included in the total combined uncertainty of the sample measurement. The measured 14C activities and their combined uncertainties were expressed in years BP (Before Present) as the Conventional Radiocarbon Age (CRA) at the 1-sigma probability level according to the Stuiver-Polach convention (Stuvier and Polach Reference Stuiver and Polach1977).
The OxCal 4.4 calibration programme was used to determine sample ages with the IntCal20 and BombNH1 calibration curves for Northern Hemisphere terrestrial samples (Bronk Ramsey Reference Bronk Ramsey2021; Hua et al. Reference Hua, Turnbull and Santos2021; Reimer et al. Reference Reimer, Austin, Bard, Bayliss, Blackwell, Ramsey, Butzin, Cheng, Edwards, Friedrich, Grootes, Guilderson, Hajdas, Heaton, Hogg, Hughen, Kromer, Manning, Muscheler, Palmer, Pearson, van der Plicht, Reimer, Richards, Scott, Southon, Turney, Wacker, Adolphi, Büntgen, Capano, Fahrni, Fogtmann-Schulz, Friedrich, Köhler, Kudsk, Miyake, Olsen, Reinig, Sakamoto, Sookdeo and Talamo2020).
Analytical results
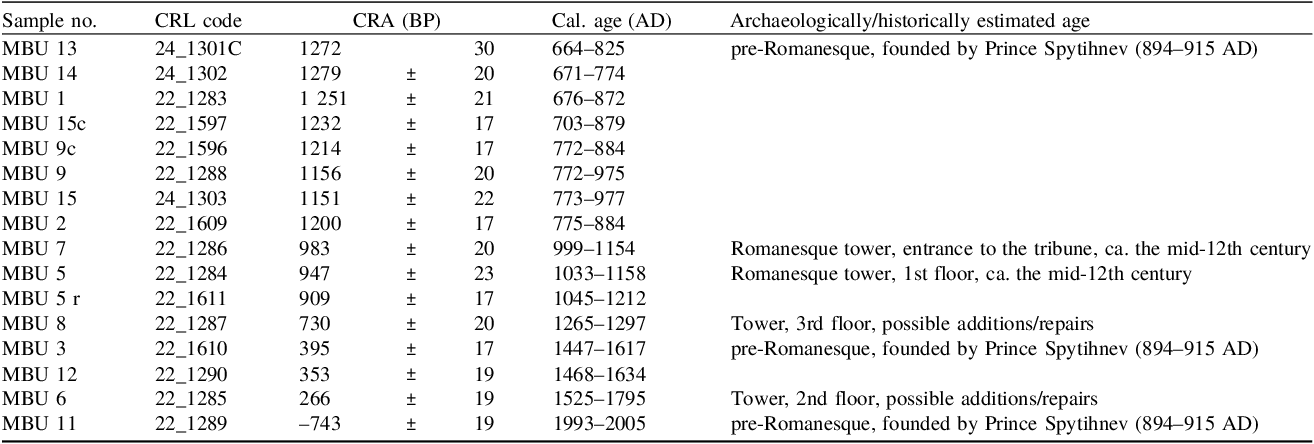
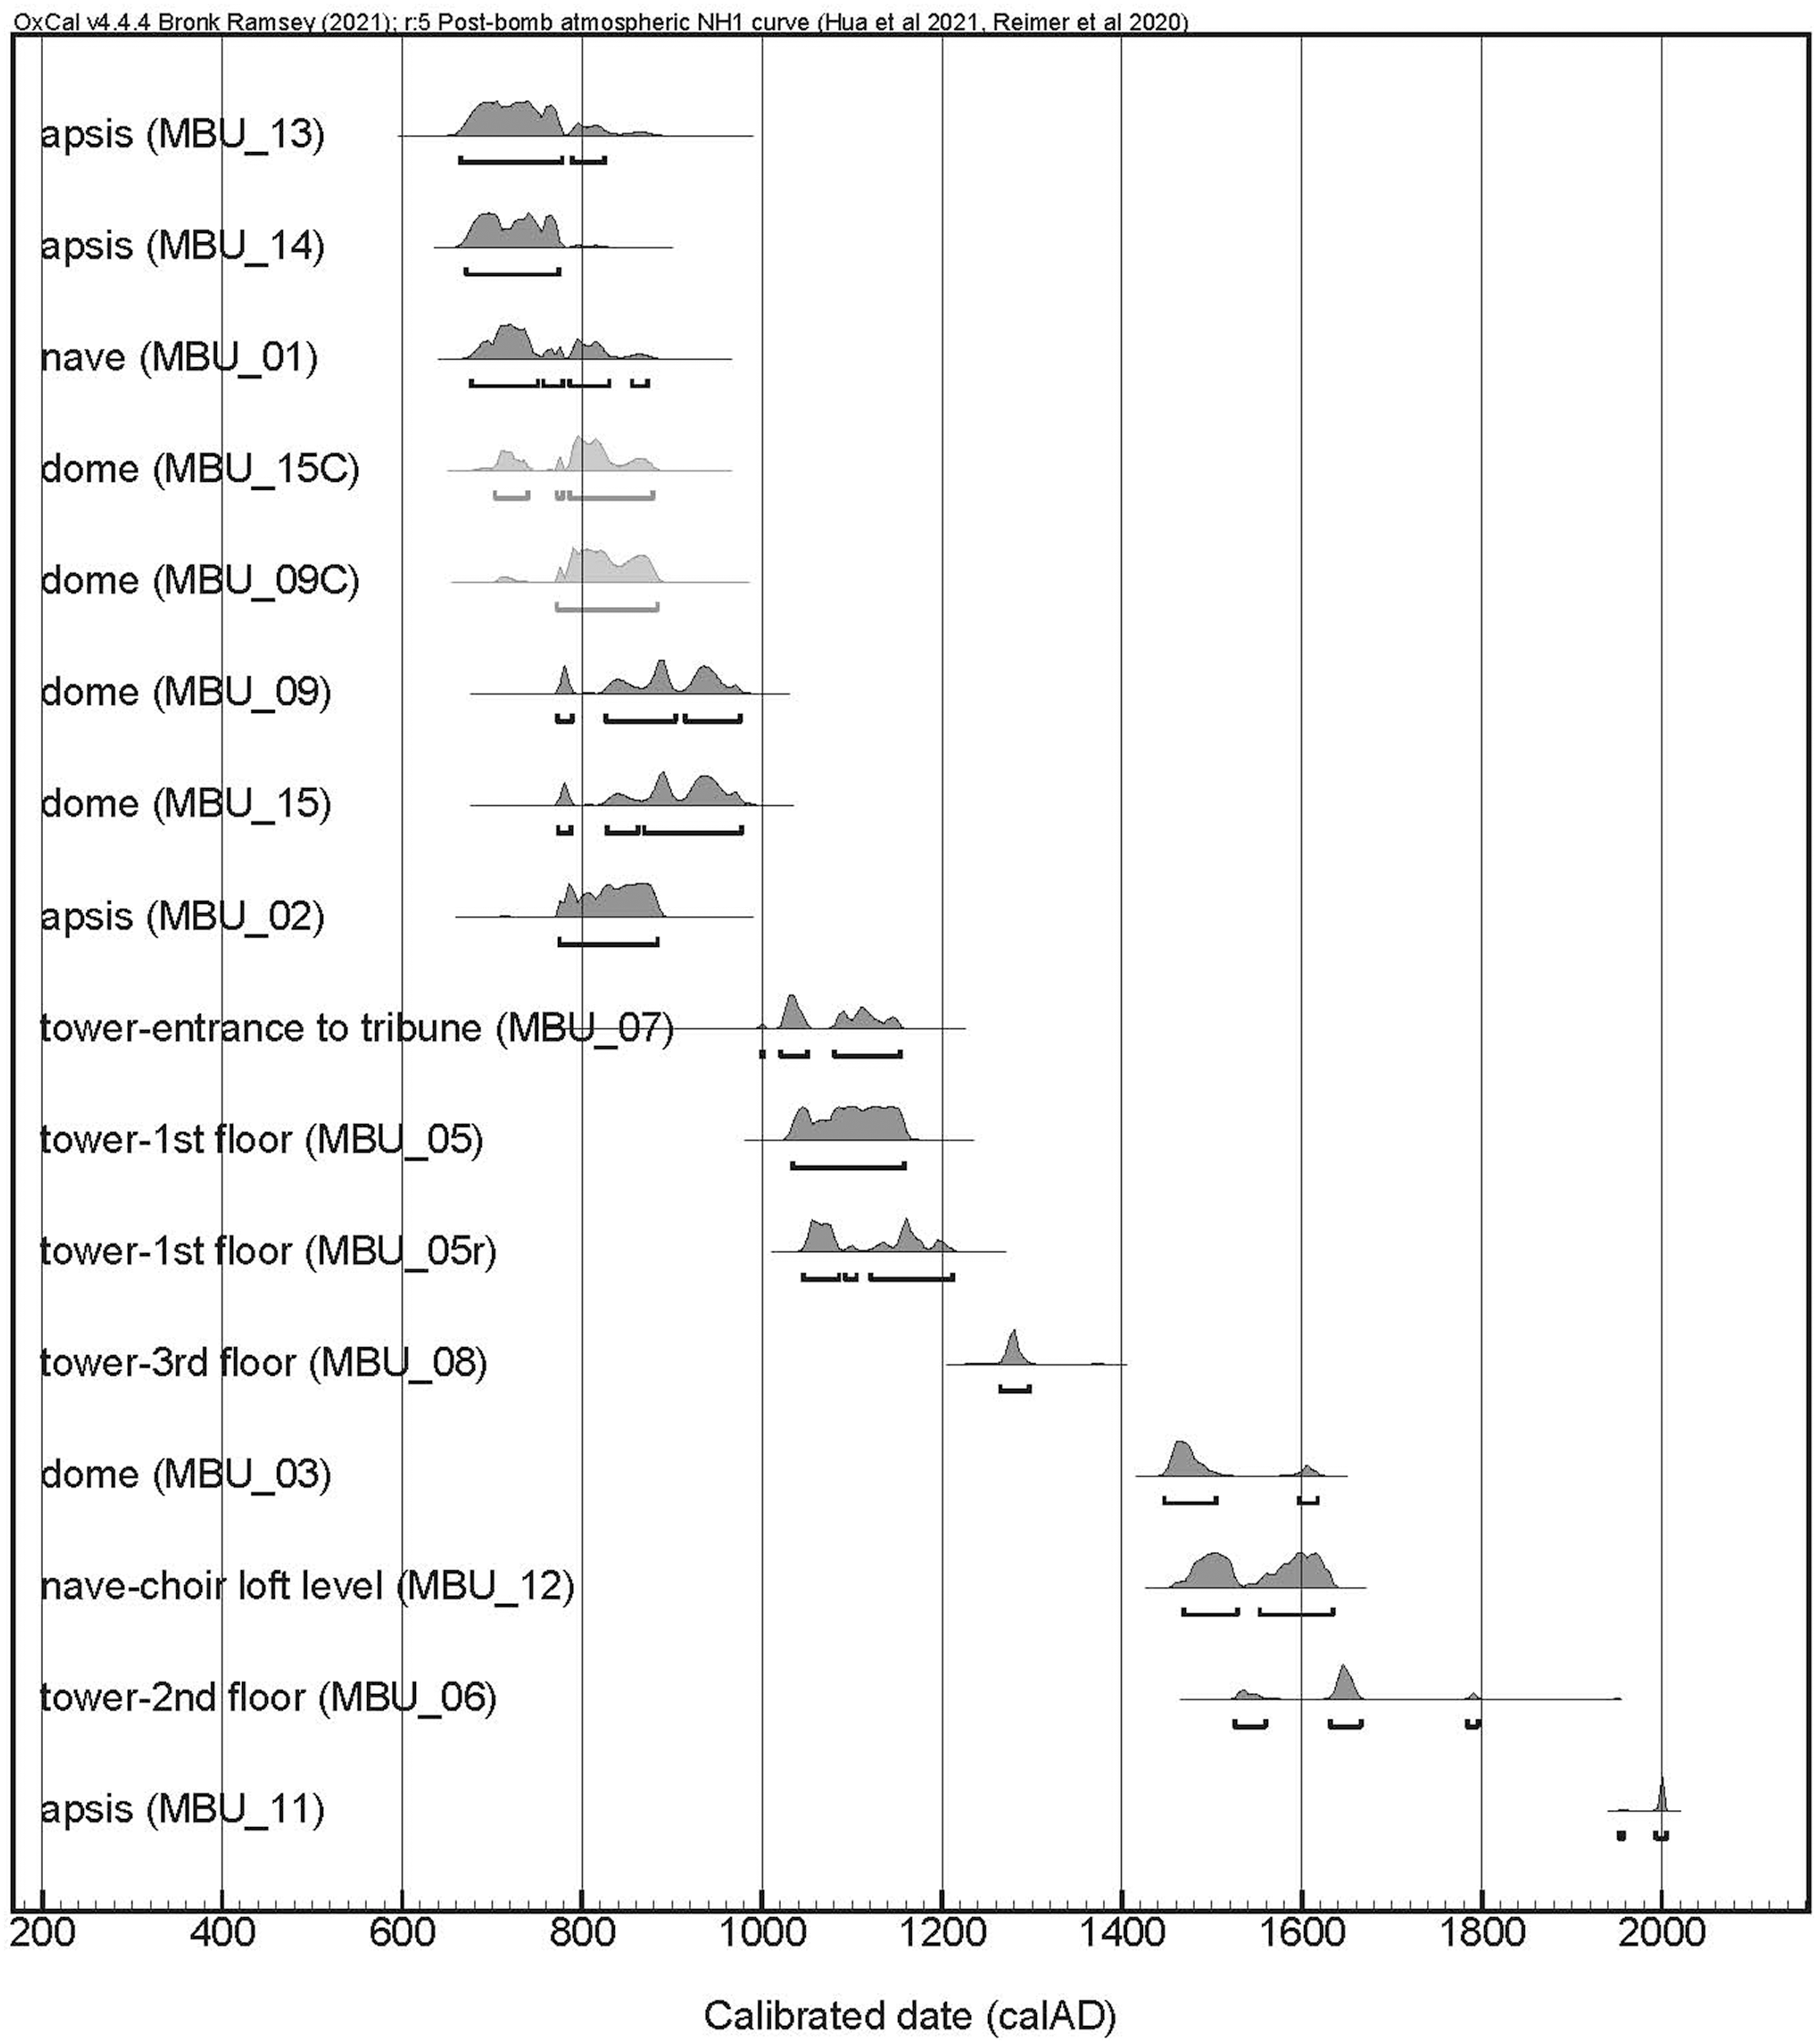
The results obtained by radiocarbon analysis using AMS are presented in Table 2 and graphically in Figure 2. Overall, they show general agreement with the archaeologically/historically assumed construction phases, with some exceptions. To discuss the relevance of the obtained dates, the results were further compared with other analyses performed. Apart from the general validation of the results, the main issues that required further consideration were the following discrepancies:
-
• in individual cases (MBU 3 and 11) the calibrated date clearly did not fit the chronology assumed when sampled;
-
• the calibrated age of the foundation phase is marginally older than expected according to established archaeological/historical relative chronology (MBU 1 and 2);
-
• samples from the same structure differ in age, i.e. compare MBU 13, 14 and 2 from the foundations, or MBU 3 with MBU 9, 15 from the vaulted dome.
Results of radiocarbon analysis of mortar binders and two charcoal samples (MBU 9c and MBU 15c) by AMS. Repeat analysis on sample MBU 5r

Table 2 Long description
The table presents the results of radiocarbon analysis using Accelerator Mass Spectrometry (AMS) on mortar binders and two charcoal samples. It includes columns for sample number, CRL code, CRA in radiocarbon years before present (BP), calibrated age in common era (AD), and archaeologically/historically estimated age. The table lists 15 samples with their respective data. Notable entries include MBU 13 and MBU 14, which are associated with the pre-Romanesque period founded by Prince Spytihnev, and MBU 7, linked to a Romanesque tower from the mid-12th century. The calibrated ages and historically estimated ages show varying degrees of agreement, with some samples like MBU 3 and MBU 11 showing discrepancies. The data highlights the complexity and challenges in dating historical structures accurately.
Cross sections of the rotunda at Budeč with the marked position of the samples. The colors refer to the assumed historical construction phases: green—pre-Romanesque, blue—Romanesque, yellow—Baroque.

Figure 1 Long description
The image displays cross-sectional views of the rotunda at Bude, highlighting the positions of samples taken for analysis. Different colors indicate the assumed historical construction phases: green for pre-Romanesque, blue for Romanesque, and yellow for Baroque. The sections are labeled A, B, C, and D, with specific sample positions marked by red crosses and numbers. The image includes detailed architectural features such as arches, walls, and internal structures, providing a visual representation of the building's evolutionary phases.
The calibrated age intervals are determined with 95.4% probability, which includes time periods that, with one exception, exceed 100 years and reach even 270 years in the case of the 17/18th century plateau of the calibration curve. However, the intervals are mostly non-continuous and split into smaller sections (Figure 2). The estimated time of the rotunda’s foundation fits to such a region on the calibration curve that does not allow a narrower interval than 100 years. The dating of two charcoal pieces corresponds to the cupola mortars from which they were taken (MBU 9 and 15) and sets the terminus post quem for its construction to 772 cal AD.
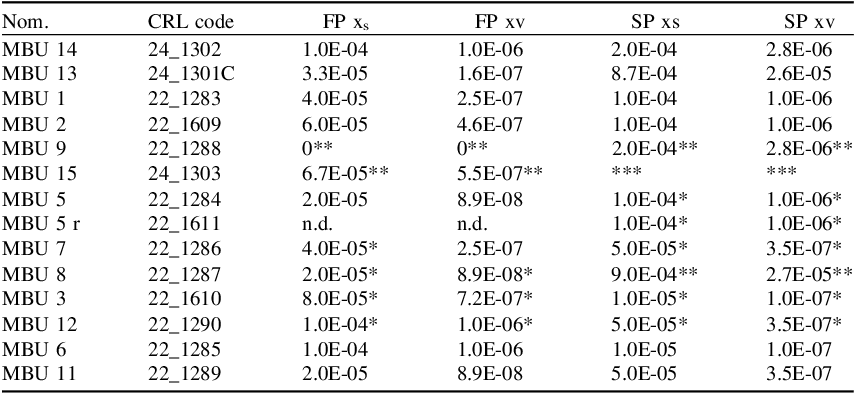
The CL microscopical assessment suggested a high efficacy of exclusion of particles containing geogenic carbon. The sedimentation process led to the exclusion of the remnants of unburnt lime particles down below the upper two portions FP and SP. SPs generally contained slightly higher amounts of luminescent particles, the highest amount constituting 0.09% of the examined area. The quantified fractions xs and xv in the FPs indicate that the detected level of contamination by CL is very small and, if accurate, has no significant influence on the resulting 14C activities (Table 3). However, some less bright particles may be hidden in the red luminescent background, and any samples with this background (marked with *) could potentially contain a greater proportion of geogenic carbon than has been quantified.
Average fractions of luminescent particles in observed areas (xs—surface fraction, xv—volume fraction xv=xs 2/3). *Red luminescent background, number of stars indicates the intensity

Table 3 Long description
The table presents data on the average fractions of luminescent particles in observed areas, categorized by surface fraction (xs) and volume fraction (xv). It includes columns for sample names, CRL codes, FP xs, FP xv, SP xs, and SP xv. The table has 15 rows, each representing a different sample with specific values for each category. Notable samples include MBU 14 with CRL code 24_1302, showing values like 1.0E-04 for FP xs and 1.0E-06 for FP xv. MBU 13, with CRL code 24_1301C, has values like 3.3E-05 for FP xs and 1.6E-07 for FP xv. The table also indicates samples with red luminescent background marked with asterisks, suggesting potential higher proportions of geogenic carbon. The data highlights the efficacy of the sedimentation process in excluding unburnt lime particles and the low levels of contamination detected by CL.
Polarized light microscopy and SEM-EDS
The mortar samples were divided into two groups based on similar composition and structural properties. The first group can be defined by the MBU 1 and 2 samples (Figures 3A and 3F). The filler of these samples is typically composed of quartz clasts, with minor feldspars and accessory minerals. The grains are rounded in shape without distinct edges, cracked in places, and contain minor faults and fractures. Their size distribution is very uneven, with grains ranging from 0.2 to 1 mm, but there are also typically much larger ones up to 7.5 mm. The binder of these samples forms large areas (clusters) surrounding the aggregate particles and is spatially diversified with variable CaO content. The central parts of the areas are rich in silts and clays, and lime binder is concentrated in the vicinity of the aggregate grains (Figure 4A). Samples MBU 13 and 14 may belong to this group, but their thin sections do not carry a representative portion of mortar mix for this assessment. A substantial part of the thin-section of MBU 13 consists of two fragments of fine-grained grayish-colored limestone which intersect calcite veins. MBU 14 does not contain any filler, it is only a binder mass, which includes pure calcitic lime and also under-burnt particles. The samples in this group show structural differences and are characterized by large continuous cracks running through the whole sample (Figure 3F). These cracks divide the matrix into individual clusters, which are further disturbed by smaller cracks. Calcite rich rims surround the clusters (Figures 4B, 4C).
Graphical comparison of the chronological intervals obtained after calibration, OxCal v. 4.4.4. using atmospheric calibration curves IntCal20 and BombNH1. The results marked light-gray are from the charcoals embedded in the mortar samples.

Figure 2 Long description
The line graph presents a comparison of chronological intervals obtained after calibration using atmospheric calibration curves IntCal20 and BombNH1. The x-axis represents the calibrated date in calendar years A.D., ranging from 200 to 2000. The y-axis lists various parts of a structure, such as the apse, nave, dome, tower, and choir loft level, each with specific sample identifiers. Each part of the structure has corresponding data points and ranges indicated by horizontal lines and shaded areas, representing the calibrated dates. The light-gray shaded areas highlight results from charcoals embedded in the mortar samples, providing a visual distinction from other data points. The graph illustrates the distribution and overlap of dates across different parts of the structure, offering insights into its construction history. All values are approximated.
The second group of samples, MBU 3, 5, 6, 7, 9 and 15, has a similar mineralogical composition of the aggregate to the first group but quartz conglomerates are more common, and the grains are angular to sharp-edged with more pronounced edges (Figure 3B). The distinction from the first group is in the sorting; the grains are better sorted, corresponding in size to a fraction of 0.2 to 1 mm, max. 2 mm, but there are no significantly larger grains. The binder of the samples is typically fine or medium-grained, calcitic. Binder related particles (for definition see Elsen Reference Elsen2006) are typically present and some contain proportion of clay (Al2O3) and silica (SiO2) impurities, indicating their possible hydraulic or at least weakly hydraulic properties, especially MBU 5, 6, 7, and 15 (Figure 5), (Kozlovcev and Válek Reference Kozlovcev and Válek2021). Sample MBU 15 is identical to the parameters of the second group and contains a higher portion of limestone fragments and their relics after burning. Within this category, there are other differences in terms of the binder-to-aggregate ratio or structural properties related to lime quality and workability, as seen in two samples of MBU 3 and MBU 9 from the dome. Sample MBU 3 contains burnt ceramic fragments but by the aggregate and binder it fits the rest of the group (Figure 3C). Samples MBU 3, 4, 5, 6, 7 and 15, are compact with only minor cracks; they also contain spherical pores. Sample MBU 9 is very compact, with almost no pores or other disturbances (Figure 3B).
The potential radiocarbon dating contaminants were evaluated using PLM as follows:
-
• The filler of all samples contains only non-carbonate particles; limestone fragments and carbonate particles are not part of the filler but are derivatives of the binder (BRP - binder related particles).
-
• Unburnt and partially burnt particles were found mainly in samples MBU 14 and 15. Sample MBU 13 is also composed of fragments of unburnt limestone. In the other thin-sections, relicts of underburnt particles existed dispersed in the matrix, and a variety of other BRP, including lime lumps sensu stricto, were present.
-
• BRP reflects the chemical composition of the raw material. In places, they had hydraulic properties due to clay (Al2O3) and silica (SiO2) impurities (MBU 5, 6, 7, 15), but more often, they were purely calcitic (Figure 5). The underburnt particles are characterized by a zonal character and significant structural changes due to thermal transformation (Figure 3D).
-
• In the areas of open pores and structural disturbances, MBU 1, 2 and 14, the samples show significant precipitation of pure calcite (Figures 3E, 4). This is most likely related to the dissolution of the binder by water moving through the pores, leading to redistribution and secondary precipitation of calcite.
-
• Samples MBU 1, 2, and 14 show uneven matrix composition. The lime binder is often “glued” to the larger grains or adjoins the cracks, the central parts of the binding matrix clusters are rich in silts and clays (lower CaO contents in the central parts of the clusters), increasing towards the edges bounded by structural faults. This may be related to the processing of loessic silts or to the addition of some impurities directly into the mortar during mixing or the transportation of the lime binder before its full hardening and carbonation (Figures 3F, 4A).
Polarized light microscopy images of the thin-sections of characteristic mortar samples from the Budeč rotunda. The thin sections are impregnated with blue resin.
-
A. Rounded quartz grains with minor faults and fractures (a). Clusters of binder with silts and clays are heavily cracked inside, lime is concentrated adjacent to the aggregate grains (b). Pore structures filled with blue resin (c). MBU 2, PPL.
-
B. Angular sharp-angled quartz clasts with more pronounced edges and numerous microcracks (a) in medium-grained, well-compacted calcitic matrix (b), contains some proportion of clay and silica impurities (c). MBU 9, PPL.
-
C. Sharp-edged aggregate of a burnt ceramic fragment (a) in a calcitic binder matrix (b) and angular quartz grains (c). Pore structures and cracks (d) intersecting the matrix are filled with blue resin. MBU 3, PPL.
-
D. A BRP that no longer retains the original limestone structurezonal character (PPL top-left section). The different intensities of luminescence (CL, bottom-right section) are caused by thermal transformation. MBU 15.
-
E. Calcite precipitation lining and filling the cracks in the fine-grained calcitic binder matrix. MBU 14, XPL.
-
F. Spatial diversification of calcite within a cluster of the binding matrix. The lowest CaO content is in the central part of the cluster. MBU 2, XPL.

Figure 3 Long description
The image displays a polarized light microscopy view of a thin-section of a mortar sample impregnated with blue resin. It highlights rounded quartz grains with minor faults and fractures. Clusters of binder with silts and clays are heavily cracked inside, with lime concentrated adjacent to the aggregate grains. Pore structures are filled with blue resin. The sample is identified as MBU 2, observed under plane-polarized light (PPL).
SEM BSE images and EDS map of selected samples from the first PLM group. (A) Calcite rich areas—points 17,18,21,22,23 surrounding a soil-rich (silica and alumina components with calcite particles) cluster—points 19, 20, 24. Table—elemental composition determined by EDS in wt.%, MBU 2, BSE. (B) Calcite rich precipitated rims surrounding cracks in the binder. MBU 14, BSE. (C) Element map of the binder, MBU 14 EDS map.

Figure 4 Long description
The image consists of three panels labeled A, B, and C. Panel A shows a scanning electron microscope backscattered electron (SEM BSE) image of calcite-rich areas surrounding a soil-rich cluster. Points 17, 18, 21, 22, and 23 are marked in calcite-rich areas, while points 19, 20, and 24 are marked in the soil-rich cluster. Panel B displays a SEM BSE image of calcite-rich precipitated rims surrounding cracks in the binder. Panel C presents an element map of the binder, highlighting the distribution of silicon, calcium, and aluminum. The table next to Panel A lists the elemental composition determined by energy-dispersive X-ray spectroscopy (EDS) in weight percentages for points 17 to 24, including oxides of calcium, magnesium, silicon, aluminum, iron, chlorine, phosphorus, and potassium.
SEM BSE images and EDS map of a sample from the second PLM group. Three BRPs with different compositions, highly calcitic one with under-burnt core—points 10–13, BRP with silica and alumina impurities—points 8,9. and more compact BRP with variable composition—points 1, 2, 3. Table—elemental composition determined by EDS in wt.%, MBU 15, BSE.

Figure 5 Long description
A scanning electron microscope backscattered electron image and energy-dispersive X-ray spectroscopy map of a sample from the second PLM group. The image shows three brick fragments with different compositions. The highly calcitic brick fragment with under-burnt core points 10, 11, 12, and 13. The brick fragment with silica and alumina impurities points 8 and 9. The more compact brick fragment with variable composition points 1, 2, and 3. The table displays the elemental composition determined by EDS in weight percentage. The table includes columns for calcium oxide, magnesium oxide, silicon dioxide, aluminum oxide, iron oxide, phosphorus pentoxide, potassium oxide, and sulfur trioxide. Each row corresponds to a specific point on the image, detailing the composition at that point.
Discussion
The validity of the calibrated ages obtained was assessed by two methods: cathodoluminescence, which allowed for a direct assessment of the purified binder, and PLM, which determined the composition of the mortars in terms of the presence of possible interfering contaminants. PLM characterization was also used to verify similarities between mortars of the same structure and age, and, conversely, differences when two samples of the same structure had different ages.
The FPs of the purified binder, which were used for the 14C analysis, had low levels of contamination identified by CL. These particles were remnants of underburnt limestone. It was possible to quantify the contamination using image analysis, and at its maximum the surface fraction reached a value of 0.0001. Such a low amount of contamination should have only little effect on the radiocarbon age when taken proportionally to the sample volume. The radiocarbon dates of samples MBU 1, 2, 5, 6, 11, 13, and 14 can therefore be regarded as valid according to the physical separation methodology used. On the other hand, samples MBU 1, 2, 13, and 14 showed earlier radiocarbon age than suggested by the historical written sources. This fact challenges the ability of the CL method to securely detect all of the geogenic calcite contamination, potentially from very finely crushed unburnt or incompletely burnt limestone. In the case of the MBU 3, 7, 8, 9, 12 and 15 samples, the background luminescence could potentially be linked to some contamination (further studies would need to be pursued to understand this effect) and a certain proportion of less bright particles was not possible to distinguish from the background. This fact may possibly be reflected in the increased uncertainty of the determined 14C ages. However, when modelled, it showed that this would lead mainly to connecting the discontinuous data segments rather than significantly expanding the calibrated age intervals. Only in the case of MBU 8 would the age interval significantly increase.
Samples MBU 2, 13, and 14 were taken from the same masonry course within a distance of several tens of cm apart, but their radiocarbon ages differ by up to 79 yearsFootnote 1 . Although the presence of different construction phases could not be ruled out through mortar analysis, it seems that the purified samples were contaminated with geogenic carbon that was not detectable by CL. Mortars of the same set of samples from the foundations and lower levels of masonry had signs of cracks and interstructural alterations, including calcite precipitation. CL does not effectively distinguish such changes, and thus their potential effect on the dating cannot be simply excluded. All of these samples were also dated older than archaeologically expected, suggesting that a rejuvenation may be of secondary importance in this case. Especially samples MBU 1 and 2 are characterized by uneven CaO distribution and binding-matrix cluster formations. These inhomogeneities and the increased presence of silts and clays may have been caused by the addition of loess (clastic sediments, predominantly of silt size) during mortar mixing. These aeolian sediments (windblown dusts) are a common part of the surrounding geological environment. They very often contain calcite concretions and finely disseminated calcite, which becomes part of the binder matrix during mortar processing. Due to its very fine-grained crystalline structure, the luminescence of calcite particles could be very weak and difficult to identify (Wojcieszak et al. Reference Wojcieszak, Fontaine, Elsen, Hayen, Lehouck and Boudin2024). However, the presence of this carbonate can cause radiocarbon ageing of the samples. Another source of contamination that could have affected the earlier radiocarbon ages of samples 1, 2, 13 and 14 from the foundations and lower parts of masonry might be a secondary precipitated calcite from the stonework or surrounding bedrock. The nave, apsis and dome are constructed of marly limestone; the tower is constructed of sandstone which should not affect the 14C dating—that is in agreement with the presented results. To confirm this hypothesis, a better understanding of precipitation mechanisms and testing on dating of the precipitation itself would be required.
Sample MBU 3 contained burnt clay fragments. The presence of these particles may have unpredictable effects on the radiocarbon age of the samples, as is known from the results of the MODIS international mortar dating intercomparison study (Hajdas et al. Reference Hajdas, Lindroos and Heinemeier2017). However, in the case of sample MBU 3, the amount of clay particles was low and possibly negligible.
Using only mortar characterization to determine the chronological development of the building proved insufficient. The characteristics of the mortars showed that, throughout the long period since its foundation up until the twentieth century, very similar local raw materials were used for construction work. Certain features, such as the structure of the binding matrix, the shapes of pores and cracks, the particle size distribution, and the quality of the aggregate and the binder to aggregate ratio, made it possible to distinguish between some samples. However, these features can be attributed to the technologies used, the properties of the mortar with respect to its use in the masonry, and the ageing conditions. Thus, they cannot be used to imply chronologically distinct construction phases.
The mortars from the foundations (MBU 2, 13, 14) and the lower part of the masonry (MBU 1) indicate the use of a different method of production (they contain coarser filler and silts and clays) in comparison with the mortars from the dome and the tower. The tower samples (MBU 5, 6, 7) differ in mortar structure from the dome (MBU 9, MBU 15). This fact may reflect different requirements on the mortar properties in the tower and the dome, but also different construction phases (the dome is an original part of the pre-Romanesque rotunda, whereas the tower was added in the Romanesque period).
Characterization of the mortars was also useful in evaluating the cases where mortars from the same structure or assumed construction phase differed in radiocarbon age. When combined with the 14C dating results, a direct comparison of the samples from the top layer covering the dome—MBU 3 and MBU 9—showed clear differences. Based on this, it is possible to accept the younger age of sample MBU 3 as a later repair phase. Similarly, the relatively recent origin of mortar MBU 11 obtained by radiocarbon analysis can be confirmed based on the different character of the mortar—this time even observable at the macroscopic level.
The radiocarbon dating results defined a group of samples that can be identified with the oldest phase of the rotunda construction. These are samples MBU 13, 14, and 2, representing the foundations of the apsis; MBU 1, representing the lower parts of the nave; and MBU 9, 9c, 15, and 15c, representing the dome. These are all dated before the year 1000 AD, and this confirms that the whole building, from the foundations up to the nave, is the original structure from the pre-Romanesque period and represents the Church of St. Peter mentioned in the legends. On the other hand, the results do not absolutely correspond to the statement of the legends, which say that the church was founded by Prince Spytihnev, a prince whose reign dates back to the years 894–915 AD. From all the samples of the oldest group, only the MBU 9 and 15 overlap with the historical reign dates of Prince Spytihnev. In the case of the charcoal samples, the older age might be caused by the old wood effect or by the possibility that the charcoals have entered the mortar secondarily, in both cases it predates the time of formation of the mortars (Kundrát et al. Reference Kundrát, Maříková-Kubková, Herichová, Tomanová, Petrová, Tecl, Kozlovcev, Kotková, Fialová and Kubančák2023; Pachnerová Brabcová et al. Reference Pachnerová Brabcová, Kundrát and Krofta2023).
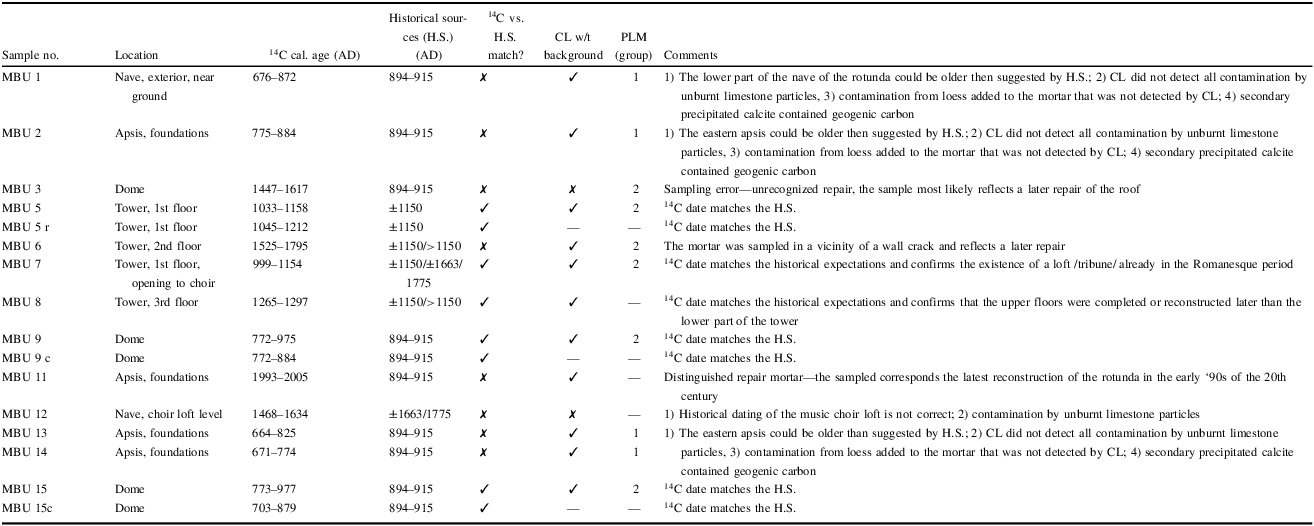
Summary of the discussed issues is presented in Table 4. In the cases of the MBU samples 1, 2, 12, 13, and 14, the discrepancies of their radiocarbon ages with the historical evidence of legends must be further considered. As discussed above, the greater radiocarbon age might be caused by contaminations of geogenic carbon, but the methods used are not able to establish the level of contamination (e.g. from the loess admixtures present in those samples). Also, evidence of legends may (not exceptionally) contain particular discrepancies from reality in the past. Legends are sources of narrative character written on demand by authors who not always (or rather barely) eye-witnessed the events they were writing about and often took information from other narrative sources. Thus, it cannot be ruled out that construction of the rotunda began before the reign of Spytihnev I. From this point of view, it is interesting that mortar samples from the dome (MBU 9 and 15) correspond to the established time of foundation.
Summary of the results and discussion of their validity. The samples highlighted by the gray background do not match expectations based on historical sources; multiple reasons have been identified. Legend: c—charcoal sample, CL w/t background—without luminescent background/contamination identified by CL below 0.0001

Table 4 Long description
The table presents a summary of radiocarbon dating results and their comparison with historical sources for various samples from a site. It includes columns for sample number, location, radiocarbon age, historical sources, match status, contamination check, and comments. The table has 15 rows and 10 columns, with headers such as Sample number, Location, 14C cal. age (AD), Historical sources (H.S.) (AD), 14C vs. H.S. match, CL w/t background, PLM (group), and Comments. Notable samples with discrepancies are highlighted with a gray background. The comments section explains reasons for discrepancies, such as contamination by geogenic carbon or potential inaccuracies in historical sources. The table aims to discuss the validity of the radiocarbon dates in the context of historical evidence.
Samples MBU 5, 5r, and 7 coming from the first floor of the tower provide a combined date interval from 1038 to 1158 which correspond to the stylistic assessment of the Romanesque period, particularly to the mid-12th century. Sample MBU 7 was taken from the vault of the entry to the choir loft, and thus it confirms the existence of the entry to the Romanesque tribune, most likely built simultaneously with the construction of the tower.
The MBU 8 sample (1265–1297 cal AD) comes from the top third floor of the tower. The younger dating (compared to the first floor) indicates repairs or even a height extension of the tower. Thus, the younger radiocarbon age of the sample is consistent with the observation that the second and third floors of the tower are built of different stone than the ground and first floors, and supports the hypothesis of two construction phases.
The MBU 6 sample (1631–1665 cal AD, 70% probability) was collected from the second floor of the tower, in particular from a major structural crack in the wall of the north tower. The younger radiocarbon age (compared to samples MBU 5 and 7 from the first floor, and even to sample MBU 8 from the third floor of the tower), together with the sampled context, proves some movements of the masonry and the need for repairs during the existence of the building.
The MBU 12 sample (1468–1528 cal AD and 1553–1634 cal AD) from the floor level of the choir does not particularly correspond to either the baroque reconstructions dated historically to the ‘60s of the 17th century or the construction of the music choir dated 1775 (without further references). In this case, it is not possible to decide whether the discrepancy between historical and radiocarbon dating is due to an incorrect historical assessment, contamination of samples that was not detected by the methods used, or whether the 14C results obtained indicate a repair yet undetected by the construction history survey. The position of the sample did not allow for any further investigation, as it is almost fully covered by the choir’s structure and plaster.
The MBU 3 sample (1447–1617 cal AD) was collected from the top layer of the dome of the rotunda, and is of a radiocarbon age similar to that of sample MBU 12. Analogically, the 14C dating of MBU 3 may indicate some repairs yet undetected by the construction history survey. Particularly, in the case of sample MBU 3, the presence of the burnt ceramic admixtures may cause rejuvenation of the radiocarbon dating. Thus, it cannot be excluded that the sampled mortar corresponds to the historically documented Baroque rebuilding from the 1660s or relates to the insertion of the choir loft allegedly in 1775.
The MBU 11 sample (1993–2005 cal AD) collected from the top of the apsis foundations corresponds to the recent restoration of the rotunda in the early 1990s.
Conclusions
The determined radiocarbon dates are generally consistent with the dates established in the literature regarding the foundation of the rotunda, addition of the tower and other repair phases.
Due to the presence of geogenic contaminants in the foundation mortars (aeolian sediments possibly containing carbon or binder particles not detected by CL and calcite precipitation), the oldest parts could not be reliably dated.
The structure of the vaulted dome is original and dates to a time span between 772 and 977 calAD. This is in agreement with the assumption that the church was funded by Prince Spytihnev (reign 894–915 AD) and confirms that this is the oldest standing church structure in the Czech Republic.
The tower construction based on the combined data from the MBU 5, 5r, and 7 samples was found to be 942 BP (±12), which provides a calibrated age between 1038 and 1158 cal AD. The third floor of the tower was probably completed or repaired in the second half of the 13th century (1265–1297 cal AD). The fact that the sample from the second floor is younger than that from the third floor (16th–18th century) confirms the assumption of major repairs connected to the structural integrity of the tower.
Further phases of repairs have been determined, but their absolute chronological classification is only indicative due to the limited number of samples analyzed.
The physical separation pretreatment method proved to be applicable, and only one portion of the purified binder (FP) was analyzed using AMS. CL was successfully applied to assess the remnants of the underburnt limestone particles—the main geogenic contaminant in the binder but some questions remain whether it can detect all geogenic carbon or not.
Characterization of the mortar composition was an important part of the interpretation of the radiocarbon results obtained. It allowed for an understanding of the differences between the separate groups—mainly the presence of silted soil and calcite precipitins in the foundations—which led to the questioning of these results due to potential contamination with geogenic carbon. This fact points out that further research is needed to assess potential contaminants in the purified binder portion, as this contamination was not visible using CL.
From a methodological point of view, the study conducted confirms the necessity of having at least three samples of each structure to verify the reliability and validity of the mortar dating results. The dating of the parts represented by only one sample was considered indicative, and additional sampling would be needed to provide more precise or reliable dates.
Acknowledgments
This work was supported by the programme for Support for Promising Human Resources—postdoctoral fellows (PPLZ) of the Czech Academy of Sciences, under the project “Radiocarbon dating rewrites (pre-)history? The impact of radiocarbon dating on changes in archaeological paradigms.” Reg. No. L300022401. Kateřina Pachnerová Brabcová and Ivo Světlík acknowledge the support of the project “Ready for the future: understanding the long-term resilience of the human culture (RES-HUM)”, Reg. No. CZ0201/00/22_008/0004593.
We are very grateful to the Central Bohemian Region Department of Culture and Heritage Conservation for permission to take samples from the National Cultural Monument of St. Peter and Paul Rotunda at Budeč, to the Sládeček Museum of Local History in Kladno for access to the rotunda, and not least to Miloslava Housková for the graphic work.