


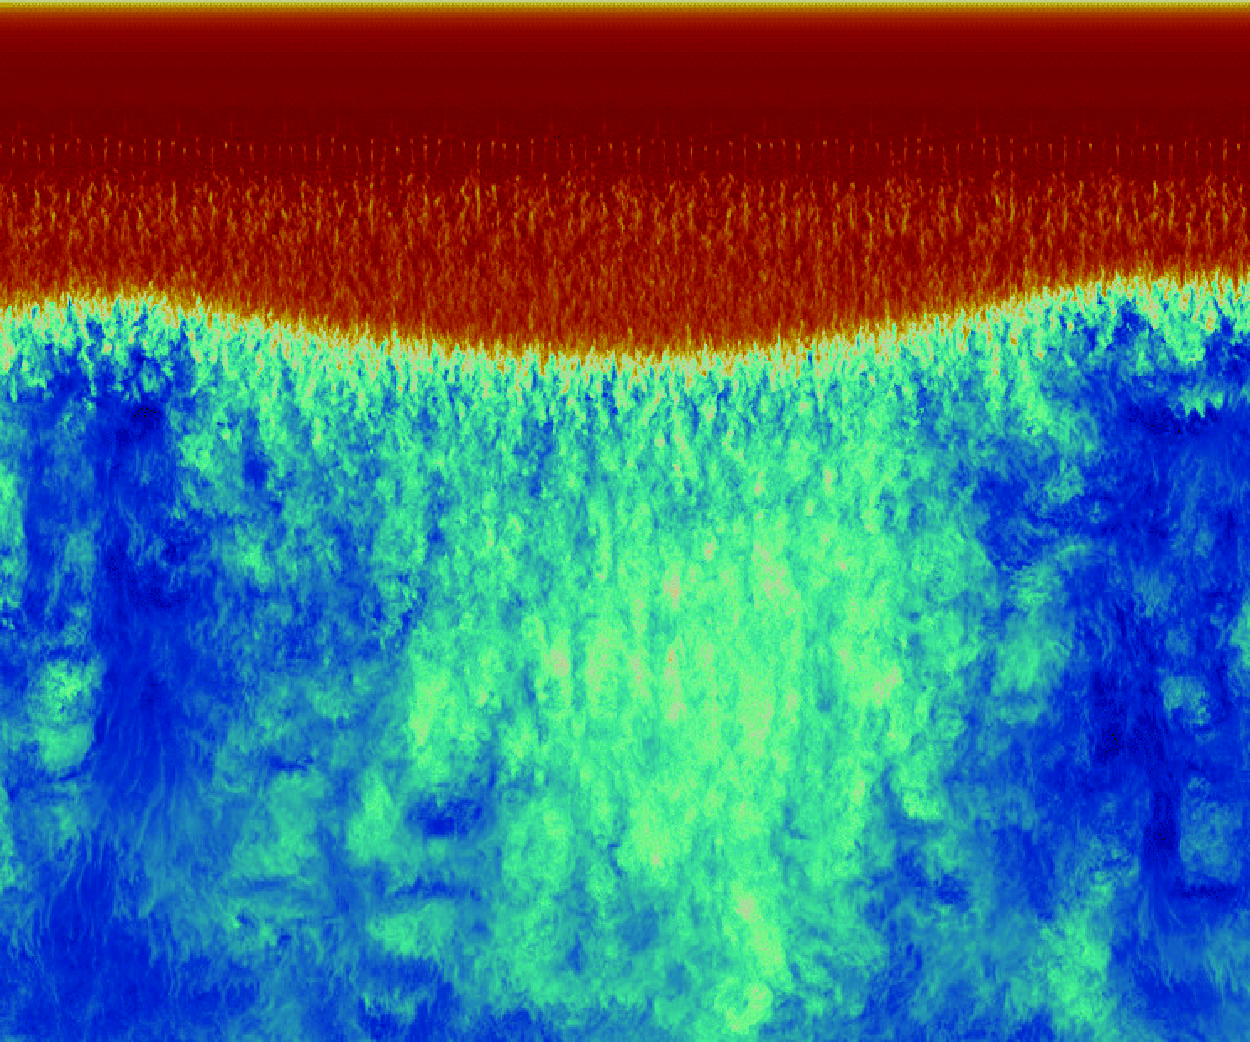
 ), which is insufficiently wide to observe large-scale three-dimensionality. In this work, high-fidelity simulations are performed up to
 , on an infinite unswept NASA Common Research Model (CRM) wing profile at

 , intermittent 3-D separation bubbles are observed at buffet conditions. While previous Reynolds-averaged Navier–Stokes (RANS)/stability-based studies predict quasi-simultaneous onset of 2-D- and 3-D-buffet, a case that remains essentially 2-D is identified here. Strongest three-dimensionality was observed near low-lift phases of the buffet cycle at maximum flow separation, reverting to essentially 2-D behaviour during high-lift phases. Buffet was found to become 3-D when extensive mean flow separation was present. At
 , multiple 3-D separation bubbles form in a spanwise wavelength range



1. Introduction
Transonic shock buffet is an aerodynamic instability commonly found in a wide range of industry-relevant aerospace applications. Buffet comprises certain types of shockwave/boundary-layer interactions (SBLI) (Dolling Reference Dolling2001), and is characterised by periodic (albeit, often irregular) self-sustained shock oscillations, and phase-dependent boundary-layer separation and reattachment (Lee Reference Lee1990, Reference Lee2001). Often investigated via a combination of flight tests, wind tunnel experiments and computational fluid dynamics (CFD) simulations, transonic buffet is a high-speed instability with onset criteria that, for a given aerofoil of chord length
 $c$
and Reynolds number
 $Re = \frac {\rho _{\infty } U_{\infty }c}{\mu _{\infty }}$
, depends on certain combinations of free stream Mach number
 $ (M_{\infty } )$
and angle of incidence
 $ (\alpha )$
. Buffet has important physical ramifications for aircraft design and efficiency, motivating the need for a complete understanding of its physical mechanisms. It is, for example, relevant at the boundaries of the flight envelope of commercial aircraft, namely for high speeds and high angles of attack (AoA). Transonic shock buffet can cause large amplitude oscillations in lift and drag, leading to structural vibrations, deteriorated control and, subsequently, increased fatigue and failure rates. An extensive review of the buffet instability was provided by Giannelis, Vio & Levinski (Reference Giannelis, Vio and Levinski2017).
1.1. Categorisation of buffet types and geometrical complexity
Transonic buffet is broadly characterised into two types: Type I buffet, identified as phase-locked shockwaves propagating on both sides of symmetric aerofoils at zero angle of attack, and Type II buffet, characterised by shock oscillations and periodic separation/reattachment on the suction side of aerofoils at non-zero angles of attack (Giannelis et al. Reference Giannelis, Vio and Levinski2017). In this work, we limit our discussion to Type II buffet, as it is commonly found on the asymmetric supercritical aerofoils widely used in practical applications such as commercial airliners. Further categorisation can be made based on the state of the boundary layer upstream of the main SBLI. Based on this definition, transonic buffet can be further separated into laminar buffet (Dandois, Mary & Brion Reference Dandois, Mary and Brion2018; Zauner & Sandham Reference Zauner and Sandham2020; Moise, Zauner & Sandham Reference Moise, Zauner and Sandham2022; Song et al. Reference Song, Wong, Ghate and Lele2024) and turbulent buffet (Fukushima & Kawai Reference Fukushima and Kawai2018; Nguyen, Terrana & Peraire Reference Nguyen, Terrana and Peraire2022), with comparable low-frequency 2-D energy content found between the two (Moise et al. Reference Moise, Zauner, Sandham, Timme and He2023). In this study, we limit our analysis to fully turbulent buffet, as it is the most representative of the higher Reynolds numbers found in practical applications (Giannelis et al. Reference Giannelis, Vio and Levinski2017).
Within the scope of aerofoil buffet studies, distinction must also be made between the level of geometrical complexity for the model used in the investigation. The complexity can range from purely 2-D aerofoil profiles (Crouch et al. Reference Crouch, Garbaruk, Magidov and Travin2009; Sartor, Mettot & Sipp Reference Sartor, Mettot and Sipp2015; Poplinger, Raveh & Dowell Reference Poplinger, Raveh and Dowell2019; Sansica et al. Reference Sansica, Loiseau, Kanamori, Hashimoto and Robinet2022) to 3-D simulations of 2-D aerofoils extruded in the third dimension typically with infinite/periodic boundary conditions applied (Deck Reference Deck2005; Garnier & Deck Reference Garnier, Deck, Deville, Le and Sagaut2013; Ishida et al. Reference Ishida, Ishiko, Hashimoto, Aoyama and Takekawa2016; Fukushima & Kawai Reference Fukushima and Kawai2018; Memmolo, Bernardini & Pirozzoli Reference Memmolo, Bernardini and Pirozzoli2018; Zauner & Sandham Reference Zauner and Sandham2020; Moise et al. Reference Moise, Zauner, Sandham, Timme and He2023), isolated finite-wings (Iovnovich & Raveh Reference Iovnovich and Raveh2015; Ohmichi, Ishida & Hashimoto Reference Ohmichi, Ishida and Hashimoto2018) and full aircraft configurations (Sartor & Timme Reference Sartor and Timme2017; Tinoco et al. Reference Tinoco2018; Tinoco Reference Tinoco2019; Masini, Timme & Peace Reference Masini, Timme and Peace2020; Houtman, Timme & Sharma Reference Houtman, Timme and Sharma2023; Sansica & Hashimoto Reference Sansica and Hashimoto2023; Tamaki & Kawai Reference Tamaki and Kawai2024). Each has potential trade-offs in terms of cost, ability to capture physically meaningful phenomena and differing levels of relevance to real-world applications. The geometrical complexity also largely determines the level of fidelity of the simulation methods that can be feasibly applied to it. In this study, we perform high-fidelity calculations of infinite 3-D aerofoils, at significantly wider span-widths than previously simulated. Within the context of this work, ‘high-fidelity’ indicates implicit large eddy simulations (ILESs), capable of resolving flow scales that range from integral to smaller turbulent scales. High-fidelity is defined relative to `low-fidelity’ methods that, in the present framework, refer to steady/unsteady Reynolds-averaged Navier–Stokes (RANS/URANS) methods, that aim to approximately model the small turbulent scales. These methods are computationally more affordable and are used ubiquitously as standard throughout the relevant engineering applications.
A defining property of infinite wings is the aspect ratio ( ) selected for an aerofoil chord length
 $c$
and spanwise length
 $L_z$
. For high-fidelity aerofoil simulations at both low (Aihara & Kawai Reference Aihara and Kawai2023) and high (Garnier & Deck Reference Garnier, Deck, Deville, Le and Sagaut2013) speeds, the size of the flow separation has been shown to be sensitive to the span-width (
 $L_z$
), which therefore needs to be appropriately selected to avoid overly constraining the flow. Due to computational cost, high-fidelity simulations of periodic wings have typically been limited to narrow aspect ratios. Some relevant examples of 2-D buffet studies on narrow domains used
 (Garnier & Deck Reference Garnier, Deck, Deville, Le and Sagaut2013),
 (Fukushima & Kawai Reference Fukushima and Kawai2018; Nguyen et al. Reference Nguyen, Terrana and Peraire2022),
 (Moise et al. Reference Moise, Zauner and Sandham2022, Reference Moise, Zauner, Sandham, Timme and He2023) and
 (Song et al. Reference Song, Wong, Ghate and Lele2024). In the study of Garnier & Deck (Reference Garnier, Deck, Deville, Le and Sagaut2013), the spanwise width of their simulations was raised from 3.65 % to 7.3 %, which led to a significant reduction of the pressure fluctuations at the trailing edge (Giannelis et al. Reference Giannelis, Vio and Levinski2017). The wider domain `better captures trailing edge pressures by allowing three-dimensional coherent structures to develop’ (Giannelis et al. Reference Giannelis, Vio and Levinski2017). Our recent work (Lusher, Sansica & Hashimoto Reference Lusher, Sansica and Hashimoto2024) applied ILES to assess
 sensitivity for the 2-D buffet instability on extruded 3-D periodic domains in the range
 . Domain widths at least as wide as the height of the separated boundary layer near the trailing edge (
 for the cases considered) were required to avoid aspect ratio sensitivity for the 2-D shock oscillations. Beyond the span-width sensitivity of the 2-D instability, a more severe limitation to be addressed is the inability of narrow-span simulations to capture features of 3-D buffet.
1.2. Two-dimensional and three-dimensional buffet features
Shock buffet is known to consist of both a 2-D chord-wise shock oscillation instability and 3-D cross-flow outboard propagating cellular separation patterns known as ‘buffet-cells’ (Iovnovich & Raveh Reference Iovnovich and Raveh2015). Two-dimensional buffet on turbulent aerofoils occurs in a frequency range of Strouhal numbers around
 $St = [0.06, 0.1 ]$
, while the 3-D instability for swept wings is found to have broadband energy content at three to ten times higher (Plante Reference Plante2020) frequencies. Previous RANS/stability-based studies predict near-simultaneous onset of 2-D- and 3-D-buffet (Paladini et al. Reference Paladini, Beneddine, Dandois, Sipp and Robinet2019; Crouch, Garbaruk & Strelets Reference Crouch, Garbaruk and Strelets2019). These studies were carried out on the widely used OAT15A and RA16SC1 aerofoil geometries. It is also important to note that these stability analyses were strictly homogeneous in the spanwise direction, i.e. 2.5-D rather than fully 3-D as used by He & Timme (Reference He and Timme2021). Furthermore, it was shown by Plante, Dandois & Laurendeau (Reference Plante, Dandois and Laurendeau2020) that, at least in the context of low-fidelity simulations, the frequency of the 3-D modes tend towards lower-frequencies for unswept wings. Whether the same behaviour is found in high-fidelity simulations without the influence of approximate turbulence models remains to be seen. Recent comparisons have been drawn between buffet cells and the qualitatively similar `stall-cell’ (Rodríguez & Theofilis Reference Rodríguez and Theofilis2011) phenomenon observed at low-speed and high-AoA largely separated flow conditions (Plante Reference Plante2020; Plante et al. Reference Plante, Dandois and Laurendeau2020). While transonic buffet typically occurs at angles of attack far below those seen in aerofoil stall applications, the adverse-pressure gradient imposed by the SBLI at transonic conditions can result in similarly large regions of flow separation on wings. While the 2-D buffet instability has been studied extensively by numerical simulations in recent years (Fukushima & Kawai Reference Fukushima and Kawai2018; Zauner & Sandham Reference Zauner and Sandham2020; Sansica et al. Reference Sansica, Loiseau, Kanamori, Hashimoto and Robinet2022; Nguyen et al. Reference Nguyen, Terrana and Peraire2022; Zauner, Moise & Sandham Reference Zauner, Moise and Sandham2022; Moise et al. Reference Moise, Zauner, Sandham, Timme and He2023; Song et al. Reference Song, Wong, Ghate and Lele2024), the picture is less clear for the 3-D instability which forms the focus of the present work.
In an attempt to explain the observed 2-D shock oscillations on aerofoils at transonic conditions, earlier studies proposed feedback loop models based on upstream and downstream travelling waves from the trailing edge and shock foot regions (Lee Reference Lee1990). More recent studies have linked the origins of transonic buffet to a global instability (Crouch et al. Reference Crouch, Garbaruk, Magidov and Travin2009; Sartor et al. Reference Sartor, Mettot and Sipp2015). In the case of a global instability, the onset of the unsteadiness is the result of a Hopf bifurcation (Crouch et al. Reference Crouch, Garbaruk, Magidov and Travin2009), and the instability is localised to the region around the shock and partially in the separated shear layer (Sartor et al. Reference Sartor, Mettot and Sipp2015). Despite further developments on the feedback loop model (Deck Reference Deck2005; Jacquin et al. Reference Jacquin, Molton, Deck, Maury and Soulevant2009; Hartmann, Feldhusen & Shroder Reference Hartmann, Feldhusen and Shroder2013), the explanation based on global stability remains the most pervasive, but does not fully clarify the mechanisms that lead to self-sustained shock oscillations. In this regard, Iwatani et al. (Reference Iwatani, Asada, Yeh, Taira and Kawai2023) recently used a resolvent analysis approach to argue that the shock-induced separation height and pressure dynamics around the shock wave both contribute to and maintain the self-sustained oscillations.
1.3. Characteristics of three-dimensional buffet
Three-dimensional buffet has been investigated both computationally (Sartor & Timme Reference Sartor and Timme2017; Timme Reference Timme2020; Sansica & Hashimoto Reference Sansica and Hashimoto2023; Houtman et al. Reference Houtman, Timme and Sharma2023) and with experiments (Sugioka et al. Reference Sugioka, Koike, Nakakita, Numata, Nonomura and Asai2018; Masini et al. Reference Masini, Timme and Peace2020; Reference Sugioka, Kouchi and Koike2021). Plante (Reference Plante2020) compiled a comprehensive summary of two- and three-dimensional buffet studies and their main features (see tables 1.3–1.6). Among the first studies of 3-D buffet characteristics include the works of Brunet & Deck (Reference Brunet and Deck2008) and Iovnovich & Raveh (Reference Iovnovich and Raveh2015). Iovnovich & Raveh (Reference Iovnovich and Raveh2015) applied URANS to swept infinite- and finite-wing configurations of the RA16SC1 aerofoil at transonic conditions. For low sweep angles, the buffet was found to be largely similar to 2-D buffet, dominated by chord-wise shock oscillations. As the sweep angle was increased, 3-D cellular separation patterns were observed, which the authors termed ‘buffet-cells’. Other comparable studies applied delayed detached-eddy simulation (DDES) methods to half-finite-wing body geometries (Sartor & Timme Reference Sartor and Timme2017), finding similar 3-D buffet features. The work of Hashimoto et al. (Reference Hashimoto, Ishida, Aoyama, Ohmichi, Yamamoto and Hayashi2018) applied a Zonal DES method to simulate 3-D buffet on the NASA Common Research Model (CRM) aircraft geometry, with good agreement found for the shock position when compared with experimental pressure sensitive paint data. Buffet-cells were also observed, which convected in the spanwise direction. Subsequent work (Ohmichi et al. Reference Ohmichi, Ishida and Hashimoto2018) applied modal decomposition methods to identify a broadband peak associated with the 3-D buffet-cell mode in the range
 $St= [0.2, 0.6 ]$
. A low-frequency mode corresponding to the main shock-oscillation was also found to be present at
 $St=0.06$
. Paladini et al. (Reference Paladini, Beneddine, Dandois, Sipp and Robinet2019) applied global stability analysis (GSA) to the OAT15A aerofoil geometry, comparing transonic buffet on configurations ranging from 2-D profiles to 3-D swept wings. The authors found both a 2-D buffet mode, consistent with that of Crouch et al. Reference Crouch, Garbaruk, Magidov and Travin(2009), and a low-wavenumber 3-D one. The 3-D mode was found to have zero frequency on unswept configurations, becoming unsteady at non-zero sweep angles. Predictions of the wavenumber and convection velocity of the 3-D buffet-cells agreed well with numerical and experimental results (Sugioka et al. Reference Sugioka, Koike, Nakakita, Numata, Nonomura and Asai2018).
More recently, Plante et al. Reference Plante, Dandois and Laurendeau(2020) performed URANS investigations of 3-D buffet on infinite swept wings, highlighting similarities between the cellular separation buffet-cells and those found at low-speed stall. At transonic conditions, analysis of the frequency content showed a superposition of both the 2-D buffet mode and a spanwise convecting 3-D mode consistent with the 3-D buffet-cell phenomenon. The three-dimensionality occurred on the infinite periodic wings without the introduction of any 3-D disturbance from the physical set-up. The frequency of the buffet-cells was observed to depend on the applied sweep angle. While buffet-cells have typically been reported within the intermediate Strouhal number range of
 $St= [0.2, 0.6 ]$
(Giannelis et al. Reference Giannelis, Vio and Levinski2017; Ohmichi et al. Reference Ohmichi, Ishida and Hashimoto2018), Plante et al. Reference Plante, Dandois and Laurendeau(2020) showed that, in the context of buffet on infinite wings with minor sweep angles (
 $\Lambda \leqslant 10^{\circ }$
), the 3-D mode can appear at frequencies below that of the 2-D shock oscillation. At zero-sweep (
 $\Lambda = 0^{\circ }$
), the flow was observed to be unsteady but irregular, with 3-D cellular perturbations on the surface streamlines and at the shock front. As the sweep angle was incrementally raised, the buffet-cells became regular, with a spanwise convection speed proportional to the applied tangential free stream speed. Compared with the broadband buffet spectra observed on full aircraft wings (Masini et al. Reference Masini, Timme and Peace2020), the infinite-wing configuration had a well-defined convection frequency. Complementary simulations at low-speed stall conditions showed similar cellular separation patterns across the span. For non-zero sweep angles, the stall-cells convected in a similar manner to those found during buffet. However, for zero sweep (
 $\Lambda = 0^{\circ }$
), the low-speed flow was observed to be steady, in contrast to the behaviour at buffet conditions. A follow-up study (Plante et al. Reference Plante, Dandois, Beneddine, Laurendeau and Sipp2021) expanded on the previous findings with the aid of global stability analysis. GSA predicted an unstable mode for both transonic buffet and low-speed stall, with a null frequency found at zero sweep. The mode became unsteady for increased sweep angle. While URANS and GSA predicted consistent wavelengths and frequencies in the context of stall-cells, discrepancies were found between the methods for buffet. Furthermore for buffet, the 3-D mode was identified at angles of attack below those required for onset of the 2-D instability, suggesting the 3-D features can occur without 2-D buffet being present, arguing that buffet-/stall-cells share the same origin.
Similar stability-based studies of 3-D buffet include those of Timme (Reference Timme2020) and He & Timme (Reference He and Timme2021). He & Timme (Reference He and Timme2021) applied tri-global stability analysis to infinite wings at high Reynolds number with aspect ratios ranging from  to 10. In addition to the 2-D spanwise-uniform oscillatory mode, a group of spatially periodic stationary shock-distortion modes were found for unswept flow with a wavenumber dependent on the aspect ratio of the wing. The modes became travelling waves for non-zero sweep over a broadband range of frequencies. Timme (Reference Timme2020) applied GSA to the wing-body-tail geometry of the NASA CRM at high Reynolds number for turbulent transonic flow. In contrast to previous findings on infinite straight and swept wings, Timme (Reference Timme2020) did not observe the same essentially 2-D long-wavelength mode on this more complex geometry. Instead, a single 3-D unstable oscillatory mode was observed, with outboard-propagating shock oscillations. Other notable examples of buffet on complex configurations include those of Sansica & Hashimoto (Reference Sansica and Hashimoto2023) and Tamaki & Kawai (Reference Tamaki and Kawai2024). GSA on a flight-Reynolds-number aircraft case was published, to the authors’ knowledge for the first time, by Sansica & Hashimoto (Reference Sansica and Hashimoto2023). The authors demonstrated the effectiveness of GSA for predicting buffet onset at flight-relevant flow conditions. In addition to a buffet-cell mode localised to the wing outboard region, side-of-body separation effects were also noted. Finally, with the aim of increasing the level of simulation fidelity that can be applied, Tamaki & Kawai (Reference Tamaki and Kawai2024) carried out the first wall-modelled large eddy simulation (WM-LES) of the NASA-CRM geometry at buffet conditions. The wavy shock wave structure associated with outboard-propagating buffet-cells was observed.
The main limitation of the existing literature on 3-D buffet is the widespread use of low-fidelity RANS-based methods and the associated difficulty they have in accurately modelling the kinds of unsteady SBLIs and highly separated flow that characterise transonic buffet. As shown by Thiery & Coustols (Reference Thiery and Coustols2006), predictions obtained by RANS-based solvers can be sensitive to different turbulence models. Giannelis et al. Reference Giannelis, Vio and Levinski(2017) further commented that URANS simulations exhibit high sensitivity to simulation parameters, turbulence model, and both the spatial and temporal discretisation methods used. Memmolo et al. Reference Memmolo, Bernardini and Pirozzoli(2018) compared URANS and DDES methods with scale-resolving ILES, for the V2C supercritical laminar wing. In contrast to classical large eddy simulations that explicitly introduce numerical dissipation via a sub-grid scale model, in the current work, the governing equations are solved directly, and dissipation is added from the shock-capturing scheme and filters. These methods are widely used and are often referred to as an `under-resolved direct numerical simulation (DNS)’ (Garnier et al. Reference Garnier, Mossi, Sagaut, Comte and Deville1999; Grinstein, Margolin & Rider Reference Grinstein, Margolin and Rider2007; Memmolo et al. Reference Memmolo, Bernardini and Pirozzoli2018; Fu Reference Fu2023) or, now usually referred to in the literature, as ILES (Grinstein et al. Reference Grinstein, Margolin and Rider2007). ILES typically uses finer meshes than those recommended for classical LES, and have been shown to be capable of matching strict-DNS data to within 1 % error at greatly reduced computational cost (Ritos, Kokkinakis & Drikakis Reference Ritos, Kokkinakis and Drikakis2018). In the context of transonic buffet, Zauner & Sandham (Reference Zauner and Sandham2020) showed ILES can faithfully reproduce aerodynamic coefficients and buffet characteristics compared with a full DNS, using coarser (ILES) grids than those used in the present study.
Owing to the extreme computational costs, examples of high-fidelity simulations of 3-D buffet are extremely sparse within the available literature. Additionally, they are usually limited to low Reynolds numbers (e.g.
 $Re=3 \times 10^4$
, (Fujino & Suzuki Reference Fujino and Suzuki2024)) and/or very narrow domains (
 ), which are insufficiently wide to observe 3-D buffet. A couple of notable exceptions include Zauner & Sandham (Reference Zauner and Sandham2020) and Moise et al. Reference Moise, Zauner and Sandham(2022), who simulated moderate Reynolds number buffet (
 $Re = 5 \times 10^5$
) up to
 . These examples, however, were only performed for fully untripped laminar buffet, with a limited exploration of the parameter space. No 3-D buffet effects were observed. The present contribution extends the literature by performing high-fidelity ILES buffet on aspect ratios up to
 for the first time. A moderate Reynolds number of
 $Re = 5 \times 10^5$
is selected with numerical boundary-layer tripping applied to obtain the fully turbulent conditions which are more relevant to the high-Reynolds-number real-world limit.
1.4. Structure of the present study
The present contribution is organised as follows. Sections 2.1 and 2.2 give brief overviews of the OpenSBLI (Lusher et al. Reference Lusher, Jammy and Sandham2018, Reference Lusher, Jammy and Sandham2021) and FaSTAR (Hashimoto et al. Reference Hashimoto, Murakami, Aoyama, Ishiko, Hishida, Sakashita and Lahur2012; Ishida et al. Reference Ishida, Ishiko, Hashimoto, Aoyama and Takekawa2016) CFD solvers used to perform the simulations in this work. Section 2.3 describes the NASA-CRM infinite wing geometry used and associated grid metrics. Section 2.4 completes the problem specification with details of the flow conditions and numerical tripping method. Section 2.5 outlines the methodology used for the SPOD analysis. For the results in § 3, baseline high-fidelity (ILES) simulations of transonic buffet on wide-span ( ) aerofoils are presented close to buffet onset conditions at an AoA of
 $\alpha ={5}^{\circ }$
. GSA of this configuration by Lusher et al. (Reference Lusher, Sansica and Hashimoto2024) at the same flow conditions predicted onset to occur at an AoA of
 $\alpha ={4.5}^{\circ }$
. The initial results are cross-validated to URANS solutions to demonstrate agreement between the two solvers and simulation methods applied. A final case of
 is shown via URANS in an attempt to observe possible 3-D-buffet behaviour on very wide domains. The ILES configuration at aspect ratio of
 is then extended to higher angles of incidence of
 $\alpha ={6}^{\circ }$
and
 $\alpha ={7}^{\circ }$
in § 4, to observe the effect of AoA on 3-D buffet. Aspect ratio effects are investigated in § 5, contrasting buffet on narrow (
 ) to very wide (
 ) domains at a fixed angle of attack. Section 6.1 investigates sectional evaluation of aerodynamic quantities at
 and
 to demonstrate deviation from span-averaged quantities due to 3-D buffet. Finally, § 6.2 performs SPOD-based modal decompositions at
 and
 to identify dominant modes and their relation to 2-D and 3-D buffet. Further discussion and conclusions are given in § 7.
2. Computational method
2.1. OpenSBLI high-fidelity (ILES/DNS) solver
All high-fidelity simulations in this work were performed in OpenSBLI (Lusher et al. Reference Lusher, Jammy and Sandham2021, Reference Lusher, Sansica, Sandham, Meng, Siklósi and Hashimoto2025), an open-source high-order compressible multi-block flow solver on structured curvilinear meshes. OpenSBLI was developed at the University of Southampton (Lusher et al. Reference Lusher, Jammy and Sandham2018, Reference Lusher, Jammy and Sandham2021) and the Japan Aerospace Exploration Agency (JAXA) (Lusher et al. Reference Lusher, Zauner, Sansica and Hashimoto2023, Reference Lusher, Sansica, Sandham, Meng, Siklósi and Hashimoto2025) to perform high-speed aerospace research, with a focus on fluid flows involving shock wave/boundary layer interactions (SBLIs) (Lusher & Sandham Reference Lusher and Sandham2020a,Reference Lusher and Sandham b). The code is freely available to the community, with the most recent code release described by Lusher et al. (Reference Lusher, Sansica, Sandham, Meng, Siklósi and Hashimoto2025). Written in Python, OpenSBLI uses symbolic algebra to automatically generate a complete finite-difference CFD solver in the Oxford parallel structured (OPS) (Reguly et al. Reference Reguly, Mudalige, Giles, Curran and McIntosh-Smith2014, Reference Reguly, Mudalige and Giles2018) domain-specific language (DSL). The OPS library is embedded in C/C++ code, enabling massively parallel execution of the code on a variety of high-performance-computing architectures via source-to-source translation, including GPUs. OpenSBLI was recently cross-validated against six other independently developed flow solvers using a range of different numerical methodologies by Chapelier et al. (Reference Chapelier2024).
The base governing equations are the non-dimensional compressible Navier–Stokes equations for an ideal fluid. Applying conservation of mass, momentum and energy, in the three spatial directions
 $x_i$
 $ (i=0, 1, 2 )$
, results in a system of five partial differential equations to solve. These equations are defined for a density
 $\rho$
, pressure
 $p$
, temperature
 $T$
, total energy
 $\rho E$
and velocity components
 $u_k$
as
 \begin{align} \frac {\partial \rho }{\partial t} &+ \frac {\partial }{\partial x_k} \left (\rho u_k \right ) = 0, \end{align}
 \begin{align} \frac {\partial }{\partial t}\left (\rho u_i\right ) &+ \frac {\partial }{\partial x_k} \left (\rho u_i u_k + p \delta _{ik} - \tau _{ik}\right ) = 0, \end{align}
 \begin{align} \frac {\partial }{\partial t}\left (\rho E\right ) &+ \frac {\partial }{\partial x_k} \left (\rho u_k \left (E + \frac {p}{\rho }\right ) + q_k - u_i \tau _{ik}\right ) = 0, \end{align}
with heat flux
 $q_k$
and stress tensor
 $\tau _{ij}$
defined as
 \begin{equation} q_k = \frac {-\mu }{\left (\gamma - 1\right ) M_{\infty }^{2} Pr Re}\frac {\partial T}{\partial x_k}, \quad \tau _{ik} = \frac {\mu }{Re} \left (\frac {\partial u_i}{\partial x_k} + \frac {\partial u_k}{\partial x_i} - \frac {2}{3}\frac {\partial u_j}{\partial x_j} \delta _{ik}\right ). \end{equation}
Here,
 $Pr$
,
 $Re$
and
 $\gamma =1.4$
are the Prandtl number, Reynolds number and ratio of specific heat capacities for an ideal gas, respectively. Support for curvilinear meshes is provided by using body-fitted meshes with a coordinate transformation. The equations are non-dimensionalised by a reference velocity, density and temperature
 $ (U^{*}_{\infty }, \rho ^{*}_{\infty }, T^{*}_{\infty } )$
. In this work, the reference conditions are taken as the free stream quantities. For a reference Mach number
 $M_{\infty }$
, the pressure is defined as
 \begin{equation} p = \left (\gamma - 1\right ) \left (\rho E - \frac {1}{2} \rho u_i u_i\right ) = \frac {1}{\gamma M^{2}_{\infty }} \rho T. \end{equation}
Temperature-dependent shear viscosity is evaluated with Sutherland’s law such that
 \begin{equation} \mu (T) = T^{\frac {3}{2}}\frac {1 + C_{\textrm {Suth}}}{T + C_{\textrm {Suth}}}, \end{equation}
with
 $C_{\textrm {Suth}} = T_{S}^{*} / T_{\infty }^{*}$
, for
 $T_{S}^{*} = 110.4K$
and reference temperature of
 $T_\infty ^{*} = 273.15$
. Skin friction is defined for a wall shear stress
 $\tau _w$
as
 \begin{equation} C_f = \frac {\tau _w}{0.5 \rho _{\infty }^{*} U_{\infty }^{*2}}. \end{equation}
The lift coefficient is evaluated over the aerofoil surface with arc-length
 $s_{total}$
as
 \begin{equation} C_L = \frac {1}{0.5\rho _{\infty }^{*} U_{\infty }^{*2}}\int _{s=0}^{s=s_{total}} -S(p_w - p_{\infty }) \left |\cos (\theta ) \right | \,\rm d\it s, \end{equation}
where
 $\theta$
is the inclination angle at the surface, and
 $p_w$
and
 $p_{\infty }$
are the wall and free stream pressures, respectively. The
 $S$
term represents the sign of the grid metrics depending on whether the coordinate around the aerofoil is increasing/decreasing with respect to the grid index, to give the appropriate force contributions from the pressure/suction side of the aerofoil. Aerodynamic quantities are averaged in time and the spanwise direction, unless otherwise stated.
OpenSBLI is explicit in both space and time, with a range of different discretisation options available to users. Spatial discretisation is performed in this work by fourth-order central differences recast in a cubic split form (Coppola et al. Reference Coppola, Capuano, Pirozzoli and de Luca2019) to boost numerical stability. Time-advancement is performed by a fourth-order five-stage low-storage Runge–Kutta scheme (Carpenter & Kennedy Reference Carpenter and Kennedy1994). The non-dimensional time step is set as
 $\Delta t = 5\times 10^{-5}$
for all ILES cases. Dispersion relation preserving (DRP) filters (Bogey & Bailly Reference Bogey and Bailly2004) are applied to the free stream using a targeted filter approach which turns the filter off in well-resolved regions to further reduce numerical dissipation (Lusher et al. Reference Lusher, Zauner, Sansica and Hashimoto2023). The DRP filters are also only applied once every 25 iterations. Shock-capturing is performed via weighted essentially non-oscillatory (WENO) schemes, specifically the fifth-order WENO-Z variant by Borges et al. (Reference Borges, Carmona, Costa and Don2008). The effectiveness and resolution of the underlying shock-capturing schemes in OpenSBLI was assessed for the compressible Taylor–Green vortex case involving shock waves and transition to turbulence by Lusher & Sandham (Reference Lusher and Sandham2021) and for compressible wall-bounded turbulence by Hamzehloo et al. (Reference Hamzehloo, Lusher, Laizet and Sandham2021). The shock-capturing scheme is applied within a characteristic-based filter framework (Yee, Sandham & Djomehri Reference Yee, Sandham and Djomehri1999; Yee & Sjögreen Reference Yee and Sjögreen2018). The dissipative part of the WENO-Z reconstruction is applied at the end of the full time step to capture shocks based on a modified version of the Ducros sensor (Ducros et al. Reference Ducros, Ferrand, Nicoud, Weber, Darracq, Gacherieu and Poinsot1999; Bhagatwala & Lele Reference Bhagatwala and Lele2009). In addition to the validation and verification cases contained within the code releases (Lusher et al. Reference Lusher, Jammy and Sandham2021), the numerical methods in OpenSBLI were also recently validated for turbulent channel- and counter-flows by Lusher & Coleman (Reference Lusher and Coleman2022); Hamzehloo, Lusher & Sandham (Reference Hamzehloo, Lusher and Sandham2023), laminar-transitional buffet cases on the V2C aerofoil geometry by Lusher et al. (Reference Lusher, Zauner, Sansica and Hashimoto2023), and against URANS and Global Stability Analysis (GSA) on the NASA-CRM aerofoil geometry by Lusher et al. (Reference Lusher, Sansica and Hashimoto2024).
2.2. FaSTAR low-fidelity (URANS) solver
Comparisons to the high-fidelity ILES data are provided by the FaSTAR unstructured mesh CFD solver (Hashimoto et al. Reference Hashimoto, Murakami, Aoyama, Ishiko, Hishida, Sakashita and Lahur2012; Ishida et al. Reference Ishida, Ishiko, Hashimoto, Aoyama and Takekawa2016) developed at JAXA. A cell-centred finite volume method is used for the spatial discretisation of the compressible 3-D RANS equations. The numerical fluxes are computed by the Harten–Lax–van Leer–Einfeldt–Wada (HLLEW) scheme (Obayashi & Guruswamy Reference Obayashi and Guruswamy1995) and the weighted Green–Gauss method is used for the gradient computation (Mavriplis Reference Mavriplis2003). For the mean flow and turbulent transport equations, the spatial accuracy is set to the second- and first-order, respectively. The turbulence model selected for the present simulations is the Spalart–Allmaras turbulence model (Spalart & Allmaras Reference Spalart and Allmaras1992) without the
 $f_{t2}$
term (SA-noft2) and with rotation/curvature corrections (SA-noft2-RC) (Shur et al. Reference Shur, Strelets, Travin and Spalart2000). No-slip velocity and adiabatic temperature boundary conditions are imposed on the wing walls; far-field boundary conditions are employed at the outer boundaries and the angle of attack is applied to the incoming flow.
For the unsteady RANS calculations, dual-time stepping (Visbal & Gordnier Reference Visbal and Gordnier2000) is used to improve the accuracy of the implicit time integration method. The lower/upper symmetric Gauss–Seidel (LU-SGS) scheme (Sharov & Nakahashi Reference Sharov and Nakahashi1998) is used for the pseudo-time sub-iterations and the physical derivative is second-order in time by using the three-point backward difference. All URANS calculations are advanced in time with a global time integration step of
 $\Delta t = 0.005$
(corresponding to a dimensional time step
 $\Delta t^*= 1.48 \times 10^{-{5}}\: s$
) and 40 sub-iterations for the pseudo-time integration of the dual time stepping method.
2.3. Geometry and mesh configuration
NASA-CRM-65 (NASA-LaRC 2012) aerofoil meshes used in this study at
 $\alpha ={5}^{\circ }$
. The ILES grid is a C-mesh and two wake blocks, with boundary-layer trips placed at
 $0.1c$
(pink). The URANS grid is a single block O-mesh. The ILES and URANS grids are plotted in the main figure at every seventh and fifth grid line, respectively.
 $100\times$
zoom-insets are shown at the trailing edge (TE) and wake 5 % chord downstream of the TE.

The selected geometry is the 65 % semi-span station of the NASA-CRM wing, commonly used for turbulent transonic buffet research. The NASA-CRM profile is openly provided with both blunt and sharp trailing edge configurations as standard (NASA-LaRC 2012). Two-dimensional body-fitted structured meshes are created in Pointwise™. The 3-D mesh is generated by extruding the 2-D grid in the spanwise direction with uniform spacing. Figure 1(a,b) shows the meshes used by the ILES simulations in OpenSBLI and URANS simulations in FaSTAR, plotted at every seventh and fifth line, respectively, for visualisation purposes in the main figure.
 $100\times$
zoom-insets are shown for the trailing edge mesh, and the wake mesh 5 % chord downstream of the trailing edge. The 10 % chord trip location for the ILES is marked on the figure, whereas the URANS-based solutions are considered to be fully turbulent with no fixed transition location.
In the case of OpenSBLI, an aerofoil C-mesh is connected to two wake blocks with a sharp trailing edge configuration. A comparison of progressively blunter rounded trailing edges and variations of sharp trailing edges was shown for transonic aerofoils by Lusher et al. (Reference Lusher, Zauner, Sansica and Hashimoto2023). The in-flow boundary is set at a distance of
 $25c$
with the outlet
 $5c$
downstream of the aerofoil. The inflow is set to be uniform
 $U_{\infty }=1$
, with the angle of attack prescribed by rotating the aerofoil within the mesh. For each case, the near-wake mesh is also slightly modified to take into account the deflection of the wake based on the AoA. In the
 $\xi$
and
 $\eta$
directions clockwise around the aerofoil and normal to the surface, the aerofoil and wake blocks have
 $ (2249, 681 )$
and
 $ (701, 681 )$
points, respectively. Around the aerofoil, the pressure and suction sides have 500 and 1749 points in the
 $\xi$
direction, respectively. The
 $\xi$
distribution is refined in the range
 $0.3 \lt x \lt 0.6$
on the suction side to improve the resolution at the main shock wave and SBLI. A spanwise grid study at buffet conditions was presented on the same CRM configuration as used here by Lusher et al. (Reference Lusher, Sansica and Hashimoto2024), with the medium spanwise resolution of
 $\Delta z = 0.001$
selected for the wide-span cases in this work to make aspect ratios of
 computationally feasible. Upstream of the main shock wave at
 $x=0.4$
, the grid has wall units of
 $ (\Delta x^{+} , \Delta y^{+}, \Delta z^{+} ) = (6.1, 2.2, 14.8 )$
and, in the attached turbulent region downstream of the shock, reaches a maximum at
 $x=0.7$
of
 $ (\Delta x^{+} , \Delta y^{+}, \Delta z^{+} ) = (3.9, 1.1, 7.6 )$
. In addition to wall criteria, it is important to maintain good resolution throughout the entire boundary layer by applying only weak grid stretching. At
 $x=0.4$
and
 $x=0.7$
, there are 80 and 195 points in the boundary layer, respectively. Additional sensitivity tests to outlet length and
 $(x-y)$
mesh resolution were given in the appendix of Lusher et al. (Reference Lusher, Sansica and Hashimoto2024). The results were found to be insensitive to outlets between
 $5c$
and
 $20c$
in length. For the
 $(x-y)$
mesh sensitivity, the buffet characteristics and aerodynamic quantities on coarser meshes were found to be consistent with those on finer meshes.
In the case of the cell-centred finite volume FaSTAR solver, the blunt trailing-edge version of the CRM wing is used. The numerical mesh is obtained by first defining the distribution of cells around the aerofoil and then by normal extrusion to obtain a single block O-grid. The number of cells in the
 $\xi$
and
 $\eta$
directions is
 $ (1050, 162 )$
. The distribution around the aerofoil consists of
 $600$
and
 $400$
cells on suction and pressure sides, respectively, and
 $50$
cells are used to discretise the blunt trailing edge. A region of chord-wise width equal to
 $0.2 c$
is refined around the shock and counts
 $200$
cells. To account for different shock locations, this refinement region changes chord-wise position depending on the angle of attack. The domain boundaries extend to approximately
 $100$
chords from the aerofoil in all directions. The O-grid is extruded in the spanwise direction to a target aspect ratio (
 or
 $6$
) that is discretised by using 20 cells per chord. To appreciate the different computational costs of ILES and URANS, simulating one period of the low-frequency buffet cycle with the current numerical set-up takes approximately
 $8.6 \times 10^6$
CPU core-hours for the
 ILES case and
 $3.2\times 10^3$
CPU core-hours for the URANS calculation. For the full integration time of the most expensive
 ILES result (table 1), a total of 66.4 million core-hours was used for this single case.
Summary of wide-span buffet ILES cases at post-buffet onset AoA (
 $\alpha ={5}^{\circ }$
), moderate AoA (
 $\alpha ={6}^{\circ }$
) and high AoA (
 $\alpha ={7}^{\circ }$
) conditions. For each case, Reynolds and Mach numbers are fixed at
 $Re=5 \times 10^{5}$
and
 $M_{\infty }=0.72$
, with tripping amplitude
 $A=7.5\times 10^{-1}$
to obtain turbulent conditions. Aspect ratio wings between
 and
 are considered with ILES. Mean aerodynamic coefficients, RMS of lift oscillations and two-dimensional buffet Strouhal number are shown for each case.

2.4. Flow parameters, computational set-up and initial conditions
All simulations were performed at a moderate Reynolds number of
 $Re=500\,000$
based on aerofoil chord length and free stream Mach number of
 $M_\infty =0.72$
. For initialisation, an initial narrow-span (
 $AR=0.05$
) ILES simulation at a given AoA is advanced from uniform flow conditions for 20 convective time units until the boundary layer is fully turbulent and the buffet unsteadiness fully develops. These solutions are then extruded in the spanwise direction to initialise the wide-span cases (
 $AR=1,2,3$
). White noise is added once within the boundary layer in the restart file to help break any symmetries.
To investigate turbulent transonic buffet, numerical tripping must be applied to the oncoming boundary layer to promote a fast transition to turbulence upstream of the shock wave. This is achieved by forcing a time-varying spanwise modulated blowing/suction strip near the leading edge of the aerofoil. This type of forcing is commonly used in CFD research as a method to mimic arrays of tripping dots used in experiments (Sugioka et al. Reference Sugioka, Koike, Nakakita, Numata, Nonomura and Asai2018, Reference Sugioka, Kouchi and Koike2022). The forcing strip is centred around the
 $0.1c$
location on both the suction and pressure sides of the aerofoil. The forcing is applied to the wall-normal velocity component, which is then multiplied with the wall density to set the momentum and total energy on the wall. Outside of the forcing strip, the wall is a standard isothermal no-slip viscous boundary condition. The forcing is taken to be a modified form of that given by Moise et al. (Reference Moise, Zauner, Sandham, Timme and He2023) as
 \begin{equation} \rho v_w= \rho _w \sum _{i=1}^3 A \exp \left (-\frac {\left (x-x_t\right )^2}{2 \sigma ^2}\right ) \sin \left (\frac {k_i z}{0.05c}\right ) \sin \left (\omega _i t+\Phi _i\right ), \end{equation}
for simulation time
 $t$
, trip location
 $x_t$
and Gaussian scaling factor
 $\sigma =0.00833$
. The three modes
 $ (0, 1, 2 )$
have spatial wavenumbers of
 $k_i = (6\pi , 8\pi , 8\pi )$
, phases
 $\Phi _i = (0, \pi , -\pi /2 )$
and temporal frequencies of
 $\omega _i = (26, 88, 200 )$
. The tripping strength is set to
 $7.5\%$
of the free stream (
 $A=0.075$
), to initiate the transition to turbulence. The sensitivity of the 2-D buffet instability to this tripping strength parameter was investigated in our recent previous work (Lusher et al. Reference Lusher, Sansica and Hashimoto2024) over a range of
 $0.5\,\%$
to
 $10\,\%$
of free stream velocity. It was found that for
 $5\,\%$
and above, fully turbulent interactions were obtained, with identical buffet frequencies observed in the range of
 $A= [5\,\%, 7.5\,\%, 10\,\% ]$
and only minor variation in mean
 $C_L$
. For weaker tripping, transitional and laminar buffet interactions were observed. In the context of the present work, the
 $A=7.5\,\%$
tripping is used throughout to produce fully turbulent conditions for the investigation of wide-span 3-D buffet effects.
2.5. Spectral proper orthogonal decomposition (SPOD) methodology
Modal decomposition methods are widely used analysis techniques that have seen ever-increasing application to fluid flow problems in recent years (Taira et al. Reference Taira, Brunton, Dawson, Rowley, Colonius, McKeon, Schmidt, Gordeyev, Theofilis and Ukeiley2017). These methods extract a variety of representative flow structures (or modes) that can be used for the identification/extraction of dominant physical mechanisms or for the construction of reduced-order models to represent the complex flow field (Taira et al. Reference Taira, Brunton, Dawson, Rowley, Colonius, McKeon, Schmidt, Gordeyev, Theofilis and Ukeiley2017). One popular example of a modal decomposition method is the frequency-resolved spectral proper orthogonal decomposition (SPOD) (Towne, Schmidt & Colonius Reference Towne, Schmidt and Colonius2018), which decomposes the flow into a series of orthogonal modes ranked by their importance in the frequency domain. The SPOD algorithm has recently been applied to OpenSBLI data by Hamzehloo et al. (Reference Hamzehloo, Lusher and Sandham2023).
In this work, the open-source Python-based SPOD library, PySPOD (Mengaldo & Maulik Reference Mengaldo and Maulik2021), has been coupled to OpenSBLI and used for the SPOD analyses presented in § 6.2. The implementation has recently been validated against reference data from the literature by Lusher et al. (Reference Lusher, Sansica, Sandham, Meng, Siklósi and Hashimoto2025). The flow fields extracted from OpenSBLI during unsteady calculations have been formatted and provided as input to the PySPOD library. For each case, side
 $x$
–
 $y$
plane (at
 $z=L_z/2$
) and
 $x$
–
 $z$
surface or near surface (at the first point off the wall) datasets are processed independently. While side
 $x$
–
 $y$
plane data include near- and off-body regions, the
 $x$
–
 $z$
surface or near surface data only consider contributions from pressure and suction sides of the aerofoil. For each dataset, the SPOD analysis is performed on different flow variables separately. The flow variables selected are pressure/wall-pressure (for both side plan and surface data) and w-velocity component (for near-surface data only). Initial transients are removed from each dataset and for all cases presented here, the flow field sampling period is
 $\Delta T_{SPOD,sampling} = 1000\Delta t$
. For the
 $AR=3$
case, the near-wall and side-view 2-D-plane snapshots occupy
 $\sim 4.1\,\mathrm{TB}$
of storage at this frequency. The chosen sampling frequency provides an upper frequency resolution of
 $St = 10$
, which is sufficient for the phenomena we investigate (typically, 2-D buffet,
 $St \leqslant 0.1$
; intermediate separation bubble modes,
 $St \sim 0.5$
; wake modes,
 $St \sim 1 - 5$
) (Moise et al. Reference Moise, Zauner, Sandham, Timme and He2023).
The datasets are all divided into three segments with 50 % overlap. To enforce periodicity in each segment, a Hanning function is applied. When analysing the results, the SPOD eigenvalue frequency spectra are plotted only for the first SPOD mode and compared with the PSD of the lift-coefficient fluctuations. The SPOD modes selected for visualisation and discussions are chosen based on considerations on the SPOD spectra and their relevance with respect to the lift-coefficient fluctuations PSD. These will be specified in the dedicated sections for each case. For visualisation purposes, real and imaginary parts of the SPOD modes have been used to reconstruct the mode temporal evolution. The visualised modes correspond to the time instance within the corresponding period for which a positive maximum value of the mode is reached at
 $(x,y,z)=(0.5, y_{{wall}}, L_z/2)$
.
3. Investigating wide-span transonic buffet close to 2-D onset conditions (
 $\alpha ={5}^{\circ }$
)

Example instantaneous ILES flow-field for the NASA-CRM wing geometry at an aspect ratio of  . For the baseline case of
 $\alpha ={5}^{\circ }$
, showing spanwise velocity contours at
 $\textit{w} = \pm 0.075$
, coloured by Mach number, transition to turbulence is observed downstream of the numerical trip location at
 $10\,\%$
of chord length. The boundary layer thickens due to the adverse pressure gradient imposed by the main shock wave.

In our recent work (Lusher et al. Reference Lusher, Sansica and Hashimoto2024), turbulent transonic buffet was investigated on the same NASA-CRM configuration used here at
 $Re=5\times 10^5$
, albeit for narrow to medium span-widths in the range
 . Domain sensitivity was observed for
 $AR \lt 0.1$
, for which the flow was shown to be overly constrained for the narrowest domains. The main sensitivities were observed at the main shock location and in the pressure fluctuations at the trailing edge which were overestimated compared with the wider domains. It was found that while there were differences in lift amplitudes, pressure distributions and skin-friction, all domain widths still reproduced the same low-frequency buffet oscillation of
 $St\approx 0.078$
when the AoA was moderate (
 $\alpha ={5}^{\circ }$
) and close to onset (
 $\alpha = 4.5^{\circ }$
). In this section, the previous work is first extended to a baseline wide-span high-fidelity ILES case of
 $\alpha ={5}^{\circ }$
and
 , to search for 3-D buffet effects. Comparison is made between ILES and URANS to cross-validate the two solvers. The baseline ILES width is then doubled to
 . This aspect ratio is approximately 40 times wider than commonly used in previous high-fidelity buffet studies (e.g.
 , Garnier & Deck Reference Garnier, Deck, Deville, Le and Sagaut2013;
 , Moise et al. Reference Moise, Zauner, Sandham, Timme and He2023; and
 , Fukushima & Kawai Reference Fukushima and Kawai2018; Nguyen et al. Reference Nguyen, Terrana and Peraire2022). Comparison is made with URANS at
 in Appendix A, to check the limiting behaviour of buffet at these conditions on an extremely wide domain.
Figure 2 shows an instantaneous snapshot of the NASA-CRM wing profile to be investigated. The plot shows spanwise w-velocity contours coloured by Mach number for the baseline ILES case of  and
 $\alpha ={5}^{\circ }$
. A well-captured terminating normal shock wave is observed in the Mach number contours on the back panel. The numerical trip equation (2.9) at
 $x=0.1c$
can be seen to cause a rapid transition to turbulence far upstream of the main SBLI. As in many experimental campaigns, the numerical tripping enables us to investigate buffet interactions at turbulent conditions despite the moderate Reynolds numbers used. Small-scale coherent structures introduced at the forcing location break down to turbulence rapidly and become uncorrelated. Thickening of the boundary layer is observed due to the adverse pressure gradient imposed by the main shock wave. The shock wave position is unsteady and, as we will see, oscillates at low frequency along the suction side of the aerofoil. Previous computational studies of wide-span buffet have been limited to low-fidelity URANS/DDES methods with the well-known issues (sensitivity to turbulence model, time-stepping parameters and difficulty with highly separated flows) associated with these methods. While wall-modelled (WMLES)-type simulations of buffet such as the impressive study by Tamaki & Kawai (Reference Tamaki and Kawai2024) on the NASA-CRM full-aircraft should also be considered high-fidelity (given their scale-resolving capabilities), we note that the ILES cases presented in this work do not make use of any wall model and therefore have stronger grid requirements. The finest grid in their cutting-edge WM-LES simulation used
 $N\sim 9\times 10^9$
cells for a full aircraft, whereas we have essentially the same cell count concentrated into a simple infinite wing segment. Furthermore, relatively long integration times are simulated here to capture multiple low-frequency buffet cycles and enable modal analysis techniques. In this sense, if we limit the discussion to infinite wing configurations at moderate Reynolds numbers, the current contribution is, as far as we are aware, the first set of DNS-like resolution high-fidelity scale-resolving simulations targeting wide-span 3-D buffet.
Low- to high-fidelity cross-validation of buffet characteristics for simulations using two different solvers and methods at the baseline angle of attack of
 $\alpha ={5}^{\circ }$
, showing strong agreement for the unsteady (a) lift coefficient, (b) drag coefficient and (c) PSD of lift fluctuations between the ILES and URANS solution methods.

Before proceeding to the main ILES results, it is important to first cross-validate the two solvers and methods. Our previous work (Lusher et al. Reference Lusher, Sansica and Hashimoto2024) performed GSA to determine onset criteria for the 2-D buffet shock oscillations of
 $\alpha = 4.5^{\circ }$
. This GSA prediction was found to agree very well with both subsequent ILES and URANS cases, which simulated flow conditions of
 $\alpha =4^{\circ }$
(no buffet observed) and
 $\alpha ={5}^{\circ }$
(buffet observed). We begin the present work at the same angle of incidence of
 $\alpha ={5}^{\circ }$
, where strong buffet is observed close to its onset. Figure 3(a–c) shows unsteady lift coefficient, drag coefficient and power spectral density (PSD) of lift fluctuations between the two methods at
 . Good agreement is found between the two solvers, with both reproducing the low-frequency buffet phenomena despite the differences between the fully turbulent URANS modelling and tripped transition ILES approaches. Mean lift and drag from ILES and URANS match very well, with only 2.4 % and 0.5 % relative error, respectively.
Instantaneous streamwise velocity at a distance of 0.3 % chord from the suction side surface of the aerofoil, showing the
 $\alpha ={5}^{\circ }$
flow during the (a,b) upstream low-lift shock-wave position and (c,d) downstream high-lift shock-wave position, at (a,c)
 and (b,d)
 . The dashed black line represents the low-lift shock position.

ILES cases of wide-span buffet at  and
 for a moderate angle of attack of
 $\alpha ={5}^{\circ }$
. (a) Lift coefficient, (b) PSD of lift fluctuations, (c) time- and span-averaged pressure coefficient, and (d) time- and span-averaged skin-friction.

The baseline AR100-AoA5 case pictured in figure 2 was first monitored at different stages of the buffet cycle and was observed to remain essentially 2-D throughout. While the turbulent boundary layer is certainly 3-D, no significant large-scale variations were observed across the spanwise width. As in the narrow-to-medium domain width cases  presented by Lusher et al. (Reference Lusher, Sansica and Hashimoto2024) on the same configuration and angle of incidence (
 $\alpha ={5}^{\circ }$
), the spanwise shock-front remains perpendicular to the free stream and no 3-D effects are observed. Although buffet is present, it is limited to only the 2-D chord-wise shock oscillations. To assess whether this is simply due to an insufficiently wide span, a second case was performed at
 . The purpose of this is to investigate whether the lack of 3-D effects at this AoA is simply due to an AoA dependence on the wavelength of the spanwise perturbation, with potentially wider aspect ratios required to see its onset at
 $\alpha ={5}^{\circ }$
.
Figure 4 shows instantaneous streamwise velocity contours within the boundary layer on the suction side of the aerofoil. The AR100-AoA5 and AR200-AoA5 cases are shown alongside one another. The lighter colouring of the velocity contours in the bottom panels show the acceleration of the flow to higher speeds as the shock moves farther back on the aerofoil at the point of maximum lift generation (figure 5
a). The flow separates at the low-lift phase as the shock wave moves upstream. The dashed black line indicates the shock position during the low-lift phase for reference between the instantaneous snapshots which are separated by a phase of
 $t_{\textrm {buffet}}/2$
. The flow is observed to still be essentially 2-D, with no spanwise variation of the shock position nor cellular structures present. Despite the wider spans of
 and
 in this work, the flow at this AoA is still visibly similar to the 2-D structure observed at lower aspect ratios (
 $0.025 \leqslant AR \leqslant 0.5$
; Lusher et al. Reference Lusher, Sansica and Hashimoto2024). The shock wave traverses only in the streamwise direction at the low-frequency buffet condition, with no discernible 3-D effects across the span. The terminating shock position remains perpendicular to the free stream, with the buffet phenomenon remaining essentially 2-D at these flow conditions.
Figure 5 shows a comparison of aerodynamic coefficients for the cases at  and
 . The mean lift varies by no more than 0.04 % with the doubling of the aspect ratio, with almost identical spectra seen between the cases. There are very minor differences between the unsteady lift curves at the extrema of high- and low-lift. These cycle-to-cycle variations are far smaller than commonly observed between buffet periods in other high-fidelity studies (Zauner & Sandham Reference Zauner and Sandham2020; Moise et al. Reference Moise, Zauner, Sandham, Timme and He2023; Song et al. Reference Song, Wong, Ghate and Lele2024). Furthermore, essentially perfect agreement is observed for the span-averaged pressure and skin-friction distributions in figures 5(c) and 5(d) despite the wider aspect ratio. The first two ILES cases at
 $\alpha ={5}^{\circ }$
have shown that despite simulating aspect ratios in excess of the wavelength previously seen for buffet-/stall-cell phenomena (
 $\lambda = 1-1.5$
; Giannelis et al. Reference Giannelis, Vio and Levinski2017; Paladini et al. Reference Paladini, Beneddine, Dandois, Sipp and Robinet2019; Plante Reference Plante2020; Plante et al. Reference Plante, Dandois and Laurendeau2020), we are able to isolate a wide-span transonic aerofoil case that possesses clear 2-D chordwise buffet shock- and lift-oscillations, while showing no evidence of span-width sensitivity nor loss of two-dimensionality. To further check the two-dimensionality of the
 $\alpha ={5}^{\circ }$
solution, the
 URANS (figure 3) is extended in Appendix A to assess whether the
 ILES domain is simply still too narrow to accommodate 3-D buffet effects. However, the
 $\alpha ={5}^{\circ }$
condition still remains essentially 2-D up to
 . Therefore, having identified several wide-span cases at
 $\alpha ={5}^{\circ }$
that possess 2-D buffet but show no 3-D effects, the next section increases the angle of incidence with ILES to
 $\alpha ={6}^{\circ }$
and
 $\alpha ={7}^{\circ }$
for a fixed aspect ratio of
 .
4. Sensitivity to increased angle of attack for wide-span transonic buffet at

ILES cases of wide-span buffet at  for angles of attack of
 $\alpha ={5}^{\circ }$
,
 $\alpha ={6}^{\circ }$
and
 $\alpha ={7}^{\circ }$
, showing (a) lift coefficient, (b) PSD of lift fluctuations, (c) time- and span-averaged pressure coefficient, and (d) time- and span-averaged skin-friction.

In this section, the effect of increased angle of attack is investigated at  with ILES. Figure 6 shows the aerodynamic coefficients for cases AR200-AoA6 and AR200-AoA7, with comparison to AR200-AoA5. The first feature to note is that, in contrast to the regular periodic oscillations of the
 $\alpha ={5}^{\circ }$
case, the higher AoAs begin to show irregularity in the buffet amplitudes and phase from period to period. Both cases were initialised by extruding fully developed narrow-span solutions across the span at their respective angles of attack. We note that, while the buffet oscillations have the same period at
 $\alpha ={6}^{\circ }$
(green line), there is a noticeable initial transient in the buffet amplitudes at this AoA which saturates after a few cycles. The same initialisation process of fully developed narrow-span solutions being extruded to wide-span was also used at
 $\alpha ={5}^{\circ }$
; however, the lower AoA did not show the same transient behaviour. Similarly, the
 $\alpha ={7}^{\circ }$
case shows a similar peak-to-peak amplitude at each cycle without a long transient. The
 $\alpha ={7}^{\circ }$
case, however, shows decreased regularity from period-to-period than the lower AoAs. The PSD of lift fluctuations in figure 6(b), with tabulated values in table 1, shows an increase in the buffet frequency as the AoA is increased (
 $\alpha ={5}^{\circ }$
,
 $St=0.078$
;
 $\alpha ={6}^{\circ }$
,
 $St=0.085$
; and
 $\alpha ={7}^{\circ }$
,
 $St=0.109$
).
The mean pressure distributions in figure 6(c) show that the higher AoAs have a mean shock positions farther upstream as expected, but both cases still consist of a smeared out pressure gradient as a result of the streamwise shock oscillations. Turning to the skin-friction in figure 6(d), both higher-AoA cases now consist of large regions of time-averaged flow separation (
 $C_f \lt 0$
) downstream of the shock position. This is in contrast to the moderate AoA case (
 $\alpha ={5}^{\circ }$
), which only has small regions of time-averaged flow separation at the shock location and near the trailing edge. The flow at the moderate AoA is otherwise attached in a time-averaged sense. The pressure side of the aerofoil is observed to be less sensitive to the change in AoA, with a small shift in
 $C_p$
and
 $C_f$
visible. The decreased period-to-period regularity in the buffet oscillations in figure 5(a) motivates us to inspect the spanwise flow fields for potential 3-D effects.
Figure 7 shows instantaneous streamwise velocity contours within the boundary layer on the suction side of the aerofoil for cases AR200-AoA6 and AR200-AoA7. The snapshots correspond to the lift-phases in figure 6 at
 $t-t_0=57.15 ({\alpha ={6}^{\circ }})$
and
 $t-t_0=59.45 ({\alpha ={7}^{\circ }})$
. At these higher angles of incidence, the flow now exhibits large-scale three-dimensionality across the span. Compared with the flow fields for the more moderate AoA (
 $\alpha ={5}^{\circ }$
, figure 4), which had shock fronts aligned entirely parallel to the spanwise width, at
 $\alpha =6^{\circ },7^{\circ }$
, we begin to see spanwise perturbations similar in structure to buffet-/stall-cells (Iovnovich & Raveh Reference Iovnovich and Raveh2015; Giannelis et al. Reference Giannelis, Vio and Levinski2017; Masini et al. Reference Masini, Timme and Peace2020; Timme Reference Timme2020; Sugioka et al. Reference Sugioka, Nakakita, Koike, Nakajima, Nonomura and Asai2021; He & Timme Reference He and Timme2021; Sansica & Hashimoto Reference Sansica and Hashimoto2023). The 3-D cellular features are observed as dark blue regions where the flow recirculation is at its strongest. After a short transient when initialising the wide-span simulation with the fully developed narrow solution, the three-dimensionality develops naturally within the flow without any additional forcing of longer wavelengths. We note that the wavelengths forced in the boundary-layer tripping from (2.9), which are visualised in figure 2, are over two orders of magnitude smaller than the observed 3-D cellular buffet effects. The approximate location of the shock wave can be identified in the white terminating region separating the supersonic (red) and subsonic (blue) regions of the flow. The cellular structures lead to curvature of the shock wave orientation, which is no longer normal to the free stream in the streamwise direction.
Instantaneous streamwise velocity at a distance of 0.3 % chord from the suction side surface of the aerofoil, showing 3-D buffet effects for the  flow for angles of incidence of (a)
 $\alpha ={6}^{\circ }$
,
 $t-t_0=57.15$
and (b)
 $\alpha ={7}^{\circ }$
,
 $t-t_0=59.45$
. The dark blue cellular structures indicate regions of strong flow recirculation.

The snapshots shown in figure 7 were selected for comparison between different angles of attack when the cellular structures were observed to be in a similar location across the span. We note that these 3-D buffet effects are present persistently over numerous low-frequency cycles (figure 6
a), and, as we will see, were observed to be strongest during the switch from high- to low-lift phases of the buffet cycle as the shock wave propagates upstream. However, the spanwise arrangement of the cellular patterns are found to be intermittent in the nature and location of their appearance. Due to the zero sweep angle imposed in this unswept study, there is no preferred convection direction for these effects unlike those observed for cases with non-zero sweep (Iovnovich & Raveh Reference Iovnovich and Raveh2015; Plante et al. Reference Plante, Dandois and Laurendeau2020, Reference Plante, Dandois, Beneddine, Laurendeau and Sipp2021). For cases with non-zero sweep, the cells propagate at a set convection velocity based on the sweep angle and spanwise velocity component. At the time instance shown in figure 7, the main qualitative difference observed in our case is the reduction of wavelength as the AoA is increased. The higher AoA of
 $\alpha ={7}^{\circ }$
exhibits two separation cells compared with the single cell visible at
 $\alpha ={6}^{\circ }$
. In contrast to the 2.5-D studies of Crouch et al. (Reference Crouch, Garbaruk and Strelets2019); Paladini et al. (Reference Paladini, Beneddine, Dandois, Sipp and Robinet2019); Plante et al. (Reference Plante, Dandois and Laurendeau2020, Reference Plante, Dandois, Beneddine, Laurendeau and Sipp2021) which, not admitting any spanwise inhomogeneity, found steady unstable shock-distortion modes for unswept cases, the 3-D separation patterns identified here are fully 3-D. Furthermore, they are intermittent in nature and slightly move in the spanwise direction, albeit seemingly in a random fashion due to the absence of a cross-flow component that would give a preferential convection direction. In this sense, the structures observed here present several similarities with the 3-D buffet-cells seen in swept wings and will therefore be referred to as such.
Spanwise variation of pressure coefficient in time (
 $z-t$
) at
 , evaluated at the mean chord-wise shock location of (a)
 $x=0.45$
(
 $\alpha ={5}^{\circ }$
), (b)
 $x=0.375$
(
 $\alpha ={6}^{\circ }$
) and (c)
 $x=0.325$
(
 $\alpha ={7}^{\circ }$
) on the suction side of the aerofoil.

To further demonstrate the three-dimensional effects, figure 8 shows the spanwise variation of
 $C_p - \overline {C_p}$
at a single chord-wise location on the suction side of the aerofoil, as it evolves in time (
 $z - t$
plot, for the spanwise coordinate
 $z$
). The quantity is evaluated at the time-averaged mean shock positions of
 $x=0.45$
,
 $0.375$
and
 $0.325$
, for the
 cases at
 $\alpha ={5}^{\circ }$
,
 $\alpha ={6}^{\circ }$
and
 $\alpha ={7}^{\circ }$
, respectively. Different chord-wise positions of the probe line were tested, however, centring the probe location at the mid-point of the shock oscillations at each AoA was deemed the fairest comparison. For a purely 2-D interaction, the pressure distribution should vary uniformly across the spanwise coordinate as the shock oscillates about its mean position in a streamwise manner over the probe line. This is exactly what is observed for the moderate AoA case of
 $\alpha ={5}^{\circ }$
. Over multiple low-frequency buffet periods (corresponding to the lift history in figure 5
a), no spanwise variation is observed. The pressure oscillates symmetrically about the mean
 $ (C_p - \overline {C_p} = 0 )$
in the repeating red and blue bands, with a constant band thickness across the span. As the AoA is increased, the two-dimensionality of the
 $z-t$
signals begins to break down. At
 $\alpha ={6}^{\circ }$
, while similar low-frequency alternating red and blue bands show the same 2-D buffet shock oscillations exist about the measurement point as in the lower AoA, at this higher AoA, they are no longer in phase across the span. At any given time instance, the non-constant band thickness across the span demonstrates the modulation of the shock front observed in the instantaneous flow visualisations in figure 7. At
 $\alpha ={7}^{\circ }$
, the three-dimensionality becomes more severe, and, while the streamwise shock oscillations are still present, the bands now intersect as the spanwise shock position shifts in time relative to the probe location.
We have identified configurations where the 2-D (shock-oscillation) can occur either in isolation (
 $\alpha ={5}^{\circ }$
) or with 3-D separation effects superimposed (
 $\alpha = 6^{\circ }, 7^{\circ }$
). These results highlight that in the case of periodic wings for the flow conditions tested here, turbulent shock buffet can exist both in an essentially quasi-2-D manner at moderate angles of attack with minimal flow separation and as 3-D buffet with spanwise modulations when the angle of attack is raised. Even when using domain widths wide enough to allow spanwise wavelengths typically attributed to being representative of buffet cells (
 $\lambda = 1-1.5$
; Plante Reference Plante2020), we are able to isolate quasi-2-D streamwise shock oscillations without any 3-D effects (§ 3). When the angle of attack is raised by
 $1-2^{\circ }$
from this initial 2-D buffet state, onset of the three-dimensionality of the buffet phenomena is observed.
5. Aspect ratio effects on buffet at , and for
$\alpha ={6}^{\circ }$
 ,
 and
 for

Instantaneous streamwise velocity at a distance of 0.3 % chord from the suction side surface of the aerofoil, showing 3-D buffet effects for the  flow for an angle of incidence of
 $\alpha ={6}^{\circ }$
at
 $t-t_0=56.5$
. The dark blue regions show strong flow recirculation.

Having identified 3-D buffet effects at
 $\alpha = 6^{\circ },7^{\circ }$
but not at
 $\alpha ={5}^{\circ }$
, this section investigates the effect of increasing aspect ratio further to
 with ILES, at a fixed AoA of
 $\alpha ={6}^{\circ }$
. This section also contrasts buffet behaviour between both narrow (
 ) and wide (
 ) span aerofoils. We classify
 as “wide” in the context of the currently available literature of ILES/DNS buffet simulations, which, until now, have been limited to
 due to computational cost. As we have observed, the wide aspect ratios considered here are just wide enough to allow a couple of spanwise wavelengths of the dominant stationary mode. As previously mentioned, trends between buffet on narrow to intermediate domain widths (
 ) were reported by Lusher et al. (Reference Lusher, Sansica and Hashimoto2024). The narrow AR010-AoA6 case in this section is selected simply as a reference of 2-D buffet for comparison to the very wide (
 ) domain cases.
Figure 9 plots instantaneous streamwise velocity contours within the boundary layer on the suction side of the aerofoil at
 $\alpha ={6}^{\circ }$
and
 , at a time instance where 3-D effects are visible. Compared with the previously shown
 in figure 7, the wider domain at the same angle of incidence exhibits two clear peaks in the shock front instead of one. Figure 7 at
 $\alpha =6^{\circ }, 7^{\circ }$
suggests that the wavelength of the buffet-/stall-cells decreases with increasing AoA, and the
 domain is overly narrow to support two buffet-/stall-cells at
 $\alpha ={6}^{\circ }$
, but not at
 $\alpha =7^{\circ }$
. Widening the domain at
 $\alpha ={6}^{\circ }$
from
 to
 allows two stall-/buffet-cells to develop.
ILES cases of narrow- and wide-span buffet at  for an angle of attack of
 $\alpha ={6}^{\circ }$
, showing (a) lift coefficient history, (b) PSD of fluctuating lift component, (c) time-averaged pressure coefficient and (d) time-averaged skin-friction.

Figure 10 shows the span-averaged aerodynamic coefficients at
 $\alpha ={6}^{\circ }$
for
 . We note in the lift coefficient that a similar initial transient in peak-to-peak amplitude observed at
 (shown previously in figure 6
a) is also present at
 . At
 , it is also there, but is much weaker and saturates early on. Despite the presence of strong 3-D effects at wider aspect ratio (figure 7, figure 9), the mean lift shows minimal variation between aspect ratios, differing only to the third decimal point. Each case has a clear low-frequency oscillation which becomes more regular with increasing aspect ratio. In the PSD of lift fluctuations in figure 10(b), the narrow domain predicts higher amplitude mid-to-high-frequency energy content, which reduces with increasing aspect ratio. These additional frequencies are in the Strouhal number range of
 $St \approx 0.5$
and above, which are commonly associated with vortical wake modes (Moise et al. Reference Moise, Zauner, Sandham, Timme and He2023; Song et al. Reference Song, Wong, Ghate and Lele2024). This suggests that the narrower domains have a stronger wake component compared with the wide-span cases. All cases predict the same low-frequency 2-D buffet peak of
 $St = 0.085$
.
Figures 10(c) and 10(d) show the pressure coefficient and skin-friction distributions for the  cases at
 $\alpha ={6}^{\circ }$
. As for the other angles of attack considered, the span-averaged profiles do not show a large sensitivity to aspect ratio. This is especially true for the leading edge, transition region and pressure side of the aerofoil which are entirely insensitive to aspect ratio effects in the span-averaged sense. The narrowest case shows a slight deviation from the wide-span cases near the trailing edge (
 $x \gt 0.9$
), which was reported by Lusher et al. (Reference Lusher, Sansica and Hashimoto2024) as one of the markers for an overly narrow domain relative to the size of the separated boundary layer and subsequent over-prediction of the wake component. Both the
 and
 cases converge in this region near the trailing edge, as, along with the essentially 2-D
 $\alpha ={5}^{\circ }$
cases presented at
 and
 in figure 5(c), the wide aspect ratios considered in this work are far wider than the thickness of any separated boundary layers encountered. The other region where sensitivity to aspect ratio is observed in figures 10(c) and 10(d) is at the main shock position, due to 3-D effects. The deviation in the line plots between aspect ratios is very minor due to the time- and span-averaging applied. This can be viewed as evidence that the time signal used to compute the time mean (figure 10
a) was a sufficiently long averaging period. Although there are 3-D buffet-/stall-cells present, due to the zero sweep angle, there is no preferential spanwise location for their occurrence nor direction for their convection, and, consequently, an extremely long time integration would provide results consistent with 2-D/narrow predictions.
Showing
 $z-t$
diagrams of the time evolution of
 $u$
velocity within the boundary layer at the mean shock position of
 $x=0.375$
. Sensitivity to aspect ratio at
 $\alpha ={6}^{\circ }$
is observed for
 . The
 lift coefficient history is shown on the right side to reference low-/high-lift phases of the buffet cycle.

Figure 11 shows
 $z-t$
diagrams of streamwise velocity within the boundary layer on the suction side of the aerofoil. The monitor line is again taken as the mean shock-wave position at this AoA of
 $x=0.375$
. The lift coefficient for
 is plotted on the side to relate the
 $z-t$
oscillations to the varying lift during the buffet cycle. In a similar fashion to the aerodynamic coefficients shown in figure 10(a), the three
 $z-t$
signals are in phase with one another despite the increase from
 to
 . The flow velocity decreases periodically for each of the low-lift phases, as the shock wave moves upstream and passes over the time-averaged mean shock location. At both
 , dark blue patches of strong flow recirculation are visible during the low-lift phases. They are persistently appearing at each cycle, albeit with a shifted spanwise location. Similar to the
 $z-t$
progression shown with increasing AoA in figure 8, the two-dimensionality of the alternating colour bands also breaks down with increasing aspect ratio. While the 2-D chord-wise shock oscillations still dominate at
 , the onset of three-dimensionality is already apparent. At
 , the 3-D effect grows stronger in amplitude, with strong spanwise perturbations superimposed on the chord-wise shock oscillation, visible as a spanwise warping of the
 $z-t$
signal which affects the entire buffet cycle. These results demonstrate that in the context of un-swept infinite wings, buffet becomes 3-D across the span when a critical angle of attack is reached. However, there exists lower angle of attack cases for which only the chord-wise shock oscillation can be present, without any significant 3-D effects (§ 3). For the cases containing 3-D features, the amplitude of the buffet-/stall-cells can be increased by widening the domain at a fixed angle of attack. Similarly, the wavelength of the instability can be shortened with increasing angle of attack for a fixed aspect ratio.
Instantaneous spanwise velocity contours on the first point above the wall, for the case at
 $\alpha ={6}^{\circ }$
and
 with
 $T_{\textrm {buffet}} = 11.8$
and
 $t_0 = 33$
, showing four time instances equally spaced by
 $T_{\textrm {buffet}}/2$
, to demonstrate the temporal emergence/cessation of the 3-D buffet-/stall-cells.

Finally for this section, we look at how the flow over the suction side varies at different phases of the buffet cycle. Figure 12 plots the AR300-AoA6 case over 1.5 buffet periods, equally spaced in time by
 $t_{\textrm {buffet}}/2$
. The four snapshots show instantaneous near-wall spanwise w-velocity on the first point above the suction side of the aerofoil. Referring to the lift history in figure 10(a), the starting time of
 $t=33$
relates to the phase of the cycle where the flow is switching from high- to low-lift, but has not yet reached the minimum. At this AoA, this was found to be the phase of the buffet cycle where the three-dimensionality was at its strongest. At
 $t=33$
, two stall-/buffet-cells are visible at
 $z=0$
and
 $z=1.4$
. The zero-centred spanwise velocity contours show equal and opposite propagating fluid about a central saddle point at the centre of the cell. The recirculating fluid at
 $z=1.4$
first travels upstream in the
 $x$
direction (figure 9) before turning left/right at the front of the separation line within the cell. The same behaviour is observed for the cell located across the periodic boundary at
 $z=0$
and
 $z=L_z$
, with fluid moving in opposite directions away from both spanwise edges of the domain.
Half a buffet period later in the second snapshot where the flow is switching to high-lift phase (figure 10
a), the buffet-/stall-cells disappear and the flow becomes almost 2-D. Although there is still some remnant of the three-dimensionality that was convected downstream, the large-scale perturbations on the shock front and separation line vanish almost entirely. Returning to the original phase
 $t_{\textrm {buffet}}/2$
later in the third snapshot at
 $44.8$
, the cellular structures once again. Due to the lack of sweep angle, there is no preferential location for them to occur and they are shifted left by approximately
 $z=0.5$
relative to the same phase in the previous period. As before, the shock moves upstream and strong three-dimensionality develops at the point of maximum flow separation just before minimum lift is reached. The cells again have left- and right-moving fluid about the saddle point on the separation line. The upstream recirculating flow is directed in opposite directions at the separation line in a similar fashion seen in other 3-D separation patterns that occur within fluid mechanics (Tobak & Peake Reference Tobak and Peake1982; Eagle & Driscoll Reference Eagle and Driscoll2014; Rodríguez & Theofilis Reference Rodríguez and Theofilis2011; Lusher & Sandham Reference Lusher and Sandham2020a). Half a cycle later, at
 $t=50.7$
, the flow reattaches and the 3-D separations are again removed. This cycle continues over the numerous periods (figure 11) simulated as part of the buffet instability.
6. Sectional evaluation and modal decomposition of 3-D buffet
In this section, further analysis is performed of the  cases at
 $\alpha =5^{\circ }, 6^{\circ }$
and
 $7^{\circ }$
, and the
 case at
 $\alpha ={6}^{\circ }$
. First, in § 6.1, 3-D effects are investigated by evaluating quantities at individual locations across the span to observe how they deviate from span-averaged quantities. Second, § 6.2 performs SPOD-based modal decompositions to identify coherent modes and comment on the frequencies at which they occur for both the 2-D and 3-D instability.
6.1. Sectional spanwise variations of the aerodynamic forces
Sectional evaluation of aerodynamic coefficients, for  wide-span buffet cases at
 $\alpha = 5^{\circ }, 6^{\circ }, 7^{\circ }$
, showing (a,b,c) sectional lift coefficient and (d,e,f) sectional deviation of the surface pressure coefficient from the span-averaged value.

To further investigate the contrasting behaviour for the buffet phenomenon at moderate and high AoA, it is more illustrative to look at sectional evaluation of aerodynamic coefficients in addition to the span-averaged versions. In the case of the quasi-2-D buffet at
 $\alpha ={5}^{\circ }$
, evaluation of the aerodynamic coefficients at individual spanwise locations should not show significant deviations from the span-averaged results (figure 5). Conversely, the cases exhibiting 3-D effects should predict different aerodynamic forces at different spanwise stations due to the loss of two-dimensionality of the flow and the finite integration time of the signal.
Figure 13 shows the lift coefficient
 $C_L$
evaluated at single spanwise locations. Five evenly spaced stations are used, located at
 $z = 0\,\%, 20\,\%, 40\,\%, 60\,\%, 80\,\%$
of the spanwise aerofoil width
 $L_z$
. The cases correspond to the wide-span
 simulations presented in the previous sections. Figures 13(a)–13(c) show the lift coefficient at
 $\alpha ={5}^{\circ }$
,
 $\alpha ={6}^{\circ }$
and
 $\alpha ={7}^{\circ }$
. In the case of
 $\alpha ={5}^{\circ }$
, the results from all of the five stations collapse upon one another, with only very minor deviations observed at the minima and maxima of each low-frequency buffet cycle. All of the five stations are in phase, with very good agreement for the mean
 $C_L$
prediction between each curve, and also to the span-averaged result (figure 5
a). This re-iterates that the buffet phenomena remains quasi-2-D at this moderate AoA of
 $\alpha ={5}^{\circ }$
, with every spanwise region of the main shock wave oscillating in phase along the streamwise direction. At
 $\alpha ={6}^{\circ }$
and
 $\alpha ={7}^{\circ }$
, there is no longer agreement between the sectional profiles of lift. The five stations diverge all throughout the buffet cycle, with variations in lift magnitude. While the low-frequency trend is similar for each profile, we observe relative lags in reaching minima/maxima depending on the spanwise location used to evaluate the forces. This is due to the 3-D effects observed for these higher AoA cases in figure 7, where the flow can either be attached or separated depending on the spanwise probe location relative to the instability at a given time instance.
Figures 13(d)–13(f) show the absolute difference between the (i) time- and span-averaged suction side
 $\overline {C_p}$
distribution and the (ii) time-averaged
 $\overline {C_p}$
distribution when evaluated only at single spanwise location. As before, five equally spaced spanwise stations are used across the
 span width, to assess whether or not the flow maintains two-dimensionality. Furthermore, we can observe the regions of the chord-wise length that show the strongest three-dimensionality due to the buffet-/stall-cells. Figure 13(b) shows the result for the moderate AoA of
 $\alpha ={5}^{\circ }$
. The variation between the individual stations and span-averaged distribution is minimal. This quantity is evaluated over the relatively short
 $\approx 4.5$
low-frequency cycles shown in figure 5(a). There is a small rise in the span-deviation around the mean shock position
 $(x = 0.45)$
, but it is minor and of the same order of magnitude as that invoked by the boundary-layer tripping
 $(x=0.1$
). When considering the sectional lift (figure 13
a) and pressure profiles (figure 13
b) relative to the span-averaged results, it is clear that the buffet for the moderate AoA case is essentially 2-D for the full length of the chord, despite the wide spanwise domain sizes used.
Figures 13(e)
and
13(f) show the same measure of three-dimensionality again for the higher AoAs of
 $\alpha ={6}^{\circ }$
and
 $\alpha ={7}^{\circ }$
. In this case, there are large peaks visible for all of the sectional profiles, indicating strong spanwise deviation from the span-averaged result (figure 6
c) due to the appearance of intermittent buffet-/stall-cells. Interestingly, the three-dimensionality is mainly concentrated at the peaks centred at the mean shock locations
 $(x=0.325, 0.375)$
. These are the same chord-wise locations used for the
 $z-t$
signals in figure 8. For this study with zero sweep angle, the 3-D buffet-/stall-cells are observed to be somewhat irregular in their spanwise location and this leads to the variation seen between the five equally spaced stations. While the aft region of the aerofoil downstream of the main SBLI (
 $x \gt 0.5$
) is very 2-D in the moderate AoA case (figure 13
d), secondary peaks at higher AoAs show the three-dimensionality persists all the way to the trailing edge in the cases with buffet cells (figure 13
e,f).
6.2. Spectral proper orthogonal decomposition (SPOD)
In this section, a SPOD method (Taira et al. Reference Taira, Brunton, Dawson, Rowley, Colonius, McKeon, Schmidt, Gordeyev, Theofilis and Ukeiley2017; Towne et al. Reference Towne, Schmidt and Colonius2018) is applied to a selection of the cases presented at  and
 , to further analyse the structure and frequency content of the 3-D buffet effects in the absence of sweep. Details of the SPOD configuration are available in § 2.5. To perform the analysis, 2-D snapshots of pressure data are used from both a side (
 $x$
–
 $y$
) plane (at
 $z=L_z / 2$
), and at the wall (
 $x$
–
 $z$
plane,
 $y=0$
). To further elucidate the three-dimensional behaviour, SPOD is also performed on spanwise w-velocity data at the first grid point off the wall for some select cases. SPOD modes are normalised by the maximum absolute value of the mode in each case to be within the range
 $ [-1,1 ]$
. For all plots in this section, the contour levels are fixed to be symmetric in the range
 $ [-0.5, 0.5 ]$
.
For all angles of attack investigated
 $({\alpha ={5}^{\circ }}, {\alpha ={6}^{\circ }}, {\alpha ={7}^{\circ }})$
, the eigenvalue spectra of the first SPOD mode are plotted for both side plane and wall-pressured-based datasets in figure 14. To aid comparison to the global dynamics and aerodynamic forces, the PSD distributions calculated on lift-coefficient fluctuations are also overlaid. For all angles of attack and datasets, the dominant SPOD mode matches the frequency of the dominant peak in the
 $C^{\prime}_L$
-based PSD very well. While significant energy content can be seen at low frequencies, the spectra rapidly decays for frequencies above the dominant peak. Although not shown here for brevity, SPOD modes above the dominant one are all either higher harmonics of the dominant frequency (peaks at multiples of the dominant
 $St$
), wake modes (
 $0.3\lt St\lt 5$
) (Moise et al. Reference Moise, Zauner, Sandham, Timme and He2023; Song et al. Reference Song, Wong, Ghate and Lele2024) or due to the numerical boundary-layer tripping (
 $3\lt St\lt 10$
). When considering data only from the aerofoil surface wall pressure (i.e. excluding data from the wake blocks), it can be seen that the energy of the wake and tripping modes is significantly reduced in relation to the dominant peak. Based on this observation, we focus the modal analysis on the low-frequency (
 $0.02\lt St\lt 0.04$
) and dominant (
 $0.07\lt St\lt 0.096$
) modes, indicated by the coloured circles in the SPOD spectra.
SPOD eigenvalue spectra (coloured lines) for pressure on (a–c) side
 $x$
–
 $y$
plane at
 $z=1$
and (d–f)
 $x$
–
 $z$
suction-side wall are shown with the PSD of
 $C_L$
fluctuations (black) for
 $\alpha = 5^{\circ }, 6^{\circ }, 7^{\circ }$
at
 . Circles are the selected modes for visualisation.

Shock-oscillation SPOD pressure mode on (a–c) side
 $x$
–
 $y$
plane at
 $z=1$
and (d–f)
 $x$
–
 $z$
suction-side wall (bottom) for cases
 $\alpha = 5^{\circ }, 6^{\circ }, 7^{\circ }$
with
 . Time-averaged sonic line and min/max shock wave position are shown for side- and wall-views, respectively.

The SPOD modes for the dominant peak are plotted in figures 15(a–c) and 15(d–f) for both side (
 $x$
-
 $y$
) plane at
 $z=L_z/2$
and (
 $x$
-
 $z$
,
 $y=0$
) suction-side wall, respectively. The Strouhal numbers associated with these mode are
 $St=0.070$
(
 $\alpha ={5}^{\circ }$
),
 $St=0.088$
(
 $\alpha ={6}^{\circ }$
) and
 $St=0.096$
(
 $\alpha ={7}^{\circ }$
). Similar to previous SPOD analysis of transonic buffet in the literature (Moise et al. Reference Moise, Zauner and Sandham2022; Song et al. Reference Song, Wong, Ghate and Lele2024; Song et al. Reference Song, Wong, Ghate and Lele2024), the dominant mode is localised around the main shock-wave. For all angles of attack, this mode is essentially 2-D and is associated with the chordwise convection of perturbations that are synchronised with the shock oscillations. The different ranges of shock excursion in the chordwise direction for the three angles of attack can be also seen, and is in agreement with the lift-coefficient oscillation amplitudes shown in figure 13. While the modes on the surface become slightly wavy in
 $z$
at the higher angles of attack, this mode remains in phase across the spanwise direction with the same sign and is essentially 2-D (despite the presence of 3-D features in the actual flow-fields at
 ${\alpha ={6}^{\circ }}, {\alpha ={7}^{\circ }}$
; figure 13). For all of the above reasons and to be consistent with the literature, we will refer to this mode as the 2-D ‘shock-oscillation mode’. This shock-oscillation mode isolates the chordwise shock oscillations, without revealing the 3-D structures that are also present at
 ${\alpha ={6}^{\circ }}, {\alpha ={7}^{\circ }}$
.
SPOD low-frequency mode on the (a–c) side
 $x$
–
 $y$
plane at
 $z=1$
and (d–f)
 $x$
–
 $z$
suction-side wall for cases
 $\alpha = 5^{\circ }, 6^{\circ }, 7^{\circ }$
with
 . Time-averaged sonic line and min/max shock wave position are shown for side- and wall-views, respectively.

To investigate the spanwise structure and arrangement of the observed three-dimensionality at certain conditions, the low-frequency SPOD modes corresponding to
 $St=0.035$
(
 $\alpha ={5}^{\circ }$
),
 $St=0.022$
(
 $\alpha ={6}^{\circ }$
) and
 $St=0.024$
(
 $\alpha ={7}^{\circ }$
) are plotted in figure 16. Low-frequency in this instance is defined relative to the 2-D shock-oscillation mode as above. While at
 $\alpha ={5}^{\circ }$
this mode is still essentially 2-D, for
 $\alpha ={6}^{\circ }$
and
 $\alpha ={7}^{\circ }$
, this breaks down and the SPOD shows the imprint of the 3-D cellular patterns seen previously in the instantaneous flow-fields (figure 7). The spanwise location of these 3-D structures irregularly changes along the shock front over time. As shown in the URANS calculations (Iovnovich & Raveh Reference Iovnovich and Raveh2015; Plante et al. Reference Plante, Dandois and Laurendeau2020, Reference Plante, Dandois, Beneddine, Laurendeau and Sipp2021), in the absence of sweep, the amplitude and convection of these cells is irregular, the spanwise location at which they appear is random and the number of buffet cells varies in time. While for swept wings the buffet cells frequency is usually in the
 $St=0.2-0.3$
range, Plante et al. (Reference Plante, Dandois and Laurendeau2020) showed that for low-sweep-angle wings, this frequency can be lower than that associated with the dominant 2-D shock oscillations. As can be seen from the SPOD modes calculated on the suction-side wall pressure data, the spanwise movement of these cellular perturbations leaves slanted bands reminiscent of the buffet-cell mode found in the global stability analyses (Paladini et al. Reference Paladini, Beneddine, Dandois, Sipp and Robinet2019; Plante et al. Reference Plante, Dandois, Beneddine, Laurendeau and Sipp2021) for swept wings. In contrast to the 2-D shock oscillation mode (figure 16), the low-frequency 3-D mode shows variations in the sign across the span at
 $\alpha ={6}^{\circ }$
and
 $\alpha ={7}^{\circ }$
. The lower AoA (
 $\alpha ={5}^{\circ }$
) mode, however, is coherent across the span and visually very similar to the purely 2-D shock-oscillation mode shown in figure 16. In this sense, the appearance of this low-frequency 3-D buffet cells mode seems to be linked to the loss of two-dimensionality observed for certain cases in the present study, as shown in §§ 3 and 4.
In agreement with the GSA studies (Crouch et al. Reference Crouch, Garbaruk and Strelets2019; Paladini et al. Reference Paladini, Beneddine, Dandois, Sipp and Robinet2019; Plante et al. Reference Plante, Dandois, Beneddine, Laurendeau and Sipp2021), the three-dimensionalisation of the flow is admitted also for unswept wings when shock-distortion modes become unstable. However, these have been reported to become unstable concomitantly with the 2-D shock-oscillation modes. It is important to note, however, that this previous observation came from analysis of a different aerofoil geometry (OAT15A) to ours. The OAT15A profile has been analysed extensively in numerous buffet studies in the literature (Thiery & Coustols Reference Thiery and Coustols2006; Jacquin et al. Reference Jacquin, Molton, Deck, Maury and Soulevant2009; Sartor et al. Reference Sartor, Mettot and Sipp2015; Fukushima & Kawai Reference Fukushima and Kawai2018; Crouch et al. Reference Crouch, Garbaruk and Strelets2019; Paladini et al. Reference Paladini, Beneddine, Dandois, Sipp and Robinet2019; Nguyen et al. Reference Nguyen, Terrana and Peraire2022; Iwatani et al. Reference Iwatani, Asada, Yeh, Taira and Kawai2023), and the findings may not be universal to other profiles. We believe it is important to diversify the aerofoil geometries used in future studies, to assess the generality of the proposed physical mechanisms and avoid bias to a particular profile. To understand whether this is in contradiction with the simulations presented in the current study at
 $\alpha =5^\circ$
(for which only 2-D unsteady modes are present), the SPOD analysis is repeated on spanwise-velocity data at the first grid point above the suction-side wall. This quantity is expected to be more sensitive to 3-D effects as, unlike pressure or other thermodynamic state variables tested (not shown for brevity), the w-velocity contains additional directional information about the fluid propagation as seen in figure 12.
For all angles of attack, figure 17 shows SPOD spectra and modes at the same 2-D and 3-D mode frequencies visualised previously. The first thing to note is that the SPOD spectrum appears very flat at
 $\alpha ={5}^{\circ }$
and both low-frequency and shock-oscillation modes have similar energy content. For the
 $\alpha ={6}^{\circ }$
and
 $\alpha ={7}^{\circ }$
cases, the low-frequency mode becomes dominant, possibly causing the appearance of the 3-D separation structures present in the flow. It is also interesting to see that for all cases, both low-frequency and shock-oscillation modes are no longer strictly2-D. This is surprising especially for the
 $\alpha ={5}^{\circ }$
case, where the main flow dynamics has been shown to be essentially 2-D in the previous sections. In agreement with the discussion of Jacquin et al. (Reference Jacquin, Molton, Deck, Maury and Soulevant2009), this might be an indication that while 3-D effects may be present, until the velocity associated with the shock motion in the streamwise direction is much larger than the velocity associated with the 3-D structures, the shock-oscillation related dynamics remains essentially 2-D. In this sense, marginal 3-D effects may be present, as depicted by the aforementioned global stability analysis studies that predict the appearance of 2-D and 3-D unstable modes concomitantly. However, these 3-D effects might be near the onset and extremely weak, hidden under the prevailing 2-D mechanisms of the nonlinearly saturated shock-oscillations. In agreement with this finding, Crouch et al. (Reference Crouch, Garbaruk and Strelets2019) showed for unswept wings that an alteration of the 3-D stationary mode has minimal effect on the 2-D oscillatory one. Since the investigations of both Jacquin et al. (Reference Jacquin, Molton, Deck, Maury and Soulevant2009) and Crouch et al. (Reference Crouch, Garbaruk and Strelets2019) were conducted on the OAT15A aerofoil, the present study hints at a generalisable intrinsic characteristic of turbulent transonic buffet, rather than a behaviour related to geometrical features.
SPOD eigenvalue spectra (coloured lines) for w-velocity on a (a–c)
 $x$
-
 $z$
suction-side near-wall plane are plotted with the PSD of
 $C_L$
fluctuations (black) for
 $\alpha = 5^{\circ }, 6^{\circ }, 7^{\circ }$
at
 . Circles show the (d–f) SPOD low-frequency and (g–i) 2-D shock-oscillation modes. Min/max shock position are also shown (dashed line).

SPOD eigenvalue spectra (coloured lines) for (a) pressure and (b) w-velocity on the
 $x$
–
 $z$
suction-side wall/near-wall are shown with the PSD of
 $C_L$
fluctuations (black) for case
 $\alpha = 6^{\circ }$
and
 . Circles show the modes selected for visualisation.

SPOD (a,b) low-frequency and (c,d) shock-oscillation modes for (a,c) pressure and (b,d) w-velocity on
 $x$
–
 $z$
suction-side and near-wall planes for
 $\alpha = 6^{\circ }$
and
 . Min/max shock position are also shown (dashed).

The SPOD analysis is repeated for the widest  case at
 $\alpha ={6}^{\circ }$
. Focusing only on the established 3-D effects, the analysis at
 is discussed only in the context of the suction-side wall/near-wall datasets on both pressure and spanwise-velocity as above. First, the SPOD spectral content shown in figure 18 generally agrees well with the characteristics observed for the same angle of attack at the lower aspect ratio of
 . For both the pressure and spanwise-velocity based SPOD analyses, the real part of the low-frequency (
 $St=0.027$
) and shock-oscillation modes (
 $St=0.080$
) are reported in figure 19. The low-frequency mode still shows 3-D cellular patterns that are convected (in this case from right to left) along the shock front. The shock-oscillation mode is essentially 2-D for the pressure-based SPOD modes, although some spanwise modulation is more noticeable than in the equivalent modes at
 $AR=2$
(figure 16). For the SPOD analysis based on spanwise-velocity, the shock-oscillation mode is again 3-D and sub-dominant with respect to the low-frequency mode.
7. Further discussion and conclusions
Wide-span
 $ (1 \leqslant AR \leqslant 3 )$
turbulent transonic buffet has been investigated for the first time with high-fidelity scale-resolving simulations. The implicit large eddy simulations (ILESs) were performed for a free stream Mach number of
 $M_{\infty } = 0.72$
at a moderate Reynolds number of
 $Re=5 \times 10^5$
on periodic (infinite, unswept) configurations of the supercritical NASA-CRM wing geometry, which was tripped to turbulence. The aspect ratios studied here are between 20 and 60 times wider than typically used for high-fidelity buffet studies (
 , Garnier & Deck Reference Garnier, Deck, Deville, Le and Sagaut2013;
 , Fukushima & Kawai Reference Fukushima and Kawai2018; Nguyen et al. Reference Nguyen, Terrana and Peraire2022;
 , Moise et al. Reference Moise, Zauner and Sandham2022, Reference Moise, Zauner, Sandham, Timme and He2023; and
 , Song et al. Reference Song, Wong, Ghate and Lele2024). Building upon our previous recent work on this configuration (Lusher et al. Reference Lusher, Sansica and Hashimoto2024), which investigated domain sensitivity of the two-dimensional buffet phenomenon on narrow-to-moderate aspect ratios
 , this study instead focused on domain widths expected to be wide enough to observe 3-D buffet effects
 . Initial results at
 $\alpha ={5}^{\circ }$
and
 were cross-validated against low-fidelity URANS predictions, with excellent agreement observed for both aerodynamic forces and buffet frequencies. At a moderate AoA of
 $\alpha ={5}^{\circ }$
with mostly attached flow (in a time-averaged sense), buffet was found to remain essentially 2-D with no spanwise modulation observed. The low-frequency buffet oscillations agreed well with narrow-span ILES predictions (Lusher et al. Reference Lusher, Sansica and Hashimoto2024) and URANS. Widening the domain from
 to
 had no effect on the main aerodynamic quantities and buffet characteristics (figure 5). A very-wide URANS at
 confirmed this quasi-2-D buffet behaviour at
 $\alpha ={5}^{\circ }$
(figure 20).
However, at higher angles of attack (
 ${\alpha ={6}^{\circ }}, {\alpha ={7}^{\circ }}$
), significant 3-D buffet effects were observed, which persisted through multiple low-frequency buffet cycles. The 3-D effects were similar to those found in lower-fidelity RANS-based studies in the literature (Iovnovich & Raveh Reference Iovnovich and Raveh2015; Paladini et al. Reference Paladini, Beneddine, Dandois, Sipp and Robinet2019; Plante et al. Reference Plante, Dandois, Beneddine, Laurendeau and Sipp2021). In addition to the chordwise 2-D shock oscillations found at lower AoA, large cellular 3-D separation bubbles were observed on the suction side of the wing once the angle of incidence was raised to
 ${\alpha ={6}^{\circ }}, {\alpha ={7}^{\circ }}$
(figure 7). The 3-D separations were primarily localised to the shock-foot region and result in spanwise perturbations along the shock front. The three-dimensionality was observed to occur for aspect ratios of
 and above, with wavelengths in the range
 $\lambda = 1-1.5$
, depending on the applied aspect ratio. Due to the absence of imposed sweep angle (
 $\Lambda = 0^{\circ }$
), the buffet-/stall-cells were observed to be irregular and intermittent in their spanwise location and strength between consecutive buffet cycles (figure 8). The three-dimensionality at the shock front was found to be linked to the level of flow separation present, with the strongest 3-D effects seen during low-lift phases of the buffet cycle where the shock reaches its farthest upstream position and the flow is highly separated.
URANS of the
 $\alpha ={5}^{\circ }$
baseline case, showing (top)
 $C_L$
history at
 and
 . The bottom panel shows instantaneous
 $C_p$
on the suction side of the aerofoil, demonstrating the essentially-2D behaviour of this 3D URANS buffet simulation.

Span- and time-averaged aerodynamic quantities showed minimal sensitivity to the appearance of the 3-D structures, generally agreeing well to 2-D predictions. In contrast, sectional evaluation of the same quantities at different individual spanwise stations showed large deviations from span-averaged values. These deviations were only observed for the cases showing three-dimensionality, with the sectional evaluations for the quasi-2-D cases at
 $\alpha ={5}^{\circ }$
largely agreeing well with the span-averaged result. The three-dimensionality was found to be located mainly at the main shock wave, as demonstrated by the peaks in the sectional evaluation of aerodynamic quantities in figure 13. For a fixed AoA of
 $\alpha ={6}^{\circ }$
, increasing the aspect ratio from
 to
 modified the wavelength of the cellular separations, increased the number of buffet-/stall-cells accommodated by the spanwise width and strengthened the three-dimensionality. Instantaneous spanwise velocity contours above the suction-side wall (figure 12) showed the buffet-/stall-cell separations appear as perturbations along the shock-front, with left- and right-moving fluid either side of the saddle point. The 3-D effects were mostly seen during low-lift buffet phases where the separation reaches a maximum. The configuration reverts to quasi-2-D topologies during high-lift phases as the shock moves downstream and the flow reattaches.
To further analyse the structure and frequency content of the 3-D structures, a modal SPOD method was applied to cases at  and
 . For all cases considered, a 2-D shock-oscillation mode was observed both when considering side-views and surface-pressure data. The Strouhal numbers associated with this mode occurred in the range
 $St = [0.07, 0.1 ]$
, consistent with those commonly reported in the buffet literature (Fukushima & Kawai Reference Fukushima and Kawai2018; Moise et al. Reference Moise, Zauner and Sandham2022, Reference Moise, Zauner, Sandham, Timme and He2023). Higher frequency harmonics and wake modes (
 $0.3\lt St\lt 5$
, Moise et al. Reference Moise, Zauner, Sandham, Timme and He2023; Song et al. Reference Song, Wong, Ghate and Lele2024) were also present. The 2-D shock-oscillation mode from SPOD was shown to remain essentially 2-D even in the presence of the strong 3-D separation effects demonstrated throughout this work. Instead, the separated 3-D structures were associated with SPOD modes occurring at frequencies (
 $St \sim 0.002 - 0.004$
), lower than that of the 2-D shock-oscillation mode. This finding is in good agreement with the URANS-based analysis of Plante et al. (Reference Plante, Dandois and Laurendeau2020), who showed that the frequency of the 3-D mode tends towards lower-frequencies in the unswept (
 $\Lambda = 0^{\circ }$
) limit relevant here.
Further SPOD analysis of the spanwise velocity component (w) instead of pressure showed that, while the
 $\alpha ={5}^{\circ }$
case was observed to remain essentially 2-D in the instantaneous flow-fields and pressure-based SPOD modes, the SPOD mode on w did show weak traces of three-dimensionality at the same scale as expected for buffet-cell phenomena (
 $\lambda = 1-1.5$
). This subtlety could be a possible explanation as to why GSA-based studies identify the onset of 2-D and 3-D buffet occurring at the same conditions, whereas we demonstrate with high-fidelity wide-span simulations that 2-D shock-oscillations can be active on infinite-wings at transonic buffet conditions without noticeable 3-D buffet-/stall-cell phenomena present. Analysis of the phase-dependence of the SPOD surface modes showed spanwise convection occurring only for the low-frequency 3-D mode, and not for the 2-D shock-oscillation one. Future work of ILES on swept configurations is required to assess whether or not the irregular 3-D separation patterns observed here become regular buffet-cells with a fixed convection velocity as the sweep angle is increased. This will be the topic of a future study on the same configuration.
Acknowledgements.
Computational time was provided by the JAXA JSS3 supercomputing facility and associated support staff, and the Fugaku supercomputer at RIKEN on projects hp220195, hp220226. The authors would like to thank Dr Markus Zauner for discussions and assistance with URANS set-up.
Funding.
D.J.L. was funded by the Japan Society for the Promotion of Science (JSPS), on a postdoctoral fellowship awarded to the JAXA Chofu Aerospace Center (JSPS KAKENHI (22F22059)).
Declaration of interests.
The authors report no conflict of interest.
Data availability statement.
The data that support the findings of this study are available from the corresponding author, [D.J.L], upon reasonable request.
Author contributions.
All authors that made contributions are present. Writing: D.L. and A.S. wrote the original and revised manuscripts. A.H. contributed to revisions of the manuscripts. Simulations: D.L. performed all of the ILES simulations. A.S. performed the URANS simulations. Analysis: A.S. and D.L. implemented the modal SPOD using the PySPOD library. Software: D.L. is the lead developer of the OpenSBLI solver (University of Southampton & JAXA), A.H. and A.S. contributed to the development of the FaSTAR solver (JAXA). Meshes: A.S. created the meshes in Pointwise. Funding: D.L., A.S. and A.H. obtained project funding from the Japan Society for the Promotion of Science (JSPS). All authors contributed to discussions, proposals for computational time and post-processing tools.
Appendix A. URANS up to
$AR=6$

To further check the two-dimensionality of the
 $\alpha ={5}^{\circ }$
solution, the
 URANS (figure 3) is extended to
 to assess whether the
 ILES domain is still too narrow. The much cheaper computational cost of URANS compared to ILES allows us to simulate much wider aspect ratios and integrate for far more periods of the buffet cycle. Figure 20 shows a comparison of lift coefficient for
 and
 , with an instantaneous top-down pressure coefficient snapshot of the flow at
 . Despite observed chord-wise low-frequency buffet shock oscillations, the surface plot shows no three-dimensionality and the solution is still essentially two-dimensional even at
 . Numerous individual URANS snapshots were observed at each point in the buffet cycle, but no buffet/stall-cells were identified. Similarly, the lift coefficient shows perfect overlap between
 and
 , suggesting that there are no span-dependent three-dimensional effects occurring.



