Introduction
The “vascular depression” hypothesis (Alexopoulos et al., Reference Alexopoulos, Meyers, Young, Kakuma, Silbersweig and Charlson1997), first proposed over ten years ago, sought to explain some of the apparent differences in etiology between early and late-life major depressive disorder (Baldwin, Reference Baldwin2005). Such differences, it was argued, were a result of vascular disease affecting frontal-subcortical circuitry. Magnetic resource imaging studies suggest that increases in white matter lesions found in depression patients, linking prefrontal areas with the basal ganglia, may be vascular in origin (Thomas et al., Reference Thomas2002b; Herrmann et al., Reference Herrmann, Le Masurier and Ebmeier2008). Recent morphological studies in post-mortem tissue have revealed subtle, but significant, alterations in pyramidal neuron and glial cell populations in the frontal and subcortical circuitry associated with affective function in depression (Rajkowska et al., Reference Rajkowska, Miguel-Hidalgo, Dubey, Stockmeier and Krishnan2005; Khundakar et al., Reference Khundakar, Morris, Oakley, McMeekin and Thomas2009; Reference Khundakar, Morris, Oakley and Thomas2010). Such alterations may be influenced by the age at onset of the illness, with significant reductions in glial cell density found in three frontal areas associated with depression – the orbitofrontal cortex (OFC), the anterior cingulate cortex and the dorsolateral cortex (DLPFC) – in early-life depression patients (Ongur et al., Reference Ongur, Drevets and Price1998; Rajkowska et al., Reference Rajkowska1999; Cotter et al., Reference Cotter, Mackay, Chana, Beasley, Landau and Everall2002b), but no corresponding changes in glial cell density in either the OFC (Rajkowska et al., Reference Rajkowska, Miguel-Hidalgo, Dubey, Stockmeier and Krishnan2005) or DLPFC (Khundakar et al., Reference Khundakar, Morris, Oakley, McMeekin and Thomas2009) in late-life depression patients.
Gamma-aminobutyric acid (GABA) is the main inhibitory transmitter in the mammalian central nervous system and GABA-containing neurons are abundant throughout the entire brain. Several pre-clinical and clinical studies have implicated GABA involvement in the neurobiological processes behind mood regulation (Brambilla et al., Reference Brambilla, Perez, Barale, Schettini and Soares2003; Zarate et al., Reference Zarate2003); however, the precise mechanistic action behind its role remains unclear. Studies in post-mortem tissue have revealed the presence of three subpopulations of GABAergic neurons, identified by three separate antibodies: parvalbumin, calbindin and calretinin (Beasley et al., Reference Beasley, Zhang, Patten and Reynolds2002). It has been demonstrated that the majority of neurons expressing parvalbumin are large basket and chandelier cells (Lewis and Lund, Reference Lewis and Lund1990; Gonzalez-Burgos et al., Reference Gonzalez-Burgos, Krimer, Povysheva, Barrionuevo and Lewis2005); calretinin, however, is expressed mainly in bipolar, double bouquet and Cajal-Retzuis cells (Jacobowitz and Winsky, Reference Jacobowitz and Winsky1991). Both parvalbumin and calretinin-expressing interneurons are thought to provide tonic regulation of glutamatergic pyramidal neuron projections (Gonzalez-Burgos et al., Reference Gonzalez-Burgos, Krimer, Povysheva, Barrionuevo and Lewis2005; Lewis and Moghaddam, Reference Lewis and Moghaddam2006).
A significant reduction in density and volume of GABAergic interneurons immunoreactive for the calcium binding protein calbindin has been found in the DLPFC in younger depressed patients; however, no significant change was found in the volume of neurons expressing parvalbumin (Rajkowska et al., Reference Rajkowska, O'Dwyer, Teleki, Stockmeier and Miguel-Hidalgo2007). As outlined earlier, subtle differences in neuronal pathology appear to exist in areas associated with affective functioning in depressed patients on the basis of age (Rajkowska et al., Reference Rajkowska, Miguel-Hidalgo, Dubey, Stockmeier and Krishnan2005; Khundakar et al., Reference Khundakar, Morris, Oakley, McMeekin and Thomas2009; Reference Khundakar, Morris, Oakley and Thomas2010), perhaps indicative of differing pathophysiological events, as described in the “vascular depression” hypothesis (Alexopoulos et al., Reference Alexopoulos, Meyers, Young, Kakuma, Silbersweig and Charlson1997). It is therefore pertinent to assess morphology of GABAergic neuron subpopulations in an elderly cohort of patients.
This study aimed to examine the role of GABA transmission in late-life depression by examining the immunoreactivity of the three antibodies relating to GABAergic interneuron activity: parvalbumin, calretinin and calbindin. Owing to inherent technical issues, perhaps relating to the use of paraffin-embedded tissue, the assessment of calbindin immunostaining was precluded from the study.
Methods
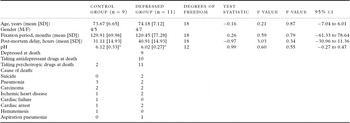
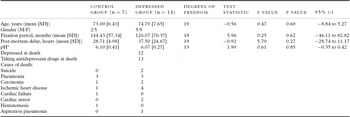
Brain tissue was obtained from elderly depressed subjects, who had been diagnosed by full clinical assessment during life and reviewed by the Newcastle Clinico-pathological committee after death. All patients (except two patients in the parvalbumin and two patients in the calretinin study) in the depressed group were depressed at the time of death, had suffered at least one episode of major depression but no other psychiatric condition (including dementia) and had no evidence of neurodegenerative disease at post-mortem examination (Tables 1 and 2). Comparison subjects, who matched the same criteria as the depressed group but had not suffered a major depressive episode, were also included in the study. The cause of death and vascular risk factor data have been published in a previous study (Thomas et al., Reference Thomas, Ferrier, Kalaria, Perry, Brown and O'Brien2001). Permission for post-mortem research was granted by the subjects and ethical approval was granted for the use of the tissue in this study. The patient numbers comprised 20 individuals in the parvalbumin experiment (9 controls and 11 depressed patients) and 21 (7 controls and 14 depressed) in the calretinin experiment.
Patient characteristics for depressed and control groups (parvalbumin study)†

†Continuous variables expressed as mean (SD).
*Control group (n = 6), depressed group (n = 7).
Patient characteristics for depressed and control groups (calretinin study)†

†Continuous variables expressed as mean (SD).
*Control group (n = 4), depressed group (n = 11).
Tissue was taken from the right hemisphere and fixed in 10% formalin. The DLPFC was then excised by selecting the coronal slice from each subject to include Brodmann area (BA) 9, according to a standard map (Perry, Reference Perry1993), before being embedded into paraffin blocks. Fifteen serial 10 μm-thick sections were cut from each block on a rotary microtome and placed on 4% 3-aminopropyltriethoxysilane-coated slides. Three sections per case were then randomly chosen from the 15, and quality checked for consistency and coded by a third party (AT). This ensured that all analyses were carried out blind to the patients' diagnosis. Brain weight and possible confounding factors, such as tissue pH, post-mortem delay, duration of fixation were recorded prior to histological processing (Figure 1).
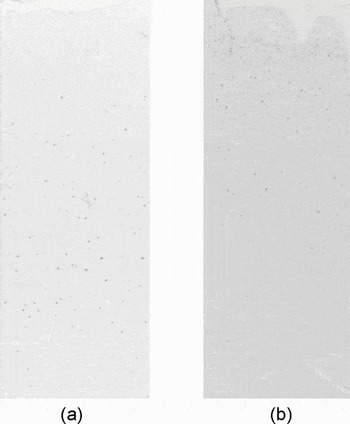
Sections from the dorsolateral prefrontal cortex at 2.5× magnification: (a) parvalbumin, (b) calretinin.

The sections were processed for immunohistochemical examination with a standardized procedure used by this group (Thomas et al., Reference Thomas2000; Reference Thomas, Ferrier, Kalaria, Davis and O'Brien2002a). This involved dewaxing in xylene, rehydration through alcohol washing, antigen retrieval in 0.01% citrate buffer (pH 6.0) and quenching in hydrogen peroxide. The sections were then covered in a blocking agent to minimize non-specific binding before the application of one of the primary antibodies. The monoclonal parvalbumin antibody (Sigma, USA) was applied at 1:2000 concentration, the polyclonal calretinin antibody (Sigma, USA) at 1:1000 concentration and the monoclonal calbindin at 1:1000 (Sigma, USA).
Several pilot studies were conducted to assess immunostaining and possible tissue damage after histological processing. The study revealed poor and/or incomplete calbindin expression in the majority of cases, and excessive non-specific staining around the edge of all sections; for this reason, analysis was not conducted on calbindin immunostaining or in layer 1 of parvalbumin and calretinin-stained sections (Figures 1a and 1b). As previously reported (Cotter et al., Reference Cotter2002a), detailed examination of calretinin immunostaining prior to analysis revealedlight background staining around pyramidal neurons; however, the staining was of insufficient intensity to exceed the threshold required for labeled tissue and therefore should have not have influenced the analytical outcome.
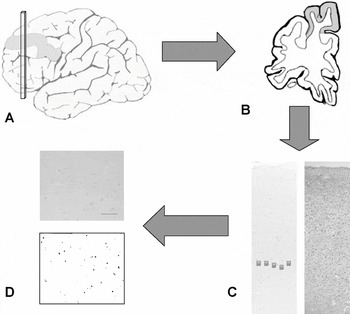
Standardized images of the parvalbumin- and calretinin-stained slides were captured using an objective lens on a Zeiss Axioplan 2 light microscope connected to a three-chip CCD true-color video camera (JVC KY F55B), white balanced, converted to monochrome and analyzed using Image Pro Plus software (Version 4.0; Media Cybernetics, MD, U.S.A.), based on previous protocols (Thomas et al., Reference Thomas2000; Reference Thomas, Ferrier, Kalaria, Davis and O'Brien2002a). Five images were captured for each section within the region of interest (DLPFC; BA9) at 10× magnification for the whole cortex and five images were taken at 20× magnification for layers 2, 3, 4, 5 and 6. Cell layers were identified by using a corresponding Nissl-stained section for the particular patient, where each layer was distinguished on the basis of the differences in the size, shape and distribution of their neurons, as previously described (Khundakar et al., Reference Khundakar, Morris, Oakley, McMeekin and Thomas2009) (Figure 2).
Schematic illustration of the methodological procedure. (A) Right hemisphere removed at autopsy, fixed in formalin and embedded in paraffin, blocked and cut into 10 μm sections. (B) The dorsolateral prefrontal cortex (DLPFC) identified in the X-Y axes using a standardized brain map. (C) Layers of the DLPFC identified at low magnification by comparison against equivalent Nissl-stained section. (D) Mean percentage of lamina-specific parvalbumin and calretinin immunostaining calculated at higher magnification (Image Pro Plus v.4.0; Media Cybernetics, MD, USA. Scale bar = 100 μm).

The primary measure in this study was the quantitative measurement of change in parvalbumin and calretinin immunoreactivity, which was assessed by accurately acquiring the mean percentage per area of immunohistochemical staining. Image Pro Plus software was used to highlight all pixels within the image that contained the antibody-linked stain. A background threshold level was assessed and preset, allowing only peak levels to be measured. The percentage per area data were then derived by dividing the total number of stained pixels by the total number of pixels within the image and multiplying by 100. All data were automatically acquired from the computational software.
Shapiro-Wilk test for normality revealed normal parvalbumin and calretinin immunostaining distribution within the DLPFC (p > 0.05), therefore equal variance and distribution was assumed. Statistical comparisons of data values and demographic variables between depressed and control groups were performed using unpaired Student's t-test, and effect size was calculated using Cohen's d test. Correlation of multiple variables was performed using Pearson's correlation test. All statistical analyses were carried out using SPSS software (Version 17.0).
Results
Patient characteristics
Subjects' characteristics are presented in Table 1 for the parvalbumin study and Table 2 for the calretinin study. No significant differences (p > 0.05) were found in the age of the patients, post-mortem delay, duration of fixation or pH between the two groups in either study.
Parvalbumin immunostaining
The mean percentage per area of parvalbumin immunostaining was fairly consistent across all layers measured in the DLPFC (Figure 1a); however, parvalbumin immunostaining was greater in layers 2, 3 and 5. No immunostaining appeared to be present in layer 1. There was a significant (31.8%) decrease in mean percentage per area of parvalbumin immunostaining in the depressed group in layer 6 (t = 2.1; F = 8.98; df = 18; p = 0.050; d = 1.04). The mean percentage per area of parvalbumin immunostaining was unchanged in the DLPFC overall (t = –0.76; F = 4.43; df = 18; p = 0.47; d = 0.37), as well as layer 2 (t = –0.07; F = 0.01; df = 18; p = 0.95; d = 0.03), layer 3 (t = –0.79; F = 0.22; df = 18; p = 0.44; d = 0.36), and layer 5 of the DLPFC (t = –0.88; F = 0.35; df = 18; p = 0.38; d = 0.41) in depressed patients when compared to control subjects. There was a non-significant trend toward an increase (31%) in the mean percentage per area of parvalbumin immunostaining in layer 4 (t = –0.89; F = 0.36; df = 18; p = 0.08; d = 0.83) in depressed patients (Figure 3).
Mean parvalbumin immunostaining (percentage per area) in layers of the DLPFC.

Calretinin immunostaining
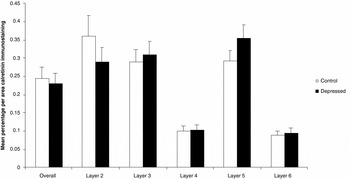
The mean percentage per area of calretinin immunostaining was higher in layers 2, 3, and 5, with a smaller amount of staining in layers 4 and 6 (Figure 1b), and layer 1. Immunostaining was not significantly different between depressed and control groups across all layers of the DLPFC overall (t = 0.43; F = 0.14; df = 19; p = 0.67; d = 0.19), layer 2 (t = 1.05; F = 0.14; df = 19; p = 0.31; d = 0.33), layer 3 (t = –0.35; F = 0.15; df = 19; p = 0.73; d = 0.09), layer 4 (t = –0.12; F = 0.23; df = 19; p = 0.34; d = 0.83), layer 5 (t = –1.34; F = 0.88; df = 19; p = 0.25; d = 0.69), and layer 6 (t = –0.34; F = 0.08; df = 19; p = 0.74; d = 0.07) (Figure 4).
Mean calretinin immunostaining (percentage per area) in layers of the DLPFC.

Correlation coefficients
Post-mortem delay appeared to have a significant effect on parvalbumin immunostaining across the whole DLPFC (r = 0.49; p = 0.013), as well as layer 3 (r = 0.46; p = 0.01) and 5 (r = 0.52; p = 0.02) but not in layer 2 (r = 0.63; p = 0.23), layer 4 (r = 0.31; p = 0.65) or layer 6 (r = 0.42; p = 0.89). Post-mortem delay also had a significant effect on calretinin immunostaining in layer 4 (r = 0.95; p = 0.03) but not on the whole DLPFC (r = –0.23; p = 0.29), layer 2 (r = –0.28; p = 0.21), layer 3 (r = –0.30; p = 0.17), layer 5 (r = 0.24; p = 0.91) or layer 6 (r = 0.21; p = 0.33) of the DLPFC. No significant effect (p > 0.05) of age, length of fixation, tissue pH on parvalbumin or calretinin immunostaining was found in any layer of the DLPFC.
Discussion
This study found a significant reduction in mean percentage per area parvalbumin immunostaining (p = 0.05) in layer 6 of DLPFC in elderly depressed patients compared with age-matched comparison subjects. However, no significant differences in calretinin or pavalbumin immunostaining were found in other layers or across the whole DLPFC in elderly depressed patients.
As previously reported in the prefrontal cortex (Lewis et al., Reference Lewis, Cruz, Melchitzky and Pierri2001; Beasley et al., Reference Beasley, Zhang, Patten and Reynolds2002), parvalbumin immunostaining was greatest in the middle cortical layers, with lower amounts present in layer 6. Likewise, calretinin immunostaining was highest in the middle cortical layers; however, unlike a previous study conducted in the prefrontal cortex (Beasley et al., Reference Beasley, Zhang, Patten and Reynolds2002), high calretinin immunostaining was found in layer 5. Although analysis was not conducted in layer 1 of the DLPFC, minimal to zero parvalbumin and calretinin expression was noted.
Parvalbumin and calretinin are expressed on two distinct non-pyramidal GABAergic neurons, with the majority of neurons expressing parvalbumin being basket and chandelier cells (Lewis and Lund, Reference Lewis and Lund1990; Akil and Lewis, Reference Akil and Lewis1992), and the majority calretinin-positive cells being bipolar, double bouquet and Cajal-Retzuis neurons (Jacobowitz and Winsky, Reference Jacobowitz and Winsky1991). The implication of the significant reduction in parvalbumin in layer 6 of the DLPFC in elderly depressed patients is unclear but as the proportion of layer 6 parvalbumin immunostaining in comparison to other layers appears low the impact of loss of parvalbumin-staining GABA basket or chandelier interneurons may be considered minimal. Nevertheless, such discreet alterations may be an indicator of underlying dysregulation of GABA-related tone of glutamatergic neurotransmission in pyramidal projections originating in the supragranular layers of the DLPFC (Lewis and Moghaddam, Reference Lewis and Moghaddam2006).
Pyramidal cells have been shown to be directly inhibited by cortical parvalbumin-containing interneurons (Gonzalez-Burgos et al., Reference Gonzalez-Burgos, Krimer, Povysheva, Barrionuevo and Lewis2005), whereas neocortical calretinin-labeled neurons extend from supragranular to infragranular layers and are thought to inhibit projection neurons extending along the cortical minicolumn (Gabbott et al., Reference Gabbott, Jays and Bacon1997). Morphometric analysis of the DLPFC has revealed a reduction in volume in pyramidal, but not non-pyramidal neurons, across all layers of the DLPFC, as well as a lamina-specific reduction in pyramidal neuron volume in layers 3 and 5 (Khundakar et al., Reference Khundakar, Morris, Oakley, McMeekin and Thomas2009). Disruption in pyramidal neuron morphology and function may therefore alter reciprocal GABAergic parvalbumin/calretinin-labeled neurons and pyramidal signaling. Whilst this study found no significant changes in parvalbumin or calretinin immunostaining in layers 3 and 5 of the DLPFC, the effect on parvalbumin or calretinin-containing neuron volume was not possible using the current methodology. However, a previous 3-D morphometric study in the DLPFC of elderly depressed patients using celloidin-embedded blocks found no significant difference in parvalbumin-labeled neuron density or volume in depressed patients of all ages (Rajkowska et al., Reference Rajkowska, O'Dwyer, Teleki, Stockmeier and Miguel-Hidalgo2007). Furthermore, no changes were found in parvalbumin- or calretinin-labeled neurons within any layer the DLPFC of depressed patients (Beasley et al., Reference Beasley, Zhang, Patten and Reynolds2002). However, Rajkowska et al. (Reference Rajkowska, O'Dwyer, Teleki, Stockmeier and Miguel-Hidalgo2007) did find a reduction in the volume and density of calbindin-positive in the DLPFC of depressed patients of all ages. This may therefore indicate a predominant role for calbindin- but not parvalbumin- or calretinin-labeled interneurons in the pathophysiological processes underlying morphological changes in pyramidal neurons in the DLPFC in depression. Because our 3-D post-mortem study in the DLPFC (Khundakar et al., Reference Khundakar, Morris, Oakley, McMeekin and Thomas2009), as well as the previous morphometric study in the OFC (Rajkowska et al., Reference Rajkowska, Miguel-Hidalgo, Dubey, Stockmeier and Krishnan2005), used Nissl stain to label cells, differentiation between different types of non-pyramidal neurons was not possible by morphological means. Thus, although no changes were found in non-pyramidal neurons in the DLPFC overall, separate interneurons may have been differentially affected. Nevertheless, as GABAergic interneurons possess non-pyramidal morphology, the overall findings of no change in non-pyramidal neuron populations are consistent with the findings in this study.
Study limitations
This study set out to examine the possible morphometric changes in GABAergic neuronal subpopulations within the DLPFC of patients with late-life depression by using a preferred 3-D stereological protocol (Khundakar et al., Reference Khundakar, Morris, Oakley, McMeekin and Thomas2009; Reference Khundakar, Morris, Oakley and Thomas2010). The “optical disector” method (Gundersen et al., Reference Gundersen1988) requires the use of thick sections (30–50 μm) and the complete penetration of the antibody-linked stain through the entire z-axis. Distribution plots from several pilot experiments revealed incomplete parvalbumin and calretinin staining, meaning that 3-D analysis of neuronal number and volume was not feasible. This study therefore employed the widely used alternative pixel ratio analytical method, allowing the use of thinner 10-μm sections.
Another limitation of this series of experiments was the non-inclusion of the calbindin antibody data. Despite numerous attempts and manipulation of the methodological protocol, calbindin immunostaining was poor and/or incomplete. This appeared to have been due to inherent technical issues associated with the use of paraffin embedded tissue. Another technical issue arose from the apparent influence of post-mortem delay on parvalbumin immunostaining in layers 3 and 5 and across the whole DLPFC and calretinin immunostaining in layer 4 only. This correlation appears to be mainly due to the large range in post-mortem delay among patients used in the study. There was, however, no significant correlation between post-mortem delay and immunostaining in the layer (6) where significance was found. Furthermore, no significant differences in post-mortem delay were found between groups.
An additional inevitable factor of studies of this kind is the incidence of antidepressant therapy use in the depressed patient group. Acute antidepressant drug activation, via GABAergic transmission after monoamine receptor activation, has been shown to have an inhibitory effect on a molecule closely associated with antidepressant therapeutic action, brain-derived neurotrophic factor (BDNF). However, chronic antidepressant administration has been shown to result in an increase in BDNF, suggesting a dampening of GABAergic regulation (Khundakar and Zetterstrom, Reference Khundakar and Zetterström2006). The effect on GABAergic function on this study is therefore unlikely to be the result of chronic antidepressant therapy.
Conclusion
This study found a significant reduction in the mean percentage per area immunostaining of the calcium binding protein parvalbumin in layer 6 (p = 0.05) of the DLPFC of elderly depressed patients against age-matched controls. However, no significant changes in mean percentage per area parvalbumin or calretinin immunostaining were found in other layers DLPFC or across the DLPFC as a whole.
Conflict of interest
None.
Description of authors' roles
Ahmad Khundakar, Alan Thomas and Christopher Morris initially devised the experiment. Alan Thomas acquired the clinical information. Ahmad Khundakar performed all experimental and analytical work. Ahmad Khundakar and Alan Thomas had an equal role in writing the paper.
Acknowledgments
We sincerely thank the NIHR Biomedical Research Centre for Ageing and Age-related Disease for their support of this study. We also thank the staff at the Newcastle Brain Tissue Resource for their assistance, and Arthur Oakley, Janet Slade, Ros Hall and Mary Johnson for extremely helpful technical advice.