Introduction
The perception of chromatic signals is an important feature in the primate visual system. Processing of the visual information starts within the neuronal circuits of the retina—hence, color sensation has its origin here. But what are the basic prerequisites for trichromatic color vision? Based on short (S, blue), middle (M, green), and long (L, red) wavelength–sensitive cone types, parallel pathways are formed to transmit chromatic signals into the brain. The segregation of these chromatic channels occurs already at the cone pedicle, which is the synapse between cones and second order neurons.
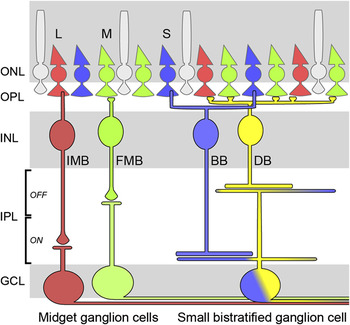
Cone-selective wiring of bipolar cells is well known from primate retina (Fig. 1). The signals of M- and L-cones are relayed to the ganglion cells either via “diffuse” bipolar cells, unselectively contacting several cones within their dendritic field, or via “midget” bipolar cells (Boycott & Wässle, Reference Boycott and Wässle1999). Midget bipolar cells contact only a single cone in the central retina, and these cells in turn innervate only a single midget ganglion cell (Kolb & Dekorver, Reference Kolb and Dekorver1991). Thus, midget cells create a “private-line” transmission of M- or L-cone signals to the brain, serving high spatial resolution and red/green color information. In contrast, S-cones innervate an S-cone–selective “blue” ON bipolar cell (Mariani, Reference Mariani1984; Kouyama & Marshak, Reference Kouyama and Marshak1992; Wässle et al., Reference Wässle, Grünert, Martin and Boycott1994; Luo et al., Reference Luo, Ghosh, Martin and Grünert1999). Although this blue cone bipolar cell has long meandering dendrites similar to diffuse wide-field bipolar cells, it contacts S-cones only. As a consequence, M- and L-cones are spared and blue-ON signals are transmitted onto ganglion cells. The latter were identified as a class of “small bistratified” ganglion cells (Dacey & Lee, Reference Dacey and Lee1994; Ghosh et al., Reference Ghosh, Martin and Grünert1997) besides other ganglion cell types, which were also found to exhibit blue-ON responses (Dacey & Packer, Reference Dacey and Packer2003).
Color-coded pathways in the primate retina. In the central primate retina, invaginating ON midget bipolar cells (IMB) and FMB cells are each connected to one long (L) or middle (M) wavelength–sensitive cone only and they innervate individual midget ganglion cells. Hence, they form a color-coded private-line transmission of cone signals to the brain. The small bistratified ganglion cell receives ON input from short (S) wavelength–sensitive cones via blue cone bipolar cells (BB) and OFF signals from diffuse bipolar cells (DB). The latter are mainly connected to M- and L-cones. Therefore, they provide yellow-OFF input for the small bistratified cell. ONL/INL, outer/inner nuclear layer; GCL, ganglion cell layer. (This schematic has been modified from a template by Thomas Euler.)

Small bistratified cells receive synaptic input from blue-ON bipolar cells onto their inner dendritic tree in the ON sublamina of the inner plexiform layer (IPL). Furthermore, these ganglion cells are innervated by OFF bipolar cells via synaptic contacts onto the outer dendritic tree in the IPL’s OFF sublamina (Calkins et al., Reference Calkins, Tsukamoto and Sterling1998; Ghosh & Grünert, Reference Ghosh and Grünert1999; Percival et al., Reference Peichl and Dartt2009). The OFF bipolar cells contact mainly M- and L-cones (Lee & Grünert, Reference Lee and Grünert2007), therefore providing a “yellow-OFF” signal transmission. The combination of excitatory blue-ON and yellow-OFF input creates color-opponent signals in the small bistratified cell (Dacey & Lee, Reference Dacey and Lee1994; Field et al., Reference Field, Sher, Gauthier, Greschner, Shlens, Litke and Chichilnisky2007; Crook et al., Reference Crook, Davenport, Peterson, Packer, Detwiler and Dacey2009). Color-opponent signal processing in ganglion cells is essential: cone signals as conveyed by the parallel pathways have to be compared at the level of ganglion cells to discriminate chromatic information. In the case of midget ganglion cells, color opponency is achieved by an antagonistic center-surround organization of their receptive fields (L- vs. M-cone signals; Dacey & Packer, Reference Dacey and Packer2003; Crook et al., Reference Crook, Manookin, Packer and Dacey2010).
It is well known that cones of dichromats also express opsins, which are tuned to different wavelengths (S and M; Peichl, Reference Peichl2005). Hence, the very basic prerequisite for color vision is given, but do dichromatic mammals possess such a retinal circuit for color vision as shown for trichromats? Here, we review evidences for color vision pathways in retinas of different dichromatic mammalian species in comparison to trichromats. Furthermore, we provide new anatomical data on neuronal cell types involved in dichromatic color processing.
S-cone–selective ON bipolar cells
As described above, the proof of color-opponent signal processing was originally established in trichromats (L vs. M and S vs. “yellow”) by recording the corresponding signals in ganglion cells. However, the segregation and subsequent comparison of S- vs. M-cone signals are thought to be the phylogenetically ancient system of color vision (Mollon, Reference Mollon1989), while trichromacy occurred “just recently” in mammals from an evolutionary point of view (Nathans, Reference Nathans1999).
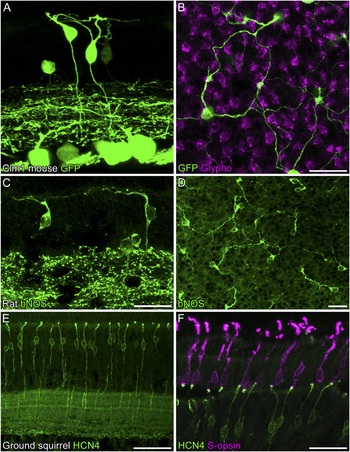
One of the key features of retinal pathways for trichromatic color vision is the blue cone bipolar cell transmitting signals from S-cones to specific ganglion cells. The existence of an S-cone–selective bipolar cell in nonprimate dichromats has been suggested by the morphology of certain cells with sparse wide-field dendritic trees (“b5” in cat, Cohen & Sterling, Reference Cohen and Sterling1990; “Wb” in rabbit, Famiglietti, Reference Famiglietti1981; Jeon & Masland, Reference Jeon and Masland1995; “type 9” in rat, Euler & Wässle, Reference Euler and Wässle1995; “type 9” in mouse, Ghosh et al., Reference Ghosh, Bujan, Haverkamp, Feigenspan and Wässle2004; Pignatelli & Strettoi, Reference Percival, Jusuf, Martin and Grünert2004). Evidence of mouse type 9 cells being blue cone bipolar cells was provided by Haverkamp et al. (Reference Haverkamp, Wässle, Duebel, Kuner, Augustine, Feng and Euler2005) (and Fig. 2A and 2B in the present review), where the S-cone–selective wiring of this cell was shown in transgenic Clomeleon-1 mice (see supplemental material for additional details about animals and antibodies). Subsequently, the wide-field bipolar cell of rabbit retina was also defined as an S-cone–selective cell (MacNeil & Gaul, Reference MacNeil and Gaul2008). S-cone–selective contacts of rat type 9 cells still have to be demonstrated. However, we are now able to provide new results from rat retina by staining the whole population of type 9 cells with antibodies against brain nitric oxide synthase (bNOS; Fig. 2C and 2D). The low cell density together with the characteristic pattern of long meandering dendrites converging onto putative cone pedicles strongly suggest that rat type 9 cells are blue bipolars as observed in mouse, rabbit, and primate retinas.
Blue cone bipolar cells in dichromats. (A) Confocal image of vertical sections of Clomeleon-1 (Clm1) mouse retina. The fluorescence signal of Clm expression was enhanced by staining with antibodies against green fluorescent protein (GFP). In addition to other neurons, two S-cone–selective type 9 bipolar cells are shown in this picture. (B) GFP labeling of type 9 bipolar cells in the whole-mounted Clm1 retina. A projection of a confocal stack at the level of the OPL is shown. The tissue was counterstained with antibodies against glycogen phosphorylase (Glypho) to label the cone pedicles. Blue cone bipolar cells have long meandering dendrites converging onto S-cone pedicles. (C and D) Staining of brain nitric oxide synthase (bNOS) in vertical sections (C) and in whole-mounted retina (D) of the rat. The labeled cells show the typical dendritic morphology of blue cone bipolars. (E) Vertical sections of ground squirrel retina labeled against HCN4. The image shows b1 bipolar cells with a midget-like morphology. (F) Double labeling of HCN4 and S-cones with antibodies against S-opsin demonstrates that b1 cells of the ground squirrel retina are S-cone–selective bipolar cells. Scale bars: 20 μm for (A and B) in (B); 20 μm in (C and D); 50 μm in (E); 30 μm in (F).

In ground squirrel we now found that b1 bipolar cells are labeled with antibodies against HCN4 (Fig. 2E) whereas this marker labels type 3a bipolar cells in mouse (Mataruga et al., Reference Mataruga, Kremmer and Müller2007) and type 3 and type 5b bipolar cells in rat (Fyk-Kolodziej & Pourcho, Reference Fyk-Kolodziej and Pourcho2007). Ground squirrel b1 cells were originally identified in Golgi preparations and described as homologs to primate ON midget bipolar cells (West, Reference West1976). That interpretation was based on the cell’s dendritic morphology because the dendrites of each cell contact in most cases only one cone pedicle. Here, we show that b1 cells are actually S-cone–selective bipolars by double immunostainings with antibodies against HCN4 and S-opsin (Fig. 2F), as already suggested by Linberg et al. (Reference Linberg, Suemune and Fisher1996). The rather unusual “midget-like” morphology if compared to blue bipolars of other species was observed at all eccentricities, and it appears to be due to the high blue cone density in ground squirrel retinas (Kryger et al., Reference Kryger, Galli-Resta, Jacobs and Reese1998). In rare cases, midget-like or “single-headed” blue cone bipolar cells were also observed in macaque (Kouyama & Marshak, Reference Kouyama and Marshak1992; Wässle et al., Reference Wässle, Grünert, Martin and Boycott1994) and mouse retinas (our studies, data not shown).
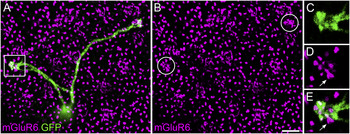
All these blue cone bipolar cells are thought to be ON cells because their axon terminals end in the innermost part of the IPL adjacent to the ganglion cell layer. Li and DeVries (Reference Li and DeVries2006) were the first to directly prove ON responses of blue cone (b1) bipolars by patch-clamp recordings in slice preparations of ground squirrel retinas. They electrically stimulated S-cones and recorded hyperpolarizing responses in b1 bipolar cells. Recently, blue-ON responses were also demonstrated for mouse type 9 cells in retinal slices by patch-clamp recordings and light stimulation of cones (Breuninger et al., Reference Breuninger, Puller, Haverkamp and Euler2009). In line with this and according to anatomical data from primate blue cone bipolars (Vardi et al., Reference Vardi, Duvoisin, Wu and Sterling2000), we can now show that the corresponding glutamate receptor of retinal ON bipolar cells (mGluR6) is in register with the dendritic tips of blue cone bipolar cells in the mouse retina (Fig. 3).
mGluR6 is expressed by blue cone bipolar cells in mice. (A and B) Double labeling of mGluR6 and GFP in the whole-mounted Clm1 mouse retina. A projection of confocal stacks at the level of the OPL is shown. mGluR6 appears to be clustered more densely at S-cone pedicles (encircled in B) as compared to clusters at other cone pedicles. (C–E) Single confocal section of the boxed region in (A). mGluR6 is colocalized with the dendritic tips of the blue bipolar cell. The arrow points toward mGluR6 immunoreactivity, which belongs to receptor staining in a neighboring rod as identified in the z-stack by its size and shape typical for mGluR6 staining at rod spherules. Scale bar: 5 μm

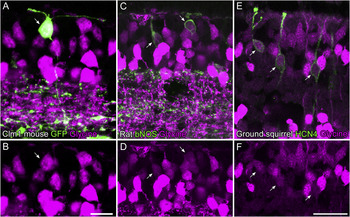
Furthermore, it has been shown by physiological and anatomical approaches that small bistratified ganglion cells in the macaque monkey retina receive significant rod input (Field et al., Reference Field, Greschner, Gauthier, Rangel, Shlens, Sher, Marshak, Litke and Chichilnisky2009). This occurs due to gap junctional coupling of blue cone bipolar cell axon terminals with processes of AII amacrine cells. We have now good reasons to believe that blue bipolar cells are coupled to AII cells also in retinas of dichromats. Glycinergic amacrine cells display strong glycine immunoreactivity; however, weaker glycine immunoreactivity is also present in ON cone bipolar cells, which receive glycine through gap junctions from AII amacrine cells (Vaney et al., Reference Vaney, Nelson and Pow1998). Hence, we used glycine as a marker for gap junctional coupling with putative AII cells. Double labeling of glycine and blue cone bipolar cells revealed that the latter are positive for glycine in mouse, rat, and ground squirrel retinas (Fig. 4). Thus, our results suggest that rod signals enter the blue-ON pathway also in dichromats. However, we cannot rule out that the glycine immunoreactivity of these blue bipolar cells may also be based on gap junctional coupling to glycinergic amacrine cell types other than the AII.
Blue cone bipolar cells contain glycine. Double labelings of glycine and blue cone bipolar cell markers in vertical sections of retinas from three different species are shown (A mouse, Clm1; C rat, bNOS; E ground squirrel, HCN4). Blue cone bipolar cells (arrows) show glycine immunoreactivity in all three species. Single channels of the corresponding glycine stains are shown in the lower row of images (B, D, and F). Scale bars: 10 μm for (A and B) in (B); 20 μm for (C–F) in (F).

Chromatic OFF channels
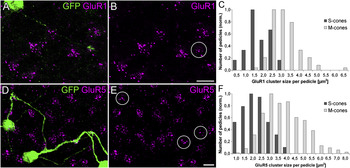
In primate retina, DB2 and DB3 bipolar cells are supposed to create the yellow-OFF channel as derived from contacts of their axon terminals with the OFF tier of the small bistratified ganglion cell (Calkins et al., Reference Calkins, Tsukamoto and Sterling1998). Accordingly, their dendritic connections appear to be biased against S-cones (Chan et al., Reference Chan, Martin, Clunas and Grünert2001; Lee & Grünert, Reference Lee and Grünert2007). The existence of green-OFF bipolar cells in retinas of the dichromatic ground squirrel has been shown by Li and DeVries (Reference Li and DeVries2006). They demonstrated by dual patch recordings from cones and bipolar cells as well as by anatomical experiments that b3 and b7 OFF bipolar cells avoid contacts with S-cones. Our data suggest a comparable mechanism in the mouse retina. OFF bipolar cells express the ionotropic glutamate receptor subunits GluR1 and GluR5 on their dendritic tips, and it is known that GluR5 expression is reduced at S-cones (macaque, Haverkamp et al., Reference Haverkamp, Grünert and Wässle2001a; ground squirrel, Li & DeVries, Reference Li and DeVries2004; mouse, Haverkamp et al., Reference Haverkamp, Wässle, Duebel, Kuner, Augustine, Feng and Euler2005; cat, see Fig. 7B). We have performed a detailed analysis of the GluR densities beneath mouse cone pedicles and observed that the expression levels of both GluR subunits are strongly reduced at S-cones as compared to M-cones (Fig. 5; see supplemental material for additional details on the analysis). The mean size of GluR1 clusters at M-cone pedicles (n = 89) was 2.9 ± 0.8 μm2, while it was only 1.5 ± 0.6 μm2 at S-cones (n = 17; P < 0.001). GluR5 clusters at M-cones (n = 469) had a size of 3.6 ± 1.2 μm2 and 2.0 ± 0.8 μm2 at S-cones (n = 80; P < 0.001).
Ionotropic GluRs are reduced at S-cones in mice. Double labeling of GFP and GluR1 (A and B) or GluR5 (D and E) in whole-mounted retinas of Clm1 mice. Projections of confocal images at the level of the OPL are shown. Staining of the blue cone bipolar cells was used to mark the position of S-cone pedicles (circled in B and E). The densities of GluR1 and GluR5 immunoreactive puncta are reduced at S-cone pedicles in comparison to M-cones. Measurements of GluR cluster sizes (C and F) revealed that this reduction is statistically significant for both GluR subunits (P < 0.001). Scale bars: 5 μm.

To correctly interpret these results, one has to take into account that the morphology of S-cone pedicles may differ from M-cone pedicles. It has been reported for the primate retina that S-cone pedicles are smaller than M-/L-cone pedicles (Ahnelt et al., Reference Ahnelt, Keri and Kolb1990), and their postsynaptic processes are more densely packed (Haverkamp et al., Reference Haverkamp, Grünert and Wässle2001b, Lee & Grünert, Reference Lee and Grünert2007). Measurements of cone pedicle bases (labeled with antibodies against glycogen phosphorylase, see Fig. 2B) revealed that mouse S-cone pedicles are ~15% smaller than M-cone pedicles (unpublished data). However, such a small difference in pedicle size cannot explain the immense reduction of the GluRs at S-cones. Thus, the results suggest that not all OFF bipolar cell types contact S-cones. This idea is further supported by a combined study of electrophysiological recordings and selective stainings of different mouse OFF bipolar cell dendrites at cone pedicles (Breuninger et al., Reference Breuninger, Puller, Haverkamp and Euler2009). A “green-OFF bipolar cell” collecting input only from M-cones would be the ideal candidate to form a chromatic pathway antagonistically to the blue-ON signal transmission.
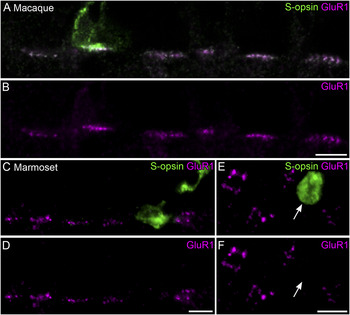
We also studied the GluR expression in di- and trichromatic primates and found that GluR1 is strongly reduced at S-cone pedicles in marmoset retina (Puller et al., Reference Puller, Haverkamp and Grünert2007), while it is clustered beneath S-cones of macaque retina (Fig. 6) (Haverkamp et al., Reference Haverkamp, Grünert and Wässle2001b). This is interpreted as follows: GluR1 is mainly expressed by flat (OFF) midget bipolar (FMB) cells as demonstrated in the marmoset (Puller et al., Reference Pignatelli and Strettoi2007), and FMBs avoid contacts with S-cone pedicles in this species (Lee et al., Reference Lee, Telkes and Grünert2005). In contrast, S-cones in the macaque monkey retina contact FMBs and they in turn are connected to midget ganglion cells (Klug et al., Reference Klug, Herr, Ngo, Sterling and Schein2003). These anatomical results are supported by physiological data from Sher et al. (Reference Sher, Field, Greschner, Shlens, Machado, Gunning, Mathieson, Litke and Chichilnisky2009) who showed S-cone signals in OFF midget ganglion cells of the macaque retina.
GluR1 at primate S-cones. (A and B) Double labeling of GluR1 and S-opsin JH455 in vertical sections of macaque retina. The staining shows that GluR1 is clustered at S-cone pedicles. Because both antibodies were raised in rabbits, the section was initially labeled with GluR1 and the corresponding secondary antibodies. Subsequently, it was labeled against S-opsin. Hence, GluR1 immunoreactivity appears also in the green channel. (C–F) Double labeling of GluR1 and S-opsin (raised in goat) in vertical (C and D) and horizontal (E and F) sections of the marmoset retina. GluR1 is absent from the S-cone pedicles (arrows in E and F). Scale bars: 5 μm.

The role of such an S-OFF midget pathway for color vision remains to be elucidated, which is of particular interest because this pathway is missing in marmosets, while it is present in the macaque retina. The only studies suggesting the existence of a blue-OFF cone bipolar cell in dichromats were conducted in rabbit retina, where putative S-cone–selective connections of presumed OFF “Wa” bipolar cells were shown by dye injection of single cells (Liu & Chiao, Reference Liu and Chiao2007) or Golgi-stained specimen (Famiglietti, Reference Famiglietti1981, Reference Famiglietti2008).
Horizontal cells and color vision
Most of our knowledge of how inhibitory interneurons are involved in color vision has been obtained again from studies of primate retina. The primate retina has two types of horizontal cells (H1 and H2), which both exhibit a cone specific connectivity (Dacey et al., Reference Dacey, Lee, Stafford, Pokorny and Smith1996; Goodchild et al., Reference Goodchild, Chan and Grünert1996). H1 cells contact M- and L-cones but largely avoid S-cones. In contrast, H2 cells show a preference for S-cones and make only sparse connections with M- and L-cones. Horizontal cells themselves lack color opponency (Dacey et al., Reference Dacey, Lee, Stafford, Pokorny and Smith1996), but it is now known that they play a fundamental role in color vision. Due to the inhibitory feedback to cones, horizontal cells shape the receptive fields of the small bistratified ganglion cell already at the level of the outer plexiform layer (OPL) (Crook et al., Reference Crook, Davenport, Peterson, Packer, Detwiler and Dacey2009). Furthermore, Packer et al. (Reference Packer, Verweij, Li, Schnapf and Dacey2010) were now able to show that H2 cells create blue–yellow opponent signals in S-cones. The finding of spectral opponency occurring at the level of the OPL has intriguing implications for color processing in dichromatic retinas and will be discussed below.
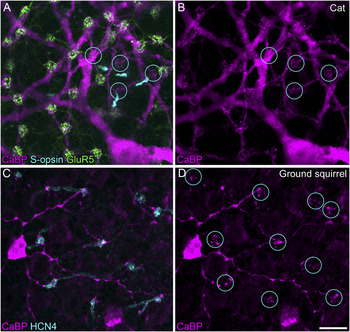
The role of horizontal cells for color vision in dichromatic mammals is still unknown. Horizontal cells of most of the nonprimate dichromats are termed A and B type: A-type horizontal cells are axonless, while B-type cells have an axon terminal system, which is connected to rods; and both types form contacts unselectively with S- and M-cones (Peichl, Reference Peichl2010). Retinas of almost all species investigated feature these two types of horizontal cell types—with a few exceptions including mouse and rat, where only B-type horizontal cells are found (Peichl & González-Soriano, Reference Peichl and González-Soriano1994). It is possible to label A-type cells (as well as H2 cells) with antibodies against the calcium-binding protein calbindin (CaBP) in diverse species (e.g., rabbit, Röhrenbeck et al., Reference Röhrenbeck, Wässle and Heizmann1987; cat, Röhrenbeck et al., Reference Röhrenbeck, Wässle and Boycott1989; macaque, Wässle et al., Reference Wässle, Dacey, Haun, Haverkamp, Grünert and Boycott2000). Fig. 7A and 7B shows a whole-mounted cat retina triple labeled against CaBP, GluR5, and S-opsin. It becomes obvious that A-type cells of the cat form unselective contacts with M- and S-cones as observed in other species, like rabbit (Hack & Peichl, Reference Hack and Peichl1999) and tree shrew (Müller & Peichl, Reference Müller and Peichl1993). The horse is the only dichromat known so far with A-type cells that break the rule of unselective cone contacts because they get input from S-cones only (Sandmann et al., Reference Sandmann, Boycott and Peichl1996). Linberg et al. (Reference Linberg, Suemune and Fisher1996) have speculated that H2 (or A type) horizontal cells of the ground squirrel may also be S-cone selective as derived from the dendritic morphology of Golgi-stained cells. Here, we are able to provide evidence for the S-cone selectivity of H2 cells in the ground squirrel retina by costaining with CaBP and HCN4 as selective marker for the blue cone bipolar cell (Fig. 7C and 7D): Instead of contacting all overlying cones, CaBP-labeled H2 dendrites formed clusters of dendritic tips only at S-cone pedicles. The physiological meaning of these S-cone–selective “true blue” horizontal cells in dichromats remains to be shown. Further studies will be necessary to reveal the function of the diverse horizontal cell types for color vision in dichromatic mammals.
CaBP-immunoreactive horizontal cells. (A and B) Triple labeling of calbindin (CaBP), S-opsin, and GluR5 in the whole-mounted cat retina. Projection of an image stack from the outer border of the INL through the OPL is shown. The locations of S-cone pedicles (encircled) were identified by the relative position of S-opsin–immunoreactive outer S-cone segments (overlaid in A) and by the reduction of GluR5 at these sites as compared to M-cones. The CaBP-labeled A-type horizontal cells unselectively contact M- and S-cone pedicles as dendritic contacts can also be seen at the latter. (C and D) Double labeling of CaBP and HCN4 (as a marker for the position of S-cones, encircled in D) in the whole-mounted ground squirrel retina. CaBP-immunoreactive H2 (or A-type) horizontal cells are S-cone selective. Scale bar: 10 μm.

Color-opponent ganglion cells in dichromats
Physiological measurements have revealed S/M opponent ganglion cells in several species (Michael, Reference Michael1966; Cleland & Levick, Reference Cleland and Levick1974; Caldwell & Daw, Reference Caldwell and Daw1978; Jacobs et al., Reference Jacobs, Blakeslee and Tootell1981; Ekesten et al., Reference Ekesten, Gouras and Yamamoto2000; Hemmi et al., Reference Hemmi, James and Taylor2002). Ekesten and Gouras (Reference Ekesten and Gouras2005) showed by extracellular recordings from mouse retinal ganglion cells that a small fraction of the cells showed S/M opponent signals. In ground squirrel, spectral response tests on optic nerve fibers demonstrated that about 25% of the ganglion cells were blue–green opponent and about two thirds of those color-opponent ganglion cells had blue-ON green-OFF responses (Jacobs & Tootell, Reference Jacobs and Tootell1981). However, the morphology of the ganglion cells were not retrieved due to the methods applied in these studies. A more detailed study was conducted in guinea pig retina (Yin et al., Reference Yin, Smith, Sterling and Brainard2009) where some ganglion cells showed blue-ON/green-OFF, others green-ON/blue-OFF opponency. The morphology of these ganglion cells was recovered during the recordings: interestingly, they were monostratified in the ON sublamina of the IPL. One possible mechanism for such color-opponent signals in monostratified cells could be input from chromatically tuned amacrine cells. However, the amacrine cell types that could provide such a chromatic signal have not yet been identified.
As mentioned above, blue–yellow opponency exists already in S-cones at the level of the OPL (Packer et al., Reference Packer, Verweij, Li, Schnapf and Dacey2010). Color-opponent signals could then be conveyed by single bipolar cell types—the blue cone bipolar cell in that case—onto ganglion cells. This is consistent with the results of Field et al. (Reference Field, Sher, Gauthier, Greschner, Shlens, Litke and Chichilnisky2007) where the yellow-OFF response was abolished in the small bistratified cell of primate retina by pharmacologically blocking the ON pathway transmission. In addition, further monostratified color-opponent ganglion cells were identified in primate retina (Dacey & Packer, Reference Dacey and Packer2003; Dacey et al., Reference Dacey, Liao, Peterson, Robinson, Smith, Pokorny, Yau and Gamlin2005). It is very likely that one of these mechanisms—color-opponent signal transfers directly via bipolar cells or via color-coded amacrine cells—or a combination of both could be responsible for color opponency in monostratified ganglion cells of the macaque retina and in those of nonprimate dichromats. This holds especially true for the latter because there is still a lack of evidence for bistratified color-opponent ganglion cells in nonprimate dichromatic retinas.
Conclusions
Our data together with the results of other studies indicate that retinas of dichromatic mammals possess neuronal pathways, which are required for color discrimination. This raises the question whether dichromats are able to use the color cues from their retinas. Depending on habitat and lifestyle, color vision may not play such an important role for some species as it does for primates, so the evolutionary pressure to develop or maintain chromatic channels is probably low for many nonprimate dichromats. Evidence exists that color-coded pathways beyond the retina are preserved in mice (Ekesten & Gouras, Reference Ekesten and Gouras2008) and thus they may provide color signals to higher brain regions similar to what has been shown for primates (Martin, Reference Martin2004). Jacobs et al. (Reference Jacobs, Williams, Cahill and Nathans2007) introduced human L-opsin into mouse retinas and performed behavioral tests on these animals, which demonstrated that the mouse brain can even discriminate trichromatic color information. This indicates that color-specific pathways exist up to the visual cortex in nonprimate dichromats. However, their precise wiring as compared to the koniocellular pathway in primates still has to be shown.
Besides the elucidation of these pathways beyond the retina, it is now challenging to identify chromatically tuned neurons in the IPL and to analyze their synaptic circuitry in dichromats: Which ganglion cell types are contacted by blue cone bipolars? What is the role of amacrine cells putatively involved in color vision? Answering these questions will certainly become a major contribution to the field of color vision research.
Acknowledgments
This study was supported by DFG grant HA 5277/2-2. We are grateful to D. Nikolić for providing cat retinas and D. Vaughan for ground squirrel tissue. Thanks to T. Euler for providing the template for Fig. 1. We thank B. Hamprecht, S. Nakanishi, J. Nathans, B. Pfeiffer-Guglielmi, and D. Pow for providing antibodies as well as U. Grünert and H. Wässle for critically reading the manuscript.