Implications
There are two contrasting direct effects of Texel muscling quantitative trait locus (TM-QTL): (i) on loin muscling (4% to 11% increase in highly priced part of the carcass) exhibiting polar overdominance, and (ii) an additive effect on live and carcass weight. This makes TM-QTL an interesting candidate for exploitation within the UK sheep industry and beyond, especially since no major negative impacts on eating quality have been observed. However, there are two main aspects to consider before commercial exploitation is feasible: (i) the development of a commercial genotyping test and (ii) an optimal plan for exploitation in the industry.
Introduction
A quantitative trait locus (QTL) for muscle depth on OAR18, termed the TM-QTL, was first identified in purebred Texel sheep in the United Kingdom by Walling et al. (Reference Walling, Visscher, Wilson, McTeir, Simm and Bishop2004). In this original study, the effect of carrying a single copy of TM-QTL inherited from the sire was a 1 to 2 mm increase in ultrasound muscle depth (+4% to +11%). In a further study using crossbred lambs sired by Texel rams heterozygous for TM-QTL, with Mules or Welsh Mountain ewes as their dams (Macfarlane et al., Reference Macfarlane, Lambe, Bishop, Matika, Rius-Vilarrasa, McLean, Haresign, Wolf, McLaren and Bunger2009; Masri et al., Reference Masri, Macfarlane, Lambe, Haresign, Brotherstone and Bunger2011) reported a 4% to 11% effect on muscling, specific to the loin region, of carrying a single copy of the QTL. No effect was observed on other carcass traits.
There is evidence that QTL or mutations affecting muscling that lie in the area of OAR18 where TM-QTL is located may show imprinting, specifically polar overdominance in which the QTL effect is expressed only if the QTL is inherited from the sire and not from the dam. This mode of inheritance was first observed for the Callipyge mutation, which has substantial muscling effect in sheep and lies in a similar region of OAR18 to TM-QTL (Cockett et al., Reference Cockett, Jackson, Shay, Nielsen and Moore1994b and Reference Cockett, Jackson, Snower, Shay, Berghmans, Beever, Carpenter and Georges1996a; Cockett et al., Reference Cockett, Jackson, Shay, Farnir, Berghmans, Snowder, Nielsen and Georges1996b; Georges and Cockett, Reference Georges and Cockett1996). Additionally, the Carwell QTL (synonymous with LM-QTL, LoinMax) (Nicoll, Reference Nicoll2007), which also lies in the region of OAR18 and affects loin muscling to a similar degree as TM-QTL, also appears to have a non-additive mode of inheritance (Jopson et al., Reference Jopson, Nicoll, Stevenson-Barry, Duncan, Greer, Bain, Gerard, Glass, Broad and Mcewan2001; Nicoll, Reference Nicoll2007). Lastly, previous work on TM-QTL by Matika et al. (Reference Matika, Sechi, Pong-Wong, Houston, Clop, Wooliams and Bishop2011), examining maternal and paternal variance components for the TM-QTL in commercial Texel lambs, using ultrasound muscle depth as their phenotype, reported results that were also consistent with paternal polar overdominance.
Interestingly, alongside its effect on muscling, TM-QTL appears to have an additive effect on live and carcass weights; animals carrying two copies of TM-QTL were substantially heavier at a fixed age than wild type animals (Macfarlane et al., Reference Macfarlane, Lambe, Haresign and Bunger2012). Although no effects have been reported on carcass traits other than in the loin region, given the effect on live and carcass weights seen in homozygote carriers, it is important to know whether overall carcass composition and tissue distribution traits are affected by TM-QTL, and the nature of any effects on these traits.
The aim of this study was to investigate the effect of TM-QTL, in purebred Texel lambs on a range of carcass trait. These included traits measured by ultrasound scanning (muscle and fat depths in the loin region), by x-ray computed tomography (CT) scanning (carcass and joint composition, muscularity) and by commercially relevant butchery (lean meat yields, tissue weight distribution). Critically, for the first time, the experimental group included representatives of all TM-QTL genotypes (wild type, heterozygotes inheriting TM-QTL from either the sire or the dam, and homozygote carriers), enabling formal testing of the hypothesis that TM-QTL displays polar overdominance for a range of muscling traits. Testing this hypothesis was the third aim of this study.
Material and methods
All procedures involving animals were approved by the Scotland’s Rural College (SRUC) Animal Ethics Committee and were performed under UK Home Office licence, following the regulations of the Animals (Scientific Procedures) Act 1986.
Position of TM-QTL
A population of Texel sheep located across two farms, one in Wales (IBERS) and one in Scotland (SRUC), was recorded and monitored over 4 years from 2005 to 2009. The SRUC Texel flock had been purchased from The Roslin Institute in 2002 and the presence of TM-QTL, an OAR18 QTL for muscle depth reported by Walling et al. (Reference Walling, Visscher, Wilson, McTeir, Simm and Bishop2004), was maintained and its frequency increased in the flock between 2002 and 2005. Sires that had been previously identified as likely carriers of TM-QTL were also mated to existing Texel ewes on the IBERS farm, with some sires used on both farms. All progeny born from 2006 onwards were weighed and ultrasound scanned to measure muscle depth (UMD) at 20 weeks of age.
All animals (sires, dams and lambs) born from 2006 onwards were blood sampled and blood-spotted onto FTAR cards, and these samples were used for genotyping. In addition blood samples were collected via venepuncture into EDTA-vacutainers and conserved at −40°; these samples were used if a repeated genotyping test was required. Because the causal mutation responsible for the TM-QTL is still unknown, it was necessary to use markers around the region of interest to classify the likely TM-QTL genotype for each animal. Blood samples were genotyped for five microsatellite markers on OAR18 (MCMA26, CSSM18, OY5, OY3 and OARTMR1) at the Animal Genomics Group, AgResearch Invermay, New Zealand. Marker data collected each year were used along with previously collected data to classify all animals for genotype status for TM-QTL, as described by Macfarlane et al. (Reference Macfarlane, Lambe, Bishop, Matika, Rius-Vilarrasa, McLean, Haresign, Wolf, McLaren and Bunger2009 and Reference Macfarlane, Lambe, Matika, McLean, Masri, Johnson, Wolf, Haresign, Bishop and Bunger2010). The information produced was used each year to plan matings within the flocks, in order to increase the frequency of TM-QTL whilst limiting inbreeding. Between 2005 and 2009, 33 sires were used. Of these, five were used across both sites and seen were used in three or more years. In each year, ewe lambs fit for breeding were retained within the flock and selected ram lambs identified as likely TM-QTL carriers were also retained. In total, 1731 purebred Texel lambs contributed to this dataset, comprising 759 entire male and 972 female lambs.
Lambs were grazed with the ewes at pasture as either singles (about one-third) or twins (about two-thirds) up to ultrasound scanning at 20 weeks, except for any hand-reared lambs (n=42), which were raised indoors until the age of ~8 weeks and then grazed and creep-fed up to ultrasound scanning at 20 weeks. All lambs were weighed and ultrasound scanned to measure loin muscle depth (UMD), as described below, at around 20 weeks of age (average age=138 days, minimum=119 days, maximum=151 days), before being slaughtered (average age 144 days, minimum=126, maximum=155).
Microsatellite marker genotypes, UMD and marker map information were used to run single QTL analyses using QTL Express software at http://QTL.cap.ed.ac.uk (Seaton et al., Reference Seaton, Haley, Knott, Kearsey and Visscher2002). QTL Express used a multi-marker approach to interval mapping in half sib families (Knott et al., Reference Knott, Elsen and Haley1996). The probability of a QTL affecting UMD being present was estimated at 1 cM intervals conditional on marker genotypes and recombination fraction/distance from marker. Across families, a test statistic was calculated as an F ratio for every map position obtained using the ratio of mean squares of a model fitting a QTL to not fitting a QTL. Empirical significance thresholds were estimated by using permutation tests (Churchill and Doerge, Reference Churchill and Doerge1994) involving 10 000 randomisations to estimate the 5% and 1% thresholds. Heterogeneity of QTL position was also explored by estimating the putative position of the QTL indicated by each of the main half-sib families in turn. The models fitted included a covariate of live weight at scanning and fixed effects of age of dam, rearing rank, farm, sex and year born.
2009-born animals, their management and genotypes
The population of Texel sheep described above was used to produce a total of 211 purebred Texel lambs in 2009 at SRUC and IBERS which were used for detailed phenotyping. These 211 were out of 181 Texel dams mated to seven different Texel sires that had previously been identified as carrying at least one copy of TM-QTL. Three of these sires were used on both sites. Of the lambs, 87 were out of dams that had been previously identified as carrying TM-QTL, 65 out of dams not carrying TM-QTL and the remaining 59 out of dams with unknown TM-QTL status. Lambs were either reared as a single (n=126) or a twin (n=73), or hand-reared (n=12), and were either entire male (n=96) or female (n=115). There were 73 lambs at IBERS and 138 at SRUC. Lamb management was as described above, with grazing (supplemented with creep feeding for hand reared lambs) until transportation to slaughter.
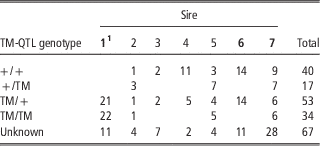
Of the 211 lambs used in this study, it was possible to unequivocally assign TM-QTL genotypes to 144: 40 non-carriers (+/+), 17 heterozygote carriers inheriting TM-QTL from the dam (+/TM), 53 heterozygote carriers inheriting TM-QTL from the sire (TM/+) and 34 homozygote carriers (TM/TM). The numbers of lambs of each known genotype from each sire used are shown in Table 1.
Distribution of TM-QTL genotype status of lambs across the seven different sires used

The sires in bold have been used on both farms.
1 Sire 1 was homozygous and sires 2 to 7 all heterozygous.
Pre-slaughter measurements on 2009-born lambs
All lambs were ultrasound scanned at ~20 weeks of age (average age=138 days, maximum=151, minimum=119) using a Dynamic Imaging Concept MLV ultrasonic scanner with a 3.5 mHz transducer at the third lumbar vertebra to measure muscle depth and fat depth. Muscle depth was measured vertically at the deepest point. Three fat depths were measured on each scan: the first above the boundary between M. longissimus lumborum and the vertebral spinous process, and the others at progressively lateral intervals of around 2 cm. This resulted in fat depths that, for most animals, spanned the longissimus muscle. These fat depths were averaged to provide a single measure of ultrasound fat depth for use in the analyses.
Lambs were CT scanned in three batches. The first batch of lambs (n=40; all from SRUC) were CT scanned with a Siemens Somatom Esprit CT scanner at the SRUC-BioSS CT Scanning Unit near Edinburgh at ~16 weeks of age (average age=112 days, maximum=118, minimum=93). Meat from these lambs was due to go for taste panel assessment (results reported by Lambe et al., Reference Lambe, Richardson, Macfarlane, Nevison, Haresign, Matika and Bunger2011) so they had to be CT scanned at least 28 days before slaughter to allow for a withdrawal period from the sedative used for CT scanning. The other two batches of lambs were CT scanned at ~20 weeks of age. The first of these two batches, the IBERS lambs (n=73), were scanned using a mobile General Electric CT scanner at IBERS (average age=131 days, maximum=141, minimum=119). The last batch, the remaining SRUC lambs (n=98), were scanned with the Siemens Somatom Esprit CT scanner (average age=136 days, maximum=145, minimum=121).
All lambs were spiral CT scanned (Navajas et al., Reference Navajas, Glasbey, McLean, Fisher, Charteris, Lambe, Bunger and Simm2006; Bunger et al., Reference Bunger, Macfarlane, Lambe, Conington, McLean, Moore, Glasbey and Simm2011). Two spiral scans were taken: one from the proximal third of the tibia to the last rib and the second from the last rib to the fourth to fifth cervical vertebra. These spiral scans were used to provide a series of ~60 cross-sectional images through the carcass, each 8 mm apart. The cross-sectional images were analysed using STAR software (Mann et al., Reference Mann, Young, Glasbey and McLean2003) to provide total carcass tissue volumes and densities (Hounsfield units) (fat, lean and bone), and tissue volumes and densities (fat, lean and bone) in the leg, saddle and shoulder regions, as well as two-dimensional (2D) and three-dimensional (3D) measurements in the loin region and the leg region. Total tissue weights in the carcass or region of interest were calculated over all images for each tissue in the image by multiplying tissue volume by the weighted mean density of the tissue: (Σ(area×density)/Σarea). For bone, because the density of bone cannot be well estimated from images analysed using STAR, a fixed value of bone density (1.55 g/cm3) was used.
The carcass was virtually split into the leg (equivalent to hind-quarter), saddle and shoulder (equivalent to fore-quarter) regions using in-house algorithms (unpublished data). 2D-CT measurements taken in the loin were depth (D), width (W) and area (A) of the M. longissimus lumborum in a cross-sectional scan taken at the fifth lumbar vertebra (Jones et al., Reference Jones, Lewis, Young and Wolf2002). Both left and right sides were measured and the average of these used in analyses. In the leg, the 2D CT measurements were width (W) and length (L) of the hind leg (HL) muscle on a cross-sectional scan taken at the ischium as described by Jones et al. (Reference Jones, Lewis, Young and Wolf2002). Measurements were made on both right (r) and left (l) legs and the average used in analyses. A 2D gigot shape score was also calculated as 10(HLWr+HLWl)/(HLLr+HLLl). Measurements taken using the 3D capabilities of the CT scanner were loin region muscle volume (LRMV), lumbar spine length (LSL), hind leg muscle volume (HLMV) and femur length (FL). These allowed calculation of a muscularity index, as described by Navajas et al. (Reference Navajas, Lambe, McLean, Glasbey, Fisher, Charteris, Bunger and Simm2007), for both the loin and hind leg regions. This index relates the weight of muscle in a region (equivalent to muscle volume because muscle density is close to 1 g/cm3) to the length of the bone in that region and thus provides a dimensionless assessment of muscularity, independent of fatness, at a constant carcass weight. The CT muscularity index for the hind leg (HLMI) was calculated as 10√(HLMV/FL3) and that for the loin region (LRMI) was calculated as 10√(LRMV/LSL3).
Post-slaughter measurements on 2009-born lambs
Mean age at slaughter was 144 days (s.d. 7.5, range 126 to 155 days) and mean hot carcass weight was 15.2 kg (s.d. 3.1, range 8 to 25 kg). Post-slaughter, carcasses were chilled for 7 to 9 days then CT scanned using spiral CT scanning. The CT scanning was similar to that performed on live animals except that thresholds suitable for meat were used (unpublished data), the analysis was simpler as there was no need to edit the images to remove non-carcass parts, and only carcass and regional tissue weights were calculated, not muscularity data. Following CT scanning of the carcasses, they were cut into fore-quarter, saddle and hind-quarter and each of these split into two along the spine. These were weighed and butchered into lean meat yield (LMY), fat trim and bone. Using these data, proportions of LMY, fat trim and bone in the carcass and in each region (fore-quarter, saddle, hind-quarter) were calculated. The proportions of total carcass weight contained in each region were also calculated. During butchery, left and right knuckle muscles were removed from the leg joints and left and right M. longissimus lumborum (lamb loin fillet or strip loin) were removed from the loin joint and these muscles weighed individually.
Statistical analyses
General linear models were run in Genstat (GenStat 11 Committee, 2008; linear mixed models, REML) to identify the effect of TM-QTL on the traits described above. The model used included TM-QTL genotype (+/+, +/TM, TM/+, TM/TM or unknown), sex (entire male or female), rearing rank (single, twin or hand-reared), farm (SRUC or IBERS) and dam age (2, 3, 4 years or older) as fixed effects, and sire as a random effect (7 levels, 3 common across farms). A covariate of age at scanning was included to adjust the analyses rams to an equal age. For all traits, including proportion traits, a covariate of live weight at measurement (for pre-slaughter traits) or carcass weight (for post-slaughter traits) was included. For proportion variables a significant relationship was observed between the proportions and live or carcass weight, and these were used as covariates where applicable.
To partition variation due to TM-QTL genotype effects, after adjusting for all other effects in the model in a GLM analysis, orthogonal contrasts were fitted for +/+, +/TM, TM/+ and TM/TM as defined by Freking et al. (Reference Freking, Keele, Beattie, Kappes, Smith, Sonstegard, Nielsen and Leymaster1998) for additive (1, 0, 0 and −1), dominance (−1, 1, 1 and −1) and reciprocal heterozygote (0, 1, −1 and 0) models of gene action. The hypothesis of a paternal polar overdominant action of TM-QTL was tested for (−1, −1, 3, −1) as well as maternal dominance (−1, 2, 0, −1), in a second set of orthogonal contrasts, alongside the additive effect (Freking et al., Reference Freking, Keele, Shackelford, Wheeler, Koohmaraie, Nielsen and Leymaster1999). The polar overdominance contrast tests whether animals inheriting the QTL from their sire, but not their dam, are significantly different from the mean of the other three genotype categories, whereas the maternal dominance contrast compares the animals inheriting the QTL from their dam, but not their sire, with the average of the two homozygote genotypes.
Results
Position of TM-QTL
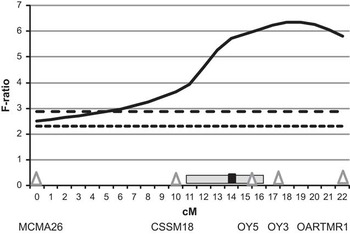
Figure 1 shows the F-ratio for the probability from QTL express of a QTL for UMD being located at each cM along the 23 cM segment of OAR18 between MCMA26 and OARTMR1, confirming the presence of a QTL affecting ultrasound muscle depth (adjusted for live weight) in this segment of OAR 18. This interval mapping approach showed that the most likely position of TM-QTL is at 19 cM from MCMA26, which is between microsatellite markers OY3 and OARTMR1. However, because relatively few markers define the region tested, no confidence interval for this position is given. There was some variation in the magnitude of the effect of TM-QTL with the effect ranging from 0.54 to 2.82 mm UMD (s.e. 0.37 to 0.57 mm) across the sires that were segregating for TM-QTL. These analyses assume an additive effect of the QTL and ignore the possibility of paternal polar overdominance.
Statistical evidence for a QTL affecting ultrasound muscle depth (shown as solid line), expressed as an F ratio, at each cM along a segment of ovine chromosome 18 between MCMA26 and OARTMR1, using an interval mapping approach. Significance thresholds are shown by horizontal lines (P=0.01 - - - -; P=0.05 ------). Also included are the position of the Callipyge mutation (■; Freking et al., Reference Freking, Murphy, Wylie, Rhodes, Keele, Leymaster, Jirtle and Smith2002) and the approximate region thought to be associated with the Carwell QTL ( ; McLaren et al., Reference McLaren, Mcewan, For, Glass, Broad, Greer and Nicoll2003).

Ultrasound muscle and fat depths and live weight at 20 weeks
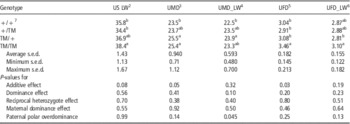
Live weight at 20 weeks was significantly higher in TM/TM animals than either +/+ (+7.3%) or +/TM animals (+11.7%), with TM/+ animals intermediate (Table 2). Ultrasound muscle depth, when corrected for live weight, was significantly higher in TM/+ than +/+ animals (+6.3%), but when not corrected for live weight, it was similar in TM/TM and TM/+ animals, with both significantly higher than +/+ animals (+8.1% and +8.4%, respectively). Ultrasound fat depth corrected for live weight was highest in TM/TM animals and lowest in TM/+ animals, with these two groups being significantly different from each other (+10.2%), but not from +/+ or +/TM animals. When not corrected for live weight, TM/TM animals had the highest fat depth. The evidence for an additive effect of TM-QTL on live weight was not quite significant (P=0.08), but there was significant evidence that the effect of TM-QTL on live weight corrected UMD showed paternal polar overdominance (P=0.05).
Least squares meansFootnote 1 for live weight at 20 weeks (US LW) and ultrasound muscle depth and fat depth, both adjusted (UMD_LW, UFD_LW) for live weight and unadjusted for live weight (UMD, UFD) for the four TM-QTL genotype groups and the P-values for the tests of different modes of action for the QTL

1 Least squares means with common letters in their superscripts, within column, are not significantly different (P>0.05), where differences were significant, P-values are shown in the numbered footnote corresponding to that trait. Average, minimum and maximum s.e.d. are shown for information.
2 US LW: TM/TM v. +/+=0.049, TM/TM v. +/TM=0.017.
3 UMD: TM/TM v. +/+=0.020, TM/TM v. +/+=0.050.
4 UMD_LW: TM/+ v. +/+=0.004.
5 UFD: TM/TM v. +/+=0.018, TM/TM v. +/TM=0.010, TM/TM v. TM/+=0.013.
6 UFD_LW: TM/+ v. TM/TM=0.025.
7 TM-QTL genetic groups: +/+ homozygous for the wild-type allele; TM/+ and +/TM heterozygote carriers of paternal and maternal origin of allele, respectively and TM/TM homozygous for the TM-QTL allele.
CT measured muscularity and dissected loin muscle weight
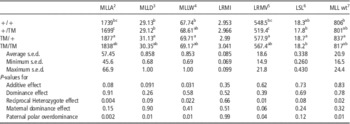
Loin muscle width, depth and area, loin muscle volume and dissected M. longissimus lumborum weight were significantly greater for TM/+ than +/+ animals (+2.9% to +7.9%), and for depth, area and muscle volume were also significantly greater for TM/+ than +/TM animals (+6.9% to +11.3%) (Table 3). Lumbar spine length was highest for TM/+, significantly higher than +/TM and TM/TM but not significantly different to +/+, but loin muscularity index was not significantly different between groups. There was significant evidence that TM-QTL had a paternal polar overdominant action on CT measured loin muscle area, depth and width and loin region muscle volume and dissected M. longissimus lumborum weight. There were no significant effects of TM-QTL on hind leg muscle dimensions or muscularity or femur length (results not shown).
Least squares meansFootnote 1 for live weight adjusted CT measured loin muscle area, depth and width (MLLA; mm2, MLLD; mm, MLLW; mm), loin muscularity index (LRMI), loin muscle volume (LRMV; cm3) and lumbar spine length (LSL; cm) and dissected loin muscle weight (MLL wt; g) for the four TM-QTL genotype groups and the P-values for the tests of different modes of action of the QTL on these traits

1 Least squares means with common letters in their superscripts, within column, are not significantly different (P>0.05), where differences were significant, P-values are shown in the numbered footnote corresponding to that trait. Average, minimum and maximum s.e.d. are shown for information.
2 MLL_A: +/+ v. TM/+=0.003, +/TM v. TM/+=0.005, +/TM v. TM/TM=0.039.
3 MLL_D: +/+ v. TM/+=0.004, +/TM v. TM/+=0.034.
4 MLL_W: +/+ v. TM/+=0.005.
5 LRMV: +/+ v. TM/+=0.049, +/TM v. TM/+=0.004, +/TM v. TM/TM=0.029.
6 LSL: TM/+ v. +/TM=0.035, TM/+ v. TM/TM=0.047.
7 MLL wt: +/+ v. TM/+=0.047.
Carcass weight and composition
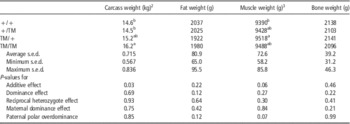
There was an additive effect of TM-QTL on carcass weight with TM/TM being significantly heavier than +/+ (+11.1%) and +/TM animals (+11.9%), with TM/+ intermediate (Table 4). Carcass fat, muscle and bone weights shown in Table 4 are those measured using carcass CT scanning and are adjusted for total carcass weight. TM/+ had higher carcass muscle weights than +/+ (+1.36%) and for this trait the test for paternal polar overdominance was close to significance (P=0.066). The carcass CT scanning results are shown here as these are believed to be the more accurate reflection of carcass composition. However, the butchery results (shown in Supplementary Table S1) are the commercially relevant ones. When measured using live animal CT, muscle weight was slightly higher in TM/TM than +/+ animals (+2.8%, P=0.047). When measured using butchery, weight of lean meat yield was also slightly higher in TM/TM than +/TM animals (+3.0%, P=0.045). There were no significant effects on CT predicted fat or bone weights in either live animals or carcasses. The butchery results (Supplementary Table S1) showed no effect on bone weight, but weight of fat trimmed from the carcass cuts was significantly lower for TM/+ than +/+ animals (−11.2%; P=0.036).
Least squares meansFootnote 1 for cold carcass weight (kg) and carcass fat, muscle and bone weights (all adjusted for carcass weight) measured using post-slaughter carcass CT scanning for the four TM-QTL genotype groups and the P-values for the tests of different modes of action for the QTL on these traits

1 Least squares means with common letters in their superscripts, within column, are not significantly different (P>0.05), where differences were significant, P-values are shown in the numbered footnote corresponding to that trait. Average, minimum and maximum s.e.d. are shown for information.
2 Carcass weight: TM/TM v. +/+ P=0.021, TM/TM v. +/TM P=0.040.
3 Muscle weight: TM/+ v. +/+ P=0.029.
Weight and composition of joints
Weights of the leg, saddle and shoulder region and proportion of carcass weight contained in each of these regions did not differ significantly between genotypic groups (data in Supplementary Table S2). For the carcass CT scanning data, composition of leg, saddle and shoulder regions showed significant differences between genotypic groups for 4 traits (data in Supplementary Table S3). The leg region had significantly less fat in TM/+ than +/+ lambs (27g; −5.1%; P=0.04) and +/TM had significantly less muscle than the other genotypic groups (130 to 144 g; ~3%; P<0.03). For the saddle region, TM/+ animals were less fat than +/TM animals (84 g; −13.5%; P=0.049), and +/+ had significantly less muscle than either +/TM (136 g; −7.16%; P=0.009) or TM/+ (86 g; −4.53%; P=0.016). For the live CT scanning data, there were no significant differences between genotypic groups for composition of the leg, saddle or shoulder regions (data not shown). In the butchery data (Supplementary Table S4), +/TM animals had significantly less LMY in the leg region than both TM/+ (77 g; −5.70%; P=0.019) or TM/TM animals (78 g; −5.77%; P=0.026). TM/TM had significantly less bone in the leg region than the other three groups (−3.24% to −3.99%; P=0.008 to 0.028), although in real terms this was a difference of only 22.6 to 28.1 g. A significant negative maternal dominance effect was found for LMY in the leg and a significant dominance effect was observed for bone weight in the leg.
Discussion
The work reported here comprises results arising from a comprehensive experiment to evaluate the effect of TM-QTL on carcass traits in purebred Texel lambs. TM-QTL was first reported by Walling et al. (Reference Walling, Visscher, Wilson, McTeir, Simm and Bishop2004) on OAR18, located between microsatellite markers MCMA26 and OARTMR1, and the current study has confirmed the presence of TM-QTL on this segment of OAR18. Using the microsatellite markers available to us at the time, it would have been difficult to more accurately position the TM-QTL. There is a possibility that other QTL in this region of OAR18, such as the Carwell QTL, are allelic to TM-QTL. Further work to fine-map this region would be required to more accurately position TM-QTL and, ultimately, determine whether the other QTL lying in this region are different from or allelic to TM-QTL.
TM-QTL affects loin muscling in Texel sheep. The initial study by Walling et al. Reference Walling, Visscher, Wilson, McTeir, Simm and Bishop2004 showed an effect of +4% to +7% on ultrasound muscle depth, and in a larger population in a follow-on study Matika et al. (Reference Matika, Sechi, Pong-Wong, Houston, Clop, Wooliams and Bishop2011) showed an effect of +8% to +17% in 6 out of 36 Texel families. This effect was confirmed in Texel sired crossbred lambs out of Mule ewes (Macfarlane et al., Reference Macfarlane, Lambe, Bishop, Matika, Rius-Vilarrasa, McLean, Haresign, Wolf, McLaren and Bunger2009) and also out of Welsh Mountain ewes (Masri et al., Reference Masri, Macfarlane, Lambe, Haresign, Brotherstone and Bunger2011). Macfarlane et al. (Reference Macfarlane, Lambe, Bishop, Matika, Rius-Vilarrasa, McLean, Haresign, Wolf, McLaren and Bunger2009) also noted that loin muscle (M. longissimus lumborum) width, area, volume and weight were also higher in lambs inheriting TM-QTL from their sire.
These earlier studies all used heterozygote carriers of TM-QTL where TM-QTL was inherited from the sire. Based on the maternal and paternal variance components for muscle depth in their data Matika et al. (Reference Matika, Sechi, Pong-Wong, Houston, Clop, Wooliams and Bishop2011) hypothesised that the TM-QTL is characterised by a paternal polar overdominant pattern of expression, although the structure of their study could not provide direct evidence of this form of imprinting. The present study reports, for the first time, the effect of the inheritance of TM-QTL from the dam, either alone or together with TM-QTL from the sire and provides supporting evidence for a polar overdominant pattern of expression for the TM-QTL’s effect on loin muscling (ultrasound muscle depth, CT muscle depth, width, area and volume and dissected weight). This mode of inheritance will have an important impact on optimal utilisation of the TM-QTL within the sheep industry, since the TM-QTL phenotype is only expressed in carriers of a single copy of TM-QTL inherited from the sire. Imprinting tends to affect a region of a chromosome and it is therefore not unexpected that TM-QTL would be imprinted, given its position within the same region as both Carwell (Nicoll, Reference Nicoll2007) and Callipyge (Cockett et al., Reference Cockett, Jackson, Shay, Nielsen, Moore, Steel, Barendse, Green and Georges1994a; Charlier et al., Reference Charlier, Segers, Wagenaar, Karim, Berghams, Jaillon, Shay, Weissenbach, Cockett, Gyapay and Georges2001a; Freking et al., Reference Freking, Murphy, Wylie, Rhodes, Keele, Leymaster, Jirtle and Smith2002) and the cluster of imprinted genes around Callipyge (Charlier et al., Reference Charlier, Segers, Wagenaar, Karim, Berghmans, Jaillon, Shay, Weissenbach, Cockett, Gyapay and Georges2001b; Cockett et al., Reference Cockett, Jackson, Shay, Farnir, Berghmans, Snowder, Nielsen and Georges1996b).
The results of Macfarlane et al. (Reference Macfarlane, Lambe, Haresign and Bunger2012), showing an apparent additive effect of TM-QTL on live and carcass weights, were replicated here. Of further interest was the effect TM-QTL had on carcass and joint composition. In previous work looking at the effect of a single copy of TM-QTL in crossbred Texel-sired lambs, there did not appear be an effect on other carcass traits (out of Mule ewes, Macfarlane et al., Reference Macfarlane, Lambe, Bishop, Matika, Rius-Vilarrasa, McLean, Haresign, Wolf, McLaren and Bunger2009; out of Welsh Mountain ewes, Masri et al., Reference Masri, Macfarlane, Lambe, Haresign, Brotherstone and Bunger2011). In the present study, lambs inheriting TM-QTL from their sire (either homozygote or heterozygote carriers), tended to be less fat than wild-type homozygotes and this translated to a commercially relevant significant difference in weight of fat trimmed from the carcass during butchery (−11%) between homozygote wild-types and heterozygotes inheriting TM-QTL from the sire. Furthermore, although the differences were small and not always significant, muscle weight and lean meat yield tended to be higher in lambs inheriting TM-QTL from their sire (either homozygote or heterozygote carriers) than in wild-type homozygotes or lambs inheriting TM-QTL from their dam. This indicates that animals inheriting TM-QTL from their sires are likely to produce carcasses with slightly greater lean meat yield and require less work for fat trimming during butchery, in addition to the greater weight of the high value loin muscle. There did not appear to be any unfavourable effects of TM-QTL on carcass traits and Lambe et al. (Reference Lambe, Richardson, Macfarlane, Nevison, Haresign, Matika and Bunger2011) has shown that there are no significant effects of TM-QTL on meat quality when meat was conditioned for a period of 7 to 9 days.
In summary, the direct effects of TM-QTL on loin muscling (4% to 11% increase in highly priced part of the carcass) and growth make it an interesting candidate for exploitation within the UK sheep industry and beyond, especially since it does not have any major negative impacts on eating quality. However, there are two main aspects to consider before commercial exploitation is feasible: (i) a commercial genotyping test and (ii) a usage plan.
Commercial genotyping test
Exploitation of this QTL will require development of a suitable and affordable DNA test to identify carrier animals, as usage of microsatellite marker panels with family-specific linkage phases is not feasible in practice. This will necessitate further research to fine map and identify closely linked markers or even the specific mutation(s) involved, so that a commercial single nucleotide polymorphisms (SNP) test can be developed. However, in the case of Parent-of-origin (PofO) effects, such as polar overdominance, the homologous chromosomes exhibit differential gene expression and conventional association studies generally ignore such inheritance patterns, considering maternal and paternal alleles to be equivalent (e.g. Garg et al., Reference Garg, Borel and Sharp2012). The problems caused by PofO on genome-wide association (GWA) analyses has been discussed in detail by Rowe et al. (Reference Rowe, Bishop and Koning2012) and it is obvious that this remains challenging, as the recent standard approach for fine mapping using dense SNPs may not work well. Typically, GWA studies regress the phenotype on the number of (minor) alleles present at the locus, however, with polar overdominance and an allele frequency approaching 0.5, the regression of a trait showing polar overdominance on allele count will be close to zero (see Rowe et al., Reference Rowe, Bishop and Koning2012). Hence standard GWA analyses miss the effect. To overcome this problem, one would need phased haplotypes, that is knowledge of the PofO, and specifically fit phased-haplotype-derived genotype class in the analysis, as suggested earlier (Rowe et al., Reference Rowe, Bishop and Koning2012).
Utilisation
Optimal usage in a purebred situation is different from that in a crossbred and it is important to consider if the aim is to exploit the muscling effects or the growth effects of TM-QTL. In a purebred scenario, in terms of muscling, one wants to take the QTL to a frequency of ca. 0.5 (although for live weight it should go higher). But for maximum benefit in crossbred progeny (assuming that the dam breed does not carry the QTL) one simply wants all sires to be homozygous, so that their progeny benefit in terms of both live weight and muscling effects. This implies that for the optimum utilisation strategy for the muscling effects in crossbred lambs, the performance in the purebred population is not at its optimum. In contrast to the muscling effects, the growth effects of TM-QTL seem to show an additive effect, with animals inheriting two copies of TM-QTL showing an increase of 1.5 kg or 9% in carcass weight when slaughtered at a fixed age, and an increase in live weight across a range of ages from birth to slaughter (+4% to +15%), compared with wild type animals (Macfarlane et al., Reference Macfarlane, Lambe, Haresign and Bunger2012). Such differences have implications for exploitation within the stratified industry structure typical of the United Kingdom. To benefit fully from the effects on growth and carcass weight, the TM-QTL will need to be introgressed into the dam line as well as fixed within terminal sires; however this will lose the benefits for muscling. Exploitation of the effects on loin muscling will require TM-QTL to be absent in the dam line and fixed in a homozygous state within terminal sire breeds to derive maximum commercial benefit.
Acknowledgements
The authors are grateful for the technical contributions of SRUC (formerly SAC) colleagues: Laura Nicoll, Claire Anderson and Amer Masri. Thanks are also extended to colleagues at AgResearch, New Zealand for their work on marker genotyping. They wish to thank our industry sponsors and project partners: EBLEX, HCC, QMS, LMCNI, Catapult Genetics, Innovis Genetics Ltd, Welsh Country Foods, EplusV/Germany, ASDA stores, SAMW, Suffolk Sire Referencing Scheme Ltd, British Texel Sheep Society Ltd and Charollais Sire Reference Scheme. Financial support of BBSRC (project no. BB/E018963/1) and Defra for this research through the LINK Sustainable Livestock Production programme (project no. LK0670) is gratefully acknowledged. SRUC receives financial support from the Scottish Government Rural and Environment Research and Analysis Directorate (RERAD).