1. INTRODUCTION
Spatial assistance systems aim to transfer the cognitive stress involved in an analytical activity onto a system, by externalizing and operationalizing the decision-making processes involved therein. In essence, spatial assistance systems (SAS; Bhatt et al., Reference Bhatt, Schultz, Freksa, Tenbrink, Wiener and Claramunt2012) are computational manifestations of the spatial decision-making capabilities of individuals who are experts in a particular area of interest. Given the scope of this paper, which is focused on computational systems requiring indoor spatial awareness capabilities, some examples of systems include decision-support tools that require support toward (assistive) spatial computing (Bhatt & Freksa, Reference Bhatt and Freksa2010; Bhatt et al., Reference Bhatt, Schultz, Freksa, Tenbrink, Wiener and Claramunt2012):
• architectural design assistance
• real-time emergency assistance
• indoor navigation assistance
• ambient assisted living
The range of assistance capabilities that may be operationalized over quantitative descriptions of real (i.e., already existing) or hypothetical (i.e., being designed) indoor spatial environments is rather exhaustive, if not infinite. Central to these categories of systems is a common foundational basis consisting of representational modalities and computational capabilities (Bhatt et al., Reference Bhatt, Schultz, Freksa, Tenbrink, Wiener and Claramunt2012):
• the representational viewpoint gives central significance to modalities for semantic modeling, multiperpective representations, and qualitative spatial abstractions;
• the computational viewpoint (being closely connected to the representational modalities) defines the essential character and nature of the analytical and assistive capabilities, by focusing on computational techniques for conceptual and qualitative spatial reasoning.
Distinct categories of spatial assistance systems do exist, as well as inherent differences between descriptions of indoor spatial environments and those of open environmental spaces. However, the fundamental capabilities for computing for indoor spatial awareness in the context of a structured spatial environment (SSE) and the information requirements for the range of assistance systems bear close relationships and similarities (Bhatt & Freksa, Reference Bhatt and Freksa2010; Bhatt et al., Reference Bhatt, Schultz, Freksa, Tenbrink, Wiener and Claramunt2012). For the case of indoor or built-up environments, and for spatial assistance scenarios such as those aforementioned, it may be presumed that geometric models of the environment under consideration are available, for example, by way of accurate building and floorplans [computer-aided architectural design (CAAD), design assistance], graph-based models (way-finding assistance), and computational fluid dynamics-based finite-element models (for structural analysis, cost estimation, phenomenal studies to simulate fire spread). These models may pertain to real spatial environments that have been built (e.g., a museum), or they may pertain to an arbitrary environment that is undergoing initial conceptualization, prototyping, and design. Spatial computing (for spatial awareness), however, defined from cognitive, ontological, and computational viewpoints, does not differentiate between real and hypothetical environments. That is, different types of analytical capabilities that may be deemed to be within the purview of a particular interpretation of spatial awareness have to be based on high-level quantitative and qualitative perspectives that are grounded to a geometric model of the concerned environment. Furthermore, it is desired that these models of SSEs be grounded to industrial data representation standards designed for community-wide tool compliance and interoperability.
This paper presents a multimodal semantic spatial data access framework for the specialized domain of indoor spatial environments. The framework provides conceptual and qualitative spatial abstraction capabilities over geometric spatial data pertaining to indoor environments, and is suited to a wide range of spatial assistance systems. Of specific interest to the application aims of our work is conformance with industrial standards for the representation of built-up spaces. In this context, we ensure interoperability with commercial tools concerned with the creation, manipulation, and management of environmental data by utilizing the stipulations of the building information model (BIM; Eastman et al., Reference Eastman, Teicholz, Sacks and Liston2008) and the industry foundation classes (IFC; Froese et al., Reference Froese, Fischer, Grobler, Ritzenthaler, Yu, Sutherland, Staub, Akinci, Akbas, Koo, Barron and Kunz1999). Except where pointed out, all working examples used in this paper are based on the Museum Calouste Gulbenkian, an art gallery in Lisbon, Portugal (Tostoes et al., Reference Tostoes, Carapinha and Corte-Real2006).
1.1. Organization of paper
Section 2 presents the overall paradigm of spatial computing for architectural design assistance. This is done in the context of a motivating scenario related to the design of museums, which is further built up in the rest of the paper. The discussion in this section is grounded with respect to our work in progress architectural design assistance system DSim. Section 3 elaborates on the multimodal spatial data access framework by formalizing the principal modalities as applicable to the interpretation of structural form in this paper. Section 4 builds on the motivating scenario of Section 2 by presenting a case study on the application of the principal modalities introduced in Section 3. The emphasis in this section is on illustrating the use of the available modalities within independent, specialized reasoning components concerned with providing intelligent analytical capabilities. Section 5 provides the technical details relevant to interoperability and industrial relevance of the multimodal spatial data access framework, and implicitly, of our overall approach to providing intelligent assistance in architectural design. Here, we provide the technical details of deriving the modal perspectives in the context of the IFC. In Section 6, we conclude with a pointer to the ongoing and future outlook of our work.
2. SPATIAL COMPUTING FOR ARCHITECTURAL DESIGN ASSISTANCE
Spatial computing for assistance systems involves an interplay between information–theoretic computational models of spatial data and the conceptual and cognitive perspectives of users of assistance systems (Bhatt & Freksa, Reference Bhatt and Freksa2010). Given the scope of this paper, consider the case of architectural design assistance systems. A crucial element that is missing in conventional architectural design systems pertains to formal modeling, that is, representation and reasoning over “architectural structures.” Formal modeling of the structural form of an environment, and commonsensical reasoning about the differing functional capabilities that it affords or leads to, is necessary to ensure that design time objectives are met when the design is deployed in reality. In other words, as all architectural design tasks are concerned with a spatial environment, formal representation and reasoning along conceptual and spatial dimensions is essential to ensure that the designed model satisfies key requirements that enable and facilitate its intended function.
2.1. A museum design task
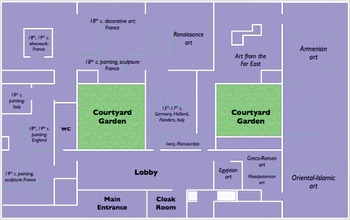
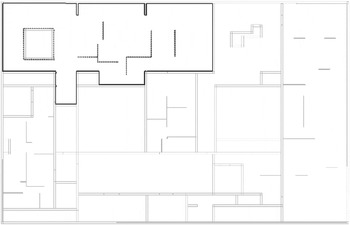
As a use-case that is further developed in the rest of the paper, imagine the task of initial conception and design of a museum; we use the design of Museu Calouste Gulbenkian in Lisbon, Portugal (Fig. 1) as a case study in this paper. A museum is an instance of an SSE that not only has a desired form and function but is also constructed keeping in mind predetermined aesthetic, cultural, psychological, and other subjective parameters.
The floorplan of the Museu Calouste Gulbenkian in Portugal (Tostoes et al., Reference Tostoes, Carapinha and Corte-Real2006). [A color version of this figure can be viewed online at http://journals.cambridge.org/aie]

Environmental feature descriptions in such a design context refer to abstract, high-level spatial design patterns that correspond to specific structures at a quantitative level. For instance, early design and conceptualization involves high-level feature descriptions of the structural form of the environment. More specifically, spatial features such as continuity, spaciousness, symmetry, modular repetition, elevation, relative positioning of entities, and visibility relationships may be easily identified. Contemporary professional design tools, and the precise quantitative modeling paradigm that they are based on, are inherently incapable of exploiting the correspondence between high-level descriptions of spatial concepts and features. Such tools simply lack the ability to exploit the expertise that a designer is equipped with, as the designers are unable to explicitly communicate their intentions to the design tool in a manner consistent with an inherent human-centered conceptualization, that is, semantically and qualitatively (Bhatt & Freksa, Reference Bhatt and Freksa2010). At a broad level, Bhatt and Freksa define spatial computing for architecture design assistance systems as the capability to represent and reason about models of SSEs at varying levels of abstraction, different stages of design and development, and dissimilar perspectives of representation ranging across conceptual, qualitative, and quantitative dimensions. Consider the following abstract notion of the structural form of an environmentFootnote 1:
The structural form of an environment is an abstraction mechanism generally corresponding to the layout, shape, relative arrangement and configuration of spatial entities, artifacts, and anything else—abstract or real—that may be geometrically modeled, interpreted, or derived within a system. For instance, the structural form may be minimally interpreted as a constraint network that determines the relative spatial relationships between the real and artifactual entities contained within a design.
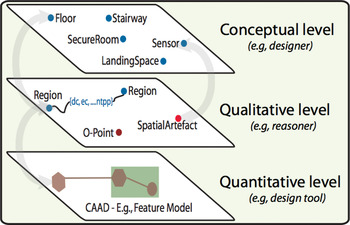
Within this interpretation of structural form, an abstraction such as a Room or ArchitecturalEntity may be identified semantically by its placement within an ontological hierarchy and its relationships with other conceptual categories. This is what a designer must deal with during the initial design conceptualization phase. However, when these notions are transferred to a CAAD tool, the same concepts acquire a new perspective, that is, now the designer must deal with points, line segments, polygons, and other geometric primitives available within the feature hierarchy of the design tool, which, albeit necessary, are in conflict with the mental image and qualitative conceptualization of the designer. For instance, a Floor at the conceptual level is abstracted as a Region at the qualitative level of a reasoner and as a ClosedPolygon, thereby preserving the geometry at the quantitative level of a CAAD-based feature model (Fig. 2). Multiperspective semantics and multimodal data access are needed for a knowledge-based system to make inferences about the conceptual design and its geometric interpretation within a CAAD model in a unified manner. Our interpretation of spatial computing encompasses the following key aspects:
• semantic modeling, spatial abstraction, and multiperspective representation;
• design analysis by inference patterns supporting diagnostic and hypothetical reasoning; and
• assistive feedback and communication with designers.
Multiperspective semantics. Reprinted from “Spatial Computing for Design: An Artificial Intelligence Perspective,” by M. Bhatt and C. Freksa, Reference Bhatt and Freksa2010, Proc. NSF Int. Workshop on Studying Visual and Spatial Reasoning for Design Creativity (SDC'10). Copyright 2010 by NSF. Reprinted with permission. [A color version of this figure can be viewed online at http://journals.cambridge.org/aie]

The aspects deemed essential correspond to problems that accrue within a conventional “iterative refinement by automated design assistance” workflow, and are identifiable with respect to the modeling–evaluation–redesign phases in intelligent design assistance, for instance, as interpreted within a function–behavior–structure (Gero, Reference Gero1990; Gero et al., Reference Gero, Tham and Lee1991) model of the design process. With respect to the refinement workflow, the basic research questions within the context of spatial computing include the following:
1. semantics: formal modeling of design requirements, and the role of knowledge engineering in that regard
2. spatial abstraction: abstraction of CAD-based geometric information into the qualitative domain via the use of formal spatial representation and reasoning techniques
3. qualitative spatial reasoning (QSR): the application of spatial consistency as a basis for checking for design requirement consistency
4. hypothetical reasoning: the role of hypothetical reasoning (e.g., by abduction) as a means to support a diagnostic and recommendation function within a logic context
5. assistive feedback: visualization modalities as a means to interact and communicate assistive feedback with the designer
Within spatial computing for design, the use of formal qualitative spatial calculi and conceptual design requirements serve as a link between the structural form of a design and the differing functional capabilities that it affords or leads to. Therefore, a very important goal in spatial computing is to formally investigate this link between structural forms, denoted by specific spatial configurations of domain entities, and the behaviors and functions that such structural forms are inherently capable of producing. In this paper we are primarily interested in functionally capabilities with respect to a prespecified set of requirements conceptually expressed by an architect or a designer. Our main aim is to illustrate the representational and computational modalities that mediate the high-level specification of design requirements, and their low-level precise interpretation within an industry-scale CAAD framework.
3. MULTIMODAL SPATIAL DATA ACCESS
Our proposed framework focuses on multimodal spatial data access capabilities that provide a range of data access modalities including multiperspective semantics, qualitative abstractions, and artifactual querying, among others. The emphasis is on providing high-level, multimodal spatial data access in an industry complaint and interoperable manner.
Tasks that are performed by spatial assistance systems are fundamentally reasoning and querying services. When modeling an instance of a world in some domain, the user provides premise information about an environment and the SAS uses this to derive and infer qualitative relation information. The user can then query the model for the purposes of information retrieval and to determine whether particular qualitative conditions are satisfied. Consider the following examples:
• Given this geometric CAAD layout of a museum with a lighting installation, what are the expected subjective impressions that occupants will experience as they enter the main gallery from the lobby?
• What is the expected route that crowds will take as they move through the museum?
• Are there any locations in the building where people–traffic congestion is expected to be very high?
This approach of incorporating multiperspective semantics in spatial assistance systems can be achieved by employing qualitative relations to model and reason about indoor environments. This information must be maintained by the SAS (typically as qualitative constraint networks) in order to make it available for processing user queries. However, a central problem is that it is not practical to explicitly maintain all deducible qualitative information, as the size of the constraint network quickly becomes intractable as the number of objects in the environment increases; this is a particular problem for the architectural design domain, as even simple floor plans typically specify hundreds of objects.
QSR is an established field of research investigating qualitative representations of space that abstract from the quantitative details of the physical world together with reasoning techniques that allow predictions about spatial relations, when precise quantitative information is not desired or available (Cohn & Hazarika, Reference Cohn and Hazarika2001). A qualitative description is one that captures cognitively meaningful distinctions, and ignores others. QSR includes investigations of human understanding of space, qualitative representations of different spatial aspects (e.g., orientation, topology, size), and mathematical properties of operations for manipulating and combining the represented knowledge. Relational formalizations of space and tools for efficiently reasoning with them are now well established (Renz & Nebel, Reference Renz, Nebel, Aiello, Pratt-Harmann and Benthem2007). Specifically, spatial information representation corresponds to the use of formal spatial calculi such as (Fig. 3):
• region connection calculus (RCC; Randell et al., Reference Randell, Cui and Cohn1992): defines qualitative relationships between regions such as disconnected, externally connected, and partially overlapping (Fig. 3a)
• single-cross and double-cross calculi (Freksa, Reference Freksa1992): corresponds to a calculus of ternary orientation relations with an extrinsic frame of perceptual reference involving an observer, a reference object, and a target object (Fig. 3b)
• oriented point relation algebra (Moratz, Reference Moratz2006): a useful binary orientation calculus for representing relative positional information about intrinsically oriented objects (Fig. 3c)
The topological and orientation calculi. [A color version of this figure can be viewed online at http://journals.cambridge.org/aie]

Essentially, QSR investigates abstraction mechanisms and the technical computational apparatus for representing and reasoning about space within a formal, nonmetrical framework (Freksa, Reference Freksa, Mark and Frank1991; Cohn & Renz, Reference Cohn, Renz, van Harmelen, Lifschitz and Porter2007). In this paper, we use the relational system from formal qualitative spatial calculi, in particular topological calculi, as an abstraction mechanism; this abstract view is formalized in Definitions 1 and 2, and used as a formal foundation in the other definitions to follow. Complete details on the role of formal spatial calculi and the nature of formal spatial modeling and computing within a broad range of spatial assistance systems is available in Bhatt et al. (Reference Bhatt, Schultz, Freksa, Tenbrink, Wiener and Claramunt2012).
Formally, let ℛ be a set of relation symbols, where each r ∈ ℛ represents a qualitative relation. For example, ℛRCC = {DC, EC, PO, TPP, NTPP, TPP−1, NTPP−1, EQ}. This defines the language that the user can employ to model and reason about situations in their specific application domain such as architectural design.
Definition 1 (binary qualitative constraint networks)
A binary qualitative constraint network G = (V, f) consists of a set of nodes V and a function f : V × V → 2R that assigns a subset of relations to an orderedFootnote 2 pair of nodes.■
SASs typically employ qualitative relations of arbitrary arity, including unary relations (e.g., expressing that a room is spacious), ternary relations (e.g., expressing that a cabinet obstructs light emitted by a lamp from striking a wall), and so on. A relation of arity i is denoted r i and the subset of relations in R that have arity i is R i.
Definition 2 (qualitative constraint networks of arbitrary arity)
A qualitative constraint network of mixed arity relations (up to n-ary relations) G′ = (V, f 0, f 1, … , f n) consists of a set of nodes V and a set of functions f i : V i → 2R i for each i ∈ 0, … , n}.■
Most QSR calculi come with (sometimes implicit) domains of interpretation (Ligozat et al., Reference Ligozat, Mitra and Condotta2004), for example, a constraint network using RCC relations can be interpreted as constraints between nonempty closed regular subsets of a topological space. A network is consistent if, for each relation R(x, y) on the edge between nodes x and y, there is some consistent instantiation of all nodes V, in the domain of interpretation, that also satisfies ℛ.
If a building design has |V| objects (i.e., the size of the set of constraint network nodes) then the maximum number of edges in the binary constraint network is |V|2 where each edge is annotated with a subset of 2R 2 qualitative relations. In general, the maximum number of edges in a qualitative constraint network of mixed arity relations is a univariate polynomial of degree n,

Thus, the size of the complete constraint network used to maintain qualitative information has a polynomial growth rate (approximated as the arity of the highest arity relation) with respect to the number of objects.Footnote 3 Given that simple floor plans typically contain hundreds of objects, explicitly maintaining a complete qualitative constraint network is clearly not practical. Moreover, the vast majority of edges in the constraint network are irrelevant for most queries that users will specify and thus do not need to be explicitly maintained. Thus, the aim is to determine which edges should be maintained explicitly by identifying those n-tuples of objects for which the n-ary relation is likely to be involved in a large number of user queries.Footnote 4 This approach of selecting and maintaining certain subsets of the complete constraint network is formalized as salient multimodal indoor space models. For the purposes of this paper, this notion of multimodal indoor space models is used to interpret the concept of structural forms.
Indoor space models are qualitative constraint networks that are (noninduced) subgraphs of the complete qualitative constraint network. To define indoor space models it is necessary to specify a selection predicate p i such that an edge between an i-ary tuple of objects (x 1, . . . , x i) is included in the indoor space model network only if the objects satisfy the selection predicate, that is, an edge between objects in the i-ary tuple (x 1, . . . , x i) exists in the indoor space model network when pi(x 1, . . . , x i) is true. Indoor space models also specify how the edges should be annotated; rather than enumerating every qualitative relation that exists between the objects involved, indoor space models specify some subset of the relations R′ ⊆ R that should be used to annotate the edge.
Definition 3 (indoor space model)
Let indoor space model α be a constraint network G α = (p i, R′, V, f i), where p i is a selection predicate of arity i, R′ ⊆ R is a set of relation symbols used for annotating the edges of the indoor space model network, V is a set of nodes, and f i: {(x 1, … , x i) ∈V i |p i(x 1, … , x i)} → 2R′ is a function where f(x 1, … , x i) = {r ∈ R′|r(x 1, … , x i)}.■
That is, the function f annotates an edge in the indoor space model network with qualitative relations between objects (x 1, … , x i) if p i(x 1, … , x i) is true (otherwise no edge exists for the given tuple of objects). The output of the function is a subset of relevant relations R′ according to the indoor space model. The following subsections present a range of indoor space models that collectively determine the qualitative information access capabilities that are supported by this SAS framework.
3.1. Hierarchical models
The data access framework provides a hierarchical and multidomain model of space that is suited to solving representation and reasoning problems that arise within the context of spatial assistance systems. From the viewpoint of hierarchical conceptualization, the aim of this work is to develop an organization of qualitative spatial information that splits the related entities into independent subsets and allows for solving spatial reasoning tasks at an adequate level of granularity. The resulting hierarchical representation should support the same reasoning and design tasks that would be possible with a flat qualitative representation but do so in a more efficient and intuitive way. Figure 4 illustrates the hierarchical model of the Gulbenkian floorplan.
Definition 4 (hierarchical model graph)
A hierarchical model graph (G HM) = (contains, Ø, V, f) is an indoor space model with a selection predicate contains ∈ R 2 and unannotated edges.■
A hierarchical model of the Gulbenkian museum floorplan. [A color version of this figure can be viewed online at http://journals.cambridge.org/aie]

A straightforward interpretation of contains is the subset relation between geometric regions: if the polygon (or arbitrary geometric shape) describing region b is completely inside the polygon describing region a then contains(a, b). As researchers from the QSR community have observed (Cohn et al., Reference Cohn, Bennett, Gooday and Gotts1997), this method can break down due to the semantics of the regions, and whether regions can consist of holes. For example, the notion of surrounds as in “The clearing is surrounded by the forest” may be required to instead be interpreted as contains; in this case the convex hull of the forest region can be used to determine the containment relation. Alternatively, the appropriate containment relation may already be encoded in the building model data, for example, IFC maintains two relevant relations between spaces and objects: IfcRelAggregates and IfcRelContainedInSpatialStructure.
3.2. Qualitatively annotated visibility graphs (QvGraphs)
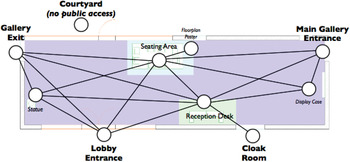
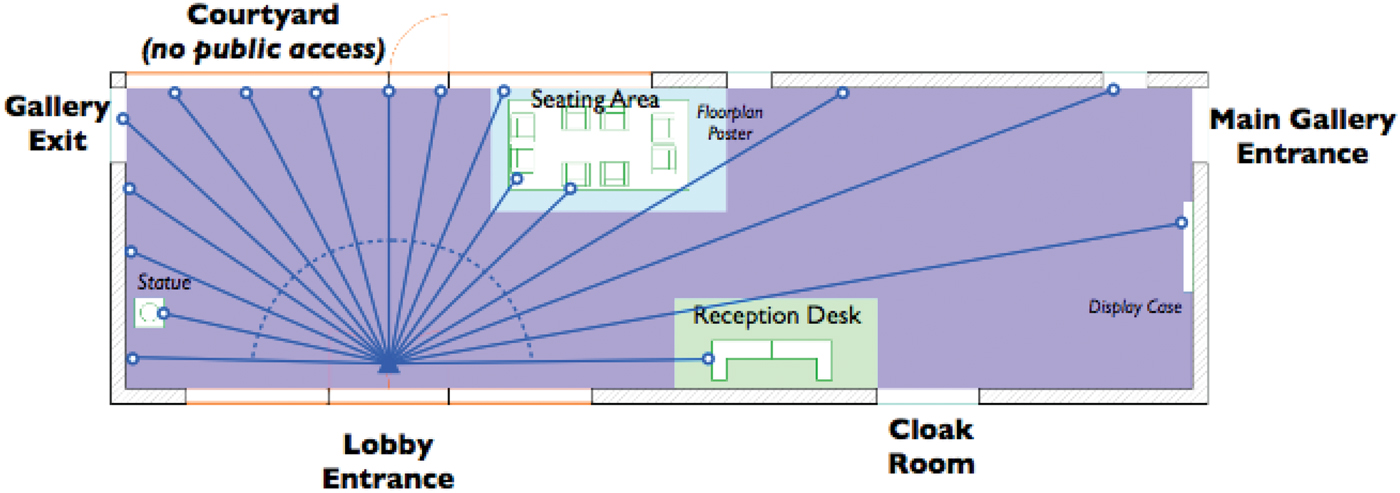
We propose QvGraphs as an extension to the concept of a visibility graph (Lozano-Pérez & Wesley, Reference Lozano-Pérez and Wesley1979; de Berg et al. Reference de Berg, van Kreveld, Overmars and Schwarzkopf2000). In computational geometry, a visibility graph of a polygonal scene shows the intervisibility relations between a set of points (indicating locations, obstacles, etc.) in a scene, as geometrically constituted within the Euclidean plane. Specifically, visibility graph nodes correspond to point locations and edges represent a visible connection between them. QvGraphs extend visibility graphs by deriving and annotating the visibility link with (potentially disjunctive) knowledge about spatial relationships pertaining to one or more spatial domains such as topology, orientation, and distance. Figure 5 illustrates an example of a visibility graph of a museum lobby. The direction of the edges indicates the direction of the binary qualitative relations; for example, the ReceptionDesk is right_of the LobbyEntrance, indicated by the direction of the edge in the QvGraph, although the visible relation in this example is symmetric.
Partially annotated QvGraph of the Museu Gulbenkian lobby. The user has specified that orientation and topological relations are relevant for this QvGraph (the qualitative annotations on the dashed edges have been omitted for clarity). [A color version of this figure can be viewed online at http://journals.cambridge.org/aie]

Each node in a QvGraph represents an object in the modeled environment. A directed edge exists from node x to node y if and only if visible(x, y), that is, y is visible from the object (or the location of the object) x. The semantics of the predicate visible determines the semantics of the QvGraph; in particular, visibility is a very general notion that corresponds to a spatial artifact known as the range space of objects. Visibility can be interpreted in the traditional way, such as “A person located at position x can see object y”: however, visibility can also be interpreted from the perspective of sensors, for example, “Sensor x can detect an object moving at location y” or objects that project light, for example, “Light source x directly illuminates sculpture y.”
Definition 5 (QvGraph)
A QvGraph (G Qv) = (visible, R′2, V, f) is an indoor space model with a selection predicate visible ∈ R 2 and edges annotated with binary qualitative relations (determined by the user of the QvGraph).■
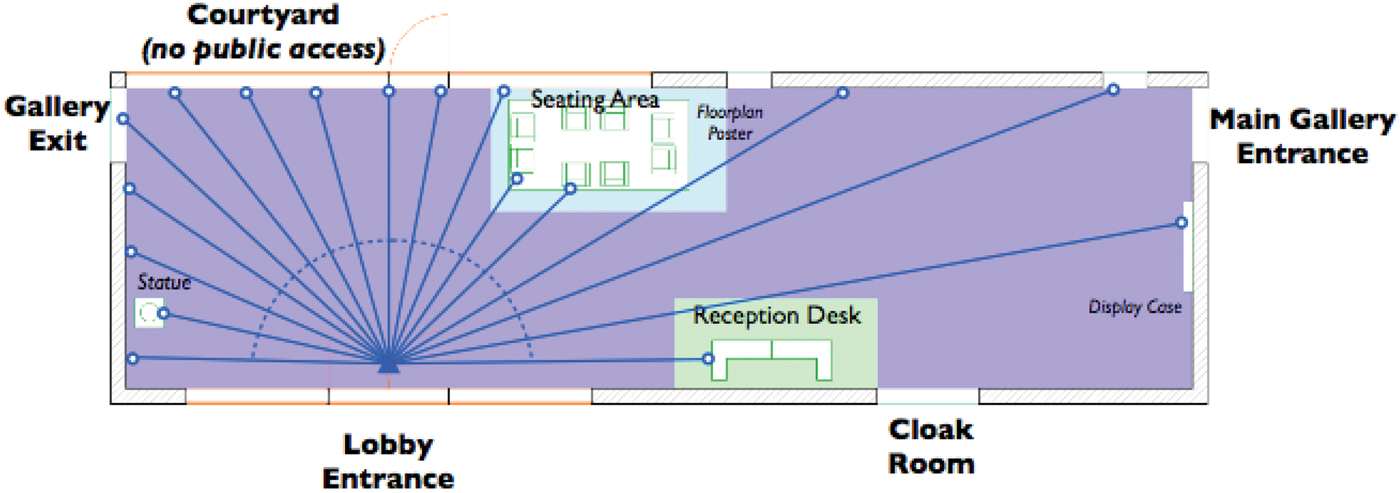
A number of different approaches can be used for calculating the visible relation. As illustrated in Figure 6 the following three arguments are required: a point location, a reference direction, and an angular field of view. Angles are taken counterclockwise from horizontal [e.g., 0° is equivalent to the direction vector (1, 0)]. An optional argument is a visible distance limit d (i.e., the distance from the viewer to the farthest possible visible object). One approach for calculating visible is ray tracing, which performs a sweep across the field of view while projecting regularly distributed rays and recording the first objects that the rays encounter. The steps for computing a rudimentary ray trace are as follows. Given ray count k + 1, for each ray i = 0, … , k,
1. create a line segment of length d, starting from the viewer's point location, in the direction dir – (FOV/2) + i × (FOV/k).
2. for each object in the environment that intersects the line segment, calculate the points of intersection; keep track of the object with the intersection point nearest to the viewer.
An example of ray tracing parameters point (pt), direction (dir), and field of view (FOV). [A color version of this figure can be viewed online at http://journals.cambridge.org/aie]

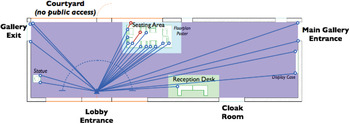
Figure 7 illustrates the calculation of visibility from the museum lobby entrance using ray tracing. Semantic information about the objects can be employed in determining visibility; for example, the rays strike the display case; however, the visible limit distance d for the display case has been exceeded (i.e., a museum visitor needs to be much closer to identify the display case compared to the seating area or reception desk). Given |V| objects, where each object shape consists of at most l lines, the complexity of this basic ray tracing approach is O(k × l × |V|). The resolution of the ray trace is determined by dividing the angular field of view by the number of gaps between rays, FOV/k; the resolution determines which objects may be erroneously excluded from the QvGraph, based on their size to distance (from the viewer) ratio. Clearly, using uniformly distributed rays is inappropriate for large open spaces where the distance of visible objects is high.
An example of ray tracing using k + 1 uniformly distributed rays. [A color version of this figure can be viewed online at http://journals.cambridge.org/aie]
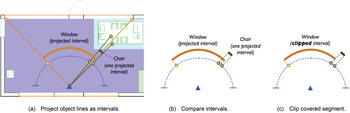
A second approach is to project the geometric vertices of the objects [that make up their two-dimensional (2-D) shape in the plan] onto a circular arc centered on the viewer's point location (calculated using the field of view and reference direction), and then compare the one-dimensional spatial object intervals on the arc to determine which objects are visible. Given two intersecting intervals a, b, if a partially covers b then the hidden portion of interval b is clipped. The remaining intervals that have not been completely eliminated by clipping represent the set of visible objects. This process is illustrated in Figure 8 and Figure 9. Given |V| objects, where each object has at most l lines, the complexity of a crude implementation of this approach is O(l 2 × |V|2) due to every interval being compared with every other interval. The resulting set of visible objects is accurate up to the accuracy of the representations of the object shapes.
The steps for determining visibility. [A color version of this figure can be viewed online at http://journals.cambridge.org/aie]

An example of calculating visibility by projecting each line that defines an object's shape onto an arc centered on the viewer, and then clipping covered segments (the clipped endpoints of visible intervals are shown in red online). [A color version of this figure can be viewed online at http://journals.cambridge.org/aie]

Other indoor space models can be used to reduce the number of objects considered when deriving the QvGraph. For example, the hierarchical model can be used to eliminate objects on different storeys, in distinctly different sections of a story, or even in different rooms (depending on the application).
3.3. Route graphs
A route graph, as defined in Werner et al. (Reference Werner, Krieg-Brückner, Herrmann, Freksa, Brauer, Habel and Wender2000), corresponds to a cognitively and linguistically motivated spatial representation of an environment that focuses on qualitatively capturing different routes an agent can use for navigation (Werner et al., Reference Werner, Krieg-Brückner, Herrmann, Freksa, Brauer, Habel and Wender2000). The derivation of such navigational knowledge for the case of built-up spaces is an important facility provided by our data access framework.
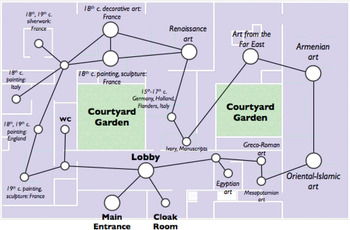
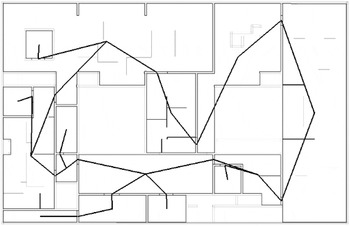
In general, a route graph represents topological information specifying which regions are connected in a way that enables movement between regions and how they are connected with respect to the qualitative direction of movement between the spaces and the physical relative orientation of the spaces. The objective is to model the paths that agents (such as people) and objects (such as gases) make through a building or a room. Route graphs are effective for modeling general navigability between regions based on how regions are connected. Route graphs are thus closely tied to the a priori specification of which regions exist, and the topological relationships between those regions. Route graphs are typically specified at one of two standard levels of granularity. Either a route graph describes the movement between different spaces within a building, or a route graph describes local movement between smaller regions within a space (such as a room). For example, Figure 10 illustrates the route graph (from the perspective of art gallery visitors) of the entire Gulbenkian floorplan, and Figure 11 illustrates the route graph of the Gulbenkian lobby.
A route graph of the Gulbenkian floorplan from the visitor perspective. [A color version of this figure can be viewed online at http://journals.cambridge.org/aie]

A route graph of the Gulbenkian lobby from the visitor perspective. [A color version of this figure can be viewed online at http://journals.cambridge.org/aie]

Route graphs can be employed to assist in a large number of tasks, such as navigation and wayfinding to identify the best path according to a desired metric. The range of wayfinding metrics includes
• minimizing the number of nodes traversed in the route graph,
• minimizing metric distance covered,
• taking the fewest turns, and
• taking scenic routes that pass through appealing spaces while avoiding unappealing spaces.
Route graphs can also be used to answer queries about the connectivity of buildings, for example,
• Do all offices have adequate access to emergency exits?
• Does the layout of the museum encourage free exploration of the exhibits in a nonlinear fashion, or alternatively does it structure the sequence of exhibits, thus facilitating a more linear and organized museum experience?
Definition 6 (route graph)
A route graph (G route) = (connects, R′2, V, f) is an indoor space model with a selection predicate connects ∈ R 2 and edges annotated with binary qualitative relations (determined by the user of the route graph).■
Creating a route graph requires defining the predicate connects between regions; this is a function of the geometric description of regions, the semantic notion of regions, and the semantics of the traveling agent or object that is being modeled. In general, connects corresponds to the RCC relation C, which may be easily derivable from the geometric data by checking for region intersection and boundary intersection. The semantic information about the types of regions and the nature of the traveling object are used to cull particular edges; for example, although a museum visitor is physically capable of entering some specific part of the building, that area may be restricted to museum staff only.
Route graphs can also be generated using the occupancy grid approach presented in Li et al. (Reference Li, Claramunt and Ray2009). A uniform grid of cells is overlaid on the floorplan, and each cell is annotated with its semantic region that it occupies (such as a particular room). The connection between adjacent cells is specified using impedance values that represent the ability of the agent or object to travel directly from one cell to the adjacent cell. Cell edges with infinite impedance values are removed from the graph. A route graph edge exists between a pair of regions a, b if an occupancy grid edge exists between a pair of cells associated with the regions a and b, respectively; assuming that regions are self-connected then this implies that a direct path exists, starting from any cell in a and ending in any cell in b, that does not pass through a cell in some other region c.
3.4. Flow vector graphs
The topological information represented in route graphs is often not rich enough (or at least does not make the necessary region distinctions) to specify certain qualitatively significant movement patterns of people and objects, such as modeling airflow in a relatively confined room connected to the building ventilation system (Kowadlo & Russell. Reference Kowadlo and Russell2006). In particular, it is likely that the regions in a space that are qualitatively significant for specifying movement patterns are not qualitatively significant in general, and those regions will not have been distinguished a priori. Thus, movement patterns cannot be sufficiently expressed using route graphs without first introducing new approaches for partitioning a room into regions that are only relevant for adequately modeling some particular movement phenomenon such as airflow. Rather than introducing numerous specialized region distinctions, these distinctions can be implicitly embedded in the definition of a new type of model called the flow vector graph.
Flow vector graphs are derived by directly focusing on the physical movement patterns of agents and objects rather than on the a priori definition of connectedness of the spaces that the agents and objects are moving through. In contrast to route graphs, flow vectors are effective for modeling object movement patterns using rules that specify expected object behavior, in a manner that is independent of the qualitative regions that have been defined beforehand. Flow vector graphs are thus closely tied to the underlying geometry of spaces, and the geometry and semantics of objects contained within those spaces (that is, rules for deriving flow vector graphs can specify different movement patterns depending on whether an object is a statue or a chair). As with route graphs, flow vector graphs typically either specify movement between different spaces within a building, or specify local movement within a space (such as a room).
Definition 7 (flow vector graph)
A flow vector graph (G FV) = (flowConnects, R′, V, f) is an indoor space model with a selection predicate flowConnects ∈ R 2 and edges annotated with unary or binary qualitative relations describing the flow along the path segment (determined by the user of the flow vector graph), that is, R′ ⊆ R 1 ∪ R 2.■
Defining flow vector graphs requires a strategy for placing the nodes of the flow vector in the environment, and specifying the flowConnects relation between node pairs. In particular, the nodes do not need to correspond to predefined objects and regions. One natural flow vector path that is induced by the structure of an environment is the path that follows the boundary of objects, such as the perimeter of a room or the edges of an island display cabinet; these paths are easily computed by manipulating the polygons that describe boundaries. Another natural path is one that follows an alignment of objects, such as a sequence of central display cabinets. Moreover, flow vector nodes can be placed according to domain specific rules. For example, Figure 12 illustrates a flow vector model that provides a rough qualitative description of the airflow in the Oriental–Islamic and Armenian gallery rooms. This model is based on research by Kowadlo and Russell (Reference Kowadlo and Russell2006); the authors present a set of simple qualitative rules that govern the movement of air through an enclosed space (derived from conventional computational fluid dynamics models). The algorithm given employs an occupancy grid. Each cell is annotated with an arrow indicating the airflow at that cell. Similar to route graphs, the occupancy grid with arrow-annotated cells can be used to derive the flow vector graph by defining qualitatively significant patterns.
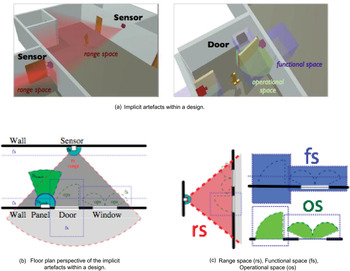
A flow vector graph of the Gulbenkian Oriental–Islamic and Armenian gallery rooms: (a) implicit artifacts within a design; (b) a floor plan perspective of the implicit artifacts; and (c) a range space (rs), functional space (fs), and operational within a design space (os). [A color version of this figure can be viewed online at http://journals.cambridge.org/aie]

Rather than edges being annotated with qualitative relations between the two objects, they can be optionally annotated with unary or binary qualitative descriptions of flow along the path represented by that edge (Fig. 13). Some examples of useful qualitative relations for annotating flow vector graph edges include the following:
• high, medium, or low flow rate along the path segment (unary relations)
• dense or sparse traffic along the path segment (unary relations)
• popular, medium, or unpopular path connecting from a junction (unary relations);
that is, these relations specify a rough measure of the likelihood that an object will take a particular path when reaching a junction point in the flow vector graph
• increase, no change, or decrease in flow rate from the point at the start of the path segment to the point at the end of the path segment (binary relations)
• increase, no change, or decrease in traffic density from the point at the start of the path segment to the point at the end of the path segment (binary relations)
• more popular, equivalent, or less popular junction path compared to some alternative path connecting from the same junction (binary relations)
Spatial artifacts are entities, which unlike regular spatial objects, do not have a physical manifestation in reality (or within a design) but need to be treated as such for all practical and reasoning purposes. Adapted from “Spatio-Terminological Inference for the Design of Ambient Environments.” by M. Bhatt, F. Dylla, and J. Hois, Reference Bhatt, Dylla, Hois, Hornsby, Claramunt, Denis and Ligozat2009, Conf. Spatial Information Theory (COSIT'09) (Hornsby, K.S., Claramunt, C., Denis, M., & Ligozat, G., Eds.), pp. 371–391. Copyright 2009 by Springer–Verlag. Adapted with permission. [A color version of this figure can be viewed online at http://journals.cambridge.org/aie]

Thus, flow vector graphs are ideal not only for specifying expected movement patterns but also for estimating congestion and identifying potential bottlenecks in movement paths.
3.5. Spatial sequence models
In natural language it is common to refer to a sequence of objects, where the objects are ordered along some path through the environment. Consider the following expressions:
• Numerous paintings are mounted along the wall.
• The Far East art section is down the room after the Oriental–Islamic and Armenian rooms.
• Rivits have been placed evenly along the edge of the column.
• Further into the room is a group of partitions.
In each of these examples a virtual path has been implicitly defined (e.g., based on a flow vector graph described in the previous section), and the objects have been partially or totally ordered along this path. The paths typically follow the shape of some reference object such as a wall, beam, table surface edge, and so on. Moreover, the path is directed giving meaning to the terms before and after; one example is by specifying the start of the path to be the object that is nearest to the person referring to the sequence of objects. Note also that paths may be a simple cycle consisting of a single loop involving all objects (i.e., a circuit), for example, art pieces positioned along the complete perimeter of a gallery room.
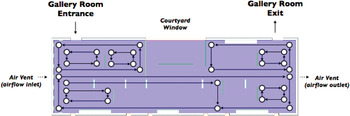
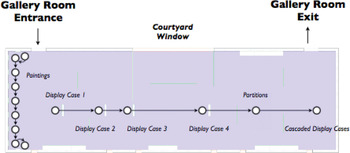
This notion is formalized as a spatial sequence model where nodes represent objects and directed edges represent the object ordering. Edges are optionally annotated with any useful additional qualitative spatial relations between the ordered objects. Figure 14 illustrates an example of two spatial sequence models in one of the Museu Gulbenkian gallery rooms. Using these spatial sequence models an SAS can formally interpret the following natural language expressions about the objects in the gallery rooms:
• Paintings line the walls on my right side. I particularly like the painting on the far end.
• A display case is positioned at the foot of the room. Further into the room is a second display case, a pair of large rugs, and a third display case, followed by a group of three partitions that span the entire height of the gallery space. Beyond the partitions, along the back wall, is a cascaded arrangement of display cases.
Definition 8 (spatial sequence graph)
A spatial sequence graph (G SS) = (successor, R, V, f) is an indoor space model with a selection predicate successor ∈ R 2 and directed edges annotated with binary qualitative relations (determined by the user of the spatial sequence graph).■
Two spatial sequence models within the Oriental–Islamic and Armenian gallery rooms. [A color version of this figure can be viewed online at http://journals.cambridge.org/aie]

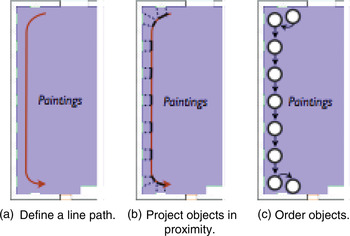
If an object is within a threshold distance of the path then the object's shape is projected on to the path as an interval. Alternatively, objects can be placed within an environment by specifying their qualitative arrangement along a path, and then projecting their shape at a tangent from the path onto the environment.Footnote 5 The ordering of intervals along the path specifies the successor relation in the spatial sequence model. This process is illustrated in Figure 15.
(a–c) The steps for determining a spatial sequence of objects. (b, c) The order of the steps can be swapped when generating a concrete design from a qualitative specification. [A color version of this figure can be viewed online at http://journals.cambridge.org/aie]

3.6. Spatial artifacts
Semantic descriptions of designs and their requirements acquires real significance when the spatial and functional constraints are among strictly spatial entities as well as abstract spatial artifacts. For instance, although it is possible to model the spatial layout of an environment at a fine-grained level, it is not possible to model spatial artifacts such as the range space of a sensory device (e.g., camera, motion sensor, viewpoint of an agent), which is not strictly a spatial entity in the form of having a material existence, but needs to be treated as such nevertheless. In general, architectural working designs only contain physical entities. Therefore, it becomes impossible for a designer to model constraints involving spatial artifacts at the design level. For instance, consider the following constraint: the motion-sensor should be placed such that the door connecting room A and room B is always within the sensor's range space. Bhatt et al. (Reference Bhatt, Dylla, Hois, Hornsby, Claramunt, Denis and Ligozat2009) identify three types of spatial artifactsFootnote 6:
A1. The operational space denotes the region of space that an object requires to perform its intrinsic function that characterizes its utility or purpose.
A2. The functional space of an object denotes the region of space within which an agent must be located to manipulate or physically interact with a given object.
A3. The range space denotes the region of space that lies within the scope of a sensory device such as a motion or temperature sensor, or any other entity capable of visual perception. Range space may be further classified into other categories, such as observational space (e.g., to model the concept of the isovist Footnote 7).
Figure 13 provides a detailed view on the different kinds of spaces we introduced. From a geometrical viewpoint, all artifacts refer to a conceptualized and derived physical spatial extension in ℝn. However, they do differ from an ontological perspective and the manner in which their geometric interpretations in ℝn are derived. The derivation of an interpretation may depend on an object's inherent spatial characteristics (e.g., size and shape), as well as additional parameters referring to mobility, transparency, and so forth.
4. MUSEUM DESIGN: A CASE STUDY IN APPLYING MULTIPLE MODALITIES
Architects aim to configure building features such as lighting, object layout, and object materials, in order to evoke complex moods and sometimes even convey deep ideas that reflect an artistic vision. That is, architects must bridge the gap between the objective building design and the highly complex, subjective impressions of the building occupants. This requires architects to routinely analyze and process enormous amounts of detailed numerical information about building features in order to determine whether the appropriate emotions will be conveyed, which can be an extremely tedious, error prone, and time-consuming exercise.
The primary purpose of spatial assistance applications is to transfer this burden from the user onto the computer system. Automating an architect's ability to reason about subjective concepts requires externalizing the spatial awareness capabilities of the architect and formalizing this in a spatial assistance system that provides semantic data access services. For example, qualitative concepts such as the apparent brightness of an indoor space are complex and highly subjective; apparent brightness is not only a function of the lumens that are incident on surfaces but also incorporates domain knowledge about the effects of the relative brightness between rooms, the relative brightness of objects in the same room, other properties of objects such as the materials used.
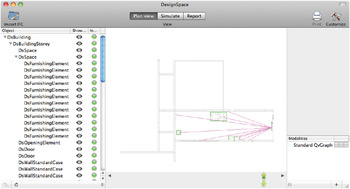
The rules for evoking these subjective responses are qualitative in nature, and are ultimately grounded in the geometric relationships and objectively observable features such as lumen measurements, metric wall dimensions, and angular orientations. Hence, a multiperspective spatial assistance system that integrates the numerical, qualitative spatial, and conceptual levels is necessary. In addition, spatial artifacts are an extremely convenient and versatile mechanism for formalizing architectural qualitative concepts. Thus, we have developed an application DSim:Live your design that parses IFC files and derives the modalities described in this article. Figure 16 illustrates a screen shot of DSim being used to analyze a QvGraph in the Gulbenkian lobby. We will now demonstrate the usefulness of modalities by presenting two case studies that exemplify the versatility of the multiple spatial data access modalities provided by our framework.
A screenshot of DSim:Live your design. [A color version of this figure can be viewed online at http://journals.cambridge.org/aie]

4.1. Designing the museum lobby
For most visitors, the lobby is the first encounter with the museum interior. By providing the critical “first impression” of the museum, the lobby has the responsibility of setting the tone of the gallery experience, for example, the “Gulbenkian image of prestige—excellence, sobriety and essentiality” (Tostoes et al., Reference Tostoes, Carapinha and Corte-Real2006, p. 34), must be immediately established by the layout, materials, and lighting of the lobby. Of course, a key functional purpose of the lobby is to facilitate the administrative processes of purchasing tickets, depositing bags and coats in the cloak room, providing basic museum and exhibition information, and so on. The logistics of these administrative tasks must not distract visitors from the gallery atmosphere. The impact is minimized by providing a calm, organized, uncluttered experience, where visitors are intuitively guided through these tasks before entering the gallery. This is achieved with appropriate lobby layout, signage, and so on; in the case of the Gulbenkian museum, one could argue that precisely these qualities of calm sophistication and orderliness reinforce the desired “image of prestige.”
As visitors enter the lobby, typically the first area that they need to identify is the reception desk for ticketing and general museum information such as the exhibits. After purchasing gallery tickets, the visitors must then proceed on to the gallery entrance; this must be reinforced spatially by the arrangement of the museum lobby entrance, the ticketing area, and the gallery entrance. Restrooms provide a space for visitors to refresh and recuperate; this necessary sense of privacy must be evoked by the physical layout of the lobby, and reinforced by the apparent brightness of the restroom area where dim ambient illumination has been shown to evoke a sense of privacy (Flynn, Reference Flynn1977; Flynn et al., Reference Flynn, Spencer, Martyniuk and Hendrick1973).
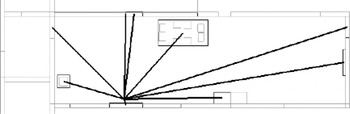
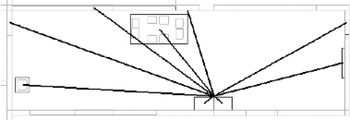
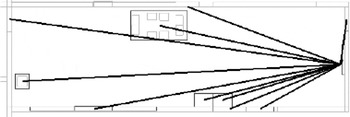
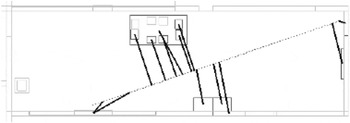
By analyzing the indoor space models of the lobby, the architect can determine whether the layout evokes the desired coherent, calm atmosphere. The QvGraph illustrated in Figure 17 shows that, as visitors enter the lobby, the reception desk is visible as required. Analyzing the spatial sequence graph of the lobby illustrated later, we can see that the lobby entrance, reception desk, display cabinet and gallery entrance are ordered on the path across the room. This helps to intuitively structure the visitor tasks that are necessary before entering the gallery. By combining the spatial sequence graph with the QvGraph as illustrated in Figure 18 and Figure 19, we can confirm that each area in the spatial sequence graph is visible from the preceding area. The QvGraph of the lobby also shows that the restrooms are out of view of the main public entrance, therefore supporting the necessary sense of privacy. The architect also needs to analyze the lighting of the restrooms to ensure that a sense of privacy is reinforced. The first step is to define an ontology of lighting objects and then define their spatial artifacts. This allows architects to specify formal logical expressions that involve all relevant aspects of building objects. Figure 20 provides the spatial sequence graph of the lobby.
Example 1 (spatial artifacts for light sources)
The range space is the approximate geometry of the beam of light (e.g., formed by projecting a cone from the source to the extent of the room, and then clipping the cone appropriately). The functional space is the collection of regions in a room where occupants will benefit from the light source.■
A qualitatively annotated visibility graph of the Gulbenkian lobby from the lobby entrance.

A qualitatively annotated visibility graph of the Gulbenkian lobby from the reception desk.

A qualitatively annotated visibility graph of the Gulbenkian lobby from the display case.

The sequence of objects along the visitor path from the lobby entrance to the main gallery entrance.

In the second step, we encode the domain knowledge provided by the architectural lighting community. The examples build on each other, starting from the numerical level and working through to the conceptual level.
Definition 9 (direct illuminance)
The direct illuminance (E d) of a surface is the total lumens that travel directly from light sources to the surface (i.e., excluding reflected lumens). Selecting the appropriate light sources simply requires testing whether the range space of the light (i.e., the projected light beam) intersects the surface region,

where O (overlaps) is an RCC qualitative relation between regions.■
Definition 10 (first-bounce ray tracing)
Determining lumen incidence on a surface accurately is generally a difficult task that requires sophisticated ray tracing techniques. Cuttle (Reference Cuttle2003) provides a first-bounce approximation called the mean surface exitance of a space that takes the surface direct illuminance, area, and reflectance into account. This can be implemented using the hierarchical model defined by the contains relation,

Definition 11 (surface illuminance)
The total surface illuminance E is the sum of direct and indirect illuminances,

such that Contains(room, surface).■
Definition 12 (ambient illumination)
The apparent (qualitative) ambient illumination can be determined as a function of the mean surface exitance. For example, Cuttle (Reference Cuttle2003) suggests that between approximately 30 and 100 lm/m2 corresponds to a dimly lit environment, whereas spaces with a mean surface exitance value above 1000 lm/m2 will appear distinctly bright,

The lighting designers need to ensure that the ambient illumination in the restrooms is dim according to research in the architectural lighting community by Flynn and colleagues (Flynn, Reference Flynn1977; Flynn et al., Reference Flynn, Spencer, Martyniuk and Hendrick1973).
4.2. The experience of continuity within and between gallery spaces
As visitors move between spaces in the gallery, the relationships between these different spaces can add to the tone and flow of the gallery experience. One salient element is the sense of continuity, influenced by both contrasting and subtle differences between the gallery spaces.
Continuous spaces effortlessly flow together with respect to aesthetic qualities, the narrative that ties the series of art pieces together, and navigability where the visitor is gently and intuitively guided from one space to another. In this sense a continuous flow between spaces evokes a calm, coherent, and controlled atmosphere. Alternatively, discontinuities can provide contrast, emphasis (by highlighting a particular art piece) and drama by jarring the visitor with strong changes. Discontinuities in the visitor's sense of orientation can evoke a feeling of exploration and curiosity by obfuscating obvious paths through the gallery, thus inviting the visitor to freely explore the spaces in a nonlinear fashion. Consider the following feature in the design of the Gulbenkian (Tostoes et al., Reference Tostoes, Carapinha and Corte-Real2006, p. 34):
The integration of the Museum into the park, allowing for moments of reflection and contact with the exterior, the enhancement of the works of art without impositions by the “architecture,” thus favouring the neutrality of the space placed in the service of the collection.
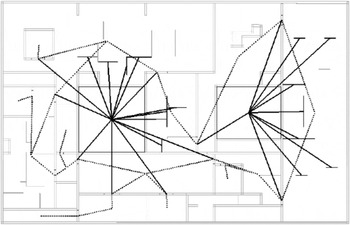
The centrally located courtyards and the visible surrounding park evoke a strong sense of continuity throughout the museum. Because the courtyards and the park are visible from almost every major gallery space, they provide a common theme that unites the different gallery spaces while providing a stabilizing landmark that orients visitors. This design feature is apparent when analyzing the QvGraph of the different spaces, as illustrated in Figure 21 (here, the route graph with dashed lines and visibility graph with solid lines are superimposed). By combining this information with the route graph of the museum illustrated in Figure 22, it can be observed that both the courtyard and park are visible from a number of regions along the entire path of the museum. This highlights the property that, as visitors move through the museum, they will regularly be exposed to the courtyard and park. Furthermore, the QvGraph highlights that, as the visitors enter the lobby, the first feature they will see is the central courtyard (i.e., the courtyard is in_front of the lobby entrance), immediately establishing the sense of flow and continuity from the exterior park to the interior of the museum.
A visibility graph of the courtyards with respect to the visitor movement spaces (derived from the route graph) and display walls of the Gulbenkian.

A visitor route graph of the Gulbenkian.

The Gulbenkian museum has a linear layout with respect to the path that visitors follow when passing through the gallery rooms. The aim is to guide visitors through the museum as opposed to the free-exploration approach. By analyzing the route graph indoor space model, we can identify basic characteristics of the layout that are relevant for continuity through the museum. In Figure 22 we see that the visitor has very few decision points. Moreover, paths that deviate from the main loop (i.e., the Egyptian art room, the 18th and 19th century French silverwork room, and the 18th and 19th century English painting room) are brief excursions (where the visitor will return to the decision point on the main looping path), each consisting of a single room. This strongly indicates continuity with linear movement through the gallery rooms.
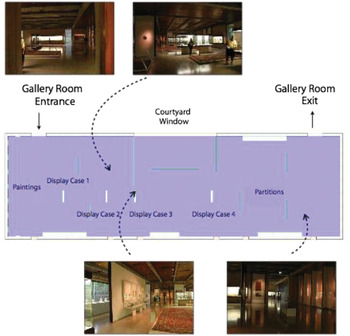
Continuity can also be analyzed within a space, such as a single gallery room. A sense of continuity is fostered by organizing the layout, lighting, and so on, such that the visitors are directed from the room entrance, through the art pieces, and to the exit of the room in a natural, intuitive way. Consider the Oriental–Islamic room and the Armenian room illustrated in Figure 23. The spatial sequence graph of this space, illustrated in Figure 14, highlights the natural progression from the entrance of the room, through a sequence of display cabinets, carpets, and partitions that run down the length of the gallery space, leading toward the exit of the Armenian room. This is reinforced by the QvGraph; from the perspective of each art piece in the sequence, the next art piece is visible and apparent (despite the exit not being visible from the entry). Notice that not all gallery rooms have this linearity. For example, in Figure 1 observe that the 18th century French decorative art room, and 18th century French painting, sculpture room have a number of partitions (mounted with art pieces) that can be traversed in a number of different alternative ways. By analyzing a flow graph of that space in conjunction with the localized QvGraph, we can observe that different paths exist, and that not all objects are visible along all paths; this indicates a less linear localized gallery space that invites slightly more free-form exploration.
The floorplans of the Oriental–Islamic gallery room and the Armenian gallery room in the Museu Calouste Gulbenkian (Tostoes et al., Reference Tostoes, Carapinha and Corte-Real2006). [A color version of this figure can be viewed online at http://journals.cambridge.org/aie]

A pivotal indoor space in the Gulbenkian museum is the connection between the Classical–Oriental circuit and the European circuit (which occurs at the manuscripts and ivory works gallery room). The architect may want to evoke a distinct abrupt change, breaking the sense of continuity (using layout, lighting, and so on) in order to symbolize the distinct chronological and geographical change in art. More likely, in the case of the Gulbenkian museum, the architect may choose to mitigate the jarring discontinuity in order to maintain the reflective mood carefully fostered with the design of centrally located courtyards and exposed exterior parks. For this we can investigate the sense of continuity between two spaces by analyzing the qualitative difference in ambient illumination. A striking difference (e.g., moving from a dim room to a very bright room) will break the sense of continuity, and thus in the case of the Gulbenkian, the architect may need to ensure that the ambient illumination levels are qualitatively similar.
Definition 13 (perceived illuminance difference)
The perceived, qualitative difference in illumination when moving between different rooms is determined as a ratio of mean surface exitance values. For example, Cuttle (Reference Cuttle2003) suggests that a viewer will notice a distinct difference in illumination if the ratio is between 3:1 and 10:1, and the viewer will feel a strong difference when the ratio is between 10:1 and 40:1:
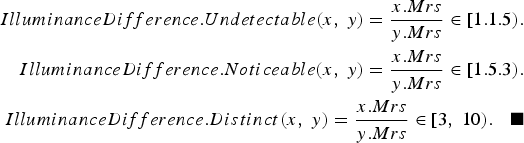
The lighting designers of the Gulbenkian simply need to check whether the illuminance difference is undetectable. This concludes the analysis of continuity in the Gulbenkian art museum.
5. INTEROPERABILITY AND INDUSTRIAL CONFORMANCE
Our multimodal spatial data access framework is grounded partly in industry design practices and standards such as the BIM (Eastman et al., Reference Eastman, Teicholz, Sacks and Liston2008), IFC (Froese et al., Reference Froese, Fischer, Grobler, Ritzenthaler, Yu, Sutherland, Staub, Akinci, Akbas, Koo, Barron and Kunz1999), and professional CAAD design tools such as Graphisoft ArchiCAD 14 (http://www.graphisoft.com/). The IFC is a nonproprietary data exchange format that represents building, construction, and architectural design information. IFC was developed in response to the need for more domain-specific models, and to foster interoperability in the construction IT industry. Of importance, IFC incorporates domain knowledge by defining objects classes such as walls, door, and windows and the inherent relationships between object classes; numerous geometric primitives are also defined such as points, lines, and polygons for representation geometric information about the placement and shape of objects. Commercial design tools such as Graphisoft's ArchiCad support IFC export capabilities and a range of free software tools exist for modeling, visualizing, and validating IFC data. As our approach utilizes IFC data, data sets from any IFC compliant design tool remain utilizable.
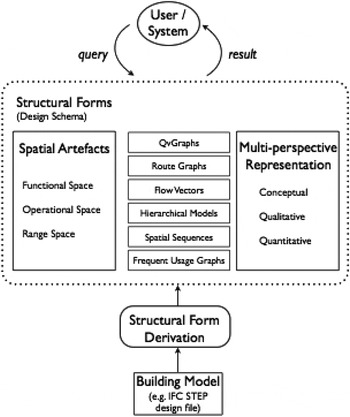
In this section we present technical details about deriving and augmenting building models from IFC in order to facilitate qualitative reasoning. Figure 24 presents an overview of our framework.Footnote 8
The spatial data access framework.

We implemented a prototype tool for converting an IFC design file into a model that supports the data access as per the modalities introduced in Section 3. The key stages of the model derivation are the following:
1. parsing the IFC design file into a set of 2-D floor plans (i.e., one 2-D floor plan for each building storey) by extracting the salient geometric and relational design information and
2. deriving indoor space models, which insofar as this paper is concerned, encompass features such as geometric placement and shape representations of spatial artifacts, and qualifying the geometric data to derive qualitative spatial relations relevant to QvGraphs, route graphs, and so on.
IFC is a large and comprehensive building data model that aims to encompass all aspects of building design and construction including cost management, construction logistics, life-cycle management, and so on. The aspects of IFC that are of primary significance for qualitative reasoning are IFC objects (IfcProduct) and key IFC relationships between objects (IfcRelationship). The two key features of objects that require parsing are placement and shape representation information.
5.1. Extracting IFC object geometeries
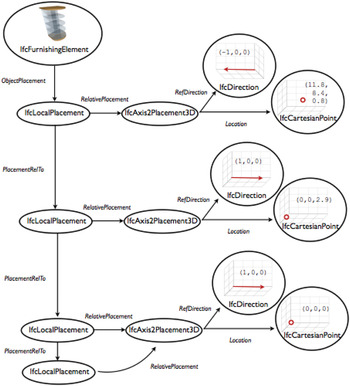
We define placement as a translation and a rotation of the object's origin and direction, which is extracted from the object's unique IFC placement information and the object's IFC placement relative to other objects. IFC represents position information in a hierarchical manner, associating the position and direction with respect to other reference objects.Footnote 9 The parser traces back through these hierarchies in order to determine an object's absolute location. Figure 25 illustrates an example of the IFC representation of the placement of an object.
Placement information in industry foundation classes. [A color version of this figure can be viewed online at http://journals.cambridge.org/aie]

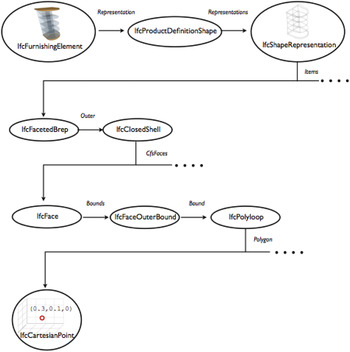
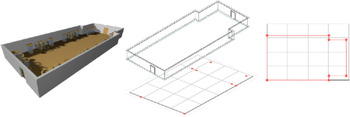
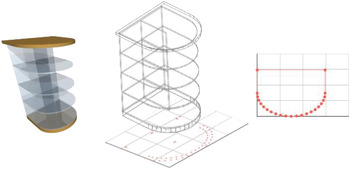
An object's shape representation is defined as a 2-D polygon that can contain holes, which describes the object's schematic footprint on a floor plan. IFC represents shapes using a number of different methods including 2-D profile sweeping (including extrusion and revolution), surface models (shell based and face based), faceted B-reps, and so on; Figure 26 illustrates an example of the IFC representation of the shape of an object. Our parser derives a suitable 2-D floorplan representation of an object based on its three-dimensional IFC representation as follows.Footnote 10 In IFC design files the geometric representations of walls, rooms, and other spaces are typically specified as 2-D footprints that are vertically extruded. In these cases we use the 2-D footprint as the representation of the parsed object in our framework, as illustrated in Figure 27. Other smaller objects such as doors and furniture are typically represented in IFC files using more complex B-rep representations that are parsed as follows:
1. collect the set of points and line segments that define the three-dimensional shape;
2. project the points and line segments onto the 2-D plane parallel to the floor; and
3. use the set of geometric primitives to derive a suitable 2-D shape: bounding box, convex hull, or minimum bounding polygon (Fig. 28).
Shape representation information in industry foundation classes. [A color version of this figure can be viewed online at http://journals.cambridge.org/aie]

Extracting the representation of a room from an industry foundation classes model. [A color version of this figure can be viewed online at http://journals.cambridge.org/aie]

Deriving a two-dimensional representation of a museum display cabinet from a three-dimensional industry foundation classes B-rep model containing 1333 vertices. [A color version of this figure can be viewed online at http://journals.cambridge.org/aie]

5.2. Deriving modalities from IFC models
Each modality divides space into semantic regions, which are typically associated with some parent product. The modality graph is then constructed based on the relationship between products and the derived semantic regions of space. We will illustrate this process by specifying the derivation of route graphs and visibility graphs.
5.2.1. Deriving route graphs
A route graph divides space into regions in which a person or object can move without passing into another distinct region of space (where the precise definitions can be specialized to yield different route graphs), and these regions can be grouped according to building storeys in the IFC model. Movement space is derived by specifying how space is divided into distinct regions, and how these regions are then connected. For example, both walls and openings can be said to form the boundary of a contiguous region of space in which a person can move freely, that is, they delimit the movement space. However, openings are also visitable in the sense that they can be moved through, and thus form a connecting point between adjacent regions of movement space.
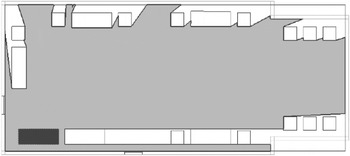
The first step is defining the conditions under which a product delimits space, that is, defining when the parsed geometry of the shape representation provides a boundary for spatial movement. The polygonal geometries of delimiting objects are subtracted from the default movement space region (which is initialized as a bounding box of the entire design). Figure 29 illustrates one such derived region of movement space in DSim,Footnote 11 where products are delimiters if their IFC class type is either walls, doors, openings, windows, or furniture (i.e., large freestanding partitions on which art is mounted). The second step is defining the conditions under which a product is visitable. Visitable objects are spatially connected if their parsed IFC geometries intersect the same movement space. DSim generates the route graph illustrated in Figure 22 when IFC openings, doors, spaces, and derived movement spaces are specified as visitable.
A contiguous region of movement space derived from the industry foundation classes model.

5.2.2. Deriving QvGraphs
A QvGraph divides space into regions from which a given object is visible. That is, from any point within a visibility space for an object, a straight line can be drawn from that point to some point within the geometry of the given object that does not intersect the geometry of any barrier object.
Visibility spaces are derived by specifying the objects that form visibility barriers and by specifying the conditions under which a given object is considered visible. The parsed IFC geometries of barriers occlude visibility, and their shadows are subtracted from the default visibility space (which is initialized as a bounding box of the entire design).Footnote 12Figure 30 illustrates the visibility space of a display cabinetFootnote 13 where products are barriers if their IFC class type is either walls, doors (i.e., assumed to be closed in this example), and display cabinets (which are represented as types of furniture in IFC). The QvGraph for the given product is then derived by checking which visible objects are within the visibility space. Figure 31 illustrates the visibility space of the display case where visible objects are doors, openings, and display cabinets.
The visibility space of the lower left display cabinet derived by DSim.

A qualitatively annotated visibility graph for the lower left display cabinet derived by DSim based on the visibility space illustrated in Figure 30.

5.3. Extracting IFC object relationship information
In general, the IFC relationships that are necessary for qualitative reasoning are between two sets of objects. For example, aggregation (IfcRelAggregates) is between one relating object and a set of related objects that decompose the relating object. Determining whether a relationship is parsed requires checking that the relationship type is supported, and checking that at least one related object and at least one relating object are supported.
6. CONCLUSION AND RESEARCH OUTLOOK
We have developed and demonstrated a multimodal spatial data access framework designed to serve the informational and computational requirements of architectural design assistance systems that are intended to provide intelligent spatial decision-support and analytical capabilities. The framework focuses on multiperspective semantics, qualitative and artifactual spatial abstractions, and industrial conformance and interoperability within the context of industry tools and standards: in this context, we ensure interoperability with commercial tools concerned with the creation, manipulation, and management of environmental data by utilizing the stipulations of the BIM (Eastman et al., Reference Eastman, Teicholz, Sacks and Liston2008) and the IFC (Froese et al., Reference Froese, Fischer, Grobler, Ritzenthaler, Yu, Sutherland, Staub, Akinci, Akbas, Koo, Barron and Kunz1999). The framework also aims at providing qualitative and cognitively adequate representational mechanisms, and the formal interpretation of the structural form of indoor spaces that are not directly provided by conventional CAAD-based or quantitative models of space.
The future outlook of our work consists of extending the framework such that it is usable by other applications and users via the medium of a high-level ontology-based specification (Bhatt, Hois, & Kutz, Reference Bhatt, Hois and Kutz2011); that is, our contributions of this paper will form the computational basis for a broader initiative for the development of industrially relevant ontological specifications of indoor spatial environments. Here, the objective is to develop an indoor spatial data representation ontology that encompasses industrial data models such as the IFC and integrates our perspective toward the conceptual representation of the structural form of an environment and functional requirement constraints occurring therefrom (Fig. 32). Future research in this direction aims to contribute toward integration with broader standardization initiatives, and provide industrially driven case studies, within international initiatives such as Applied Ontology (IOAO SIG on Design Semantics, http://www.iaoa.org/iaoaSIG/SIGdesign/SIGdesign.php) and ISO-Space (http://iso-space.org/). Figure 33 presents an overview of the proposed model for the ontological grounding of IFC models. Immediate work is in progress for developing an extended IFC ontology that also incorporates spatial artifacts and qualitative concepts. This can be used as a schema for defining models that support domain-specific qualitative reasoning, as illustrated in the upper portion of Figure 33; an extract of the schema for modeling walls is illustrated in Figure 32. Work is also in progress to implement the IFC to OWL transform illustrated in Figure 33; the framework of this paper will be the computational core that underlies this IFC to OWL transform. Finally, from the viewpoint of basic research objective, we also pursue questions pertaining to the development of high-level declarative spatial reasoning (Bhatt, Lee, & Schultz, Reference Bhatt, Lee and Schultz2011) capabilities that would provide advanced spatial computing capabilities for next-generation design computing systems.
An extract of the indoor space modeling schema. [A color version of this figure can be viewed online at http://journals.cambridge.org/aie]

Ontological grounding: industry foundation classes to OWL.

ACKNOWLEDGMENTS
We gratefully acknowledge the funding and support of the German Research Foundation (DFG). The work described in this paper was conducted as part of the DFG funded SFB/TR 8 Project DesignSpace (http://www.sfbtr8.spatial-cognition.de/designspace.html). We also acknowledge the educational software licenses provided by Graphisoft for their commercial design tool ArchiCAD. All plans illustrated in this paper were designed using ArchiCAD 13.
Carl Schultz is a Postdoctoral Researcher in the Cognitive Systems Group at the University of Bremen. In 2010 he completed his PhD at the University of Auckland, New Zealand, on software engineering methodologies for developing spatial reasoning applications. His research aims to address the challenges of developing software applications that employ commonsense, qualitative spatial representation, and reasoning; as a member of the DesignSpace project, his specific focus is on computer aided architectural design tools.
Mehul Bhatt is a Research Fellow (Principal Investigator) in the Cognitive Systems Group within the Faculty of Mathematics and Informatics at the University of Bremen. He is also a member of SFB/TR 8 at the University of Bremen and University of Freiburg. Mehul attained his PhD in computer science in 2008 in Melbourne, Australia; his master's in information technology in 2004 in Melbourne, Australia; and his bachelor's of commerce and economics in 2001 in Mumbai, India. Dr. Bhatt's research topics include spatial cognition, spatiotemporal reasoning, commonsense spatial reasoning, cognitive robotics, applied ontology, and parallel and distributed systems. Mehul addresses applications in the domains of design computing and computational design analysis, spatial design assistance, robotics, geographic information systems, and medical information systems.