The Gold Pool (1961–1968) was probably the most ambitious case of central bank cooperation in history. In the early 1960s, the main central banks of the Western world decided to pool their interventions in the gold market to ensure the stability of the international monetary system. They coordinated their purchases and sales of gold in London to stabilize the gold-dollar parity on which the whole Bretton Woods system was built. They shared profits and losses from common operations.
The Gold Pool (or Pool for short) was at the heart of the Bretton Woods system and worked effectively for almost seven years, but ultimately collapsed on 15 March 1968. The market price of gold, which had been maintained around the official parity ($35 per ounce) thanks to the Gold Pool, immediately jumped to $37.7 when the gold market reopened in April and reached $42 a month later. The end of the Pool triggered the creation of a two-tier gold market which de facto seriously threatened gold-dollar convertibility, anticipating the fall of the Bretton Woods system a few years later (Bordo Reference Bordo, Michael and Eichengreen1993; Bordo, Humpage, and Schwartz 2015, p. 181; James Reference James1996, p. 209; Eichengreen 2010; Schenk Reference Schenk2010, pp. 183–84).Footnote 1 The history of the Gold Pool is a milestone in understanding the functioning of the Bretton Woods system as well as the limits of central bank cooperation. It raises two key questions for historians of the international monetary system. Did the Gold Pool collapse because central banks eventually refused to cooperate, as it was the case in the 1930s? What could trigger a confidence crisis in the reserve currency?
In this article, we show that the devaluation of sterling in November was an external shock that caused major losses for the Gold Pool, leading to its demise. Our contention is that contagion between reserve currencies, rather than non-cooperative behavior, explains the failure of the Pool. We show that the link between sterling and the market price of gold was not a sudden phenomenon arising in 1967, but a key feature of the international monetary system since at least the troubles of sterling in the fall of 1964. One might guess that the crisis and devaluation of sterling (the second reserve currency) would have increased demand for dollars (the first reserve currency). What happened was the reverse. Instead of competition, there was contagion between these two reserve currencies. Our argument echoes claims by contemporaries who viewed sterling as the first line of defense for the dollar and anticipated that the fall of sterling would deliver a serious blow to the credibility of the gold-dollar parity. Contagion from sterling to the dollar was made possible because sterling was the second reserve currency (Eichengreen, Mehl, and Chitu Reference Eichengreen, Mehl and Chitu2017) and, despite its decreasing role, it was still viewed by investors as a pillar of the international monetary system (Naef Reference Naef2018). This view was reinforced by the development of international and U.S. financial support to sterling in the 1960s (Strange Reference Strange and Shonfield1976; Schenk Reference Schenk2010). It was understood that a devaluation of sterling could make a devaluation of the dollar possible, while the gold-dollar peg was itself under pressure because of expansionary U.S. monetary and fiscal policies leading to inflation and balance of payments deficits (Meltzer Reference Meltzer1991; Bordo and Eichengreen Reference Eichengreen2008).Footnote 2 Inflationary domestic U.S. financial policies were a necessary condition for contagion whereas a sterling crisis turned out to be the sufficient condition that triggered speculation on the gold-dollar parity. Central bank cooperation through common intervention and risk-sharing could not replace rules-based national policies to maintain confidence in the currency.
Our argument is based on evidence from a vast amount of previously unused archival material and historical statistics, mostly from the Bank of International Settlements (BIS) and the Bank of England, complemented with other primary sources from French and U.S. institutions. We study two key policy actions which were not publicly observable in the 1960s: central banks’ demand for gold at the U.S. Treasury (including demand by the Bank of England to settle Gold Pool operations) and Gold Pool interventions.Footnote 3 Using this data, we first show that the dramatic decline in U.S. gold reserves in 1967 leading to the demise of the Pool was not caused primarily by free-riding by other central banks. Instead, U.S. gold reserves fell because the Gold Pool worked as expected and experienced heavy losses. Second, we use daily data on Gold Pool interventions, gold prices, and sterling exchange rates to study the link between sterling and the credibility of the gold-dollar peg. Econometric results point out that the London dollar price of gold was influenced by the sterling forward rate well before the November 1967 sterling crisis and devaluation. The 1964 sterling crisis appears to be a turning point in the history of the dollar price of gold. Estimations with monthly data (where we are able to control for a wider set of variables) confirm these results and show that Gold Pool interventions were also triggered by U.S. domestic variables such as inflation, the government deficit, and changes in international reserves (reflecting the balance of payments deficit). Before the 1967 devaluation, the magnitude of these effects was not large enough to significantly affect U.S. gold reserves through losses of the Pool, and it is only in December 1967 that the U.S. gold stock experienced a sudden break. Moreover, the role of uncooperative French policies—a common explanation for the collapse of the Pool (Meltzer Reference Meltzer1991)—is found to be minor in our econometric estimations as well as in our analysis of contemporary reports on the London market. The notorious and vociferous gold buying policy of the French in 1965 (Bordo, White, and Simard 1995; Monnet 2017) was much less important to the Bretton Woods system than the intricate relationship between sterling and the dollar.
Historians of Bretton Woods have long considered the role of sterling and its link with the dollar (Bordo Reference Bordo, Michael and Eichengreen1993; James Reference James1996; Toniolo and Clement Reference Toniolo and Clement2005; Eichengreen Reference Eichengreen2008; Schenk Reference Schenk2010), but no quantitative examination has been undertaken to assess the timing, the magnitude, and the nature of this link. This article fills that gap. Previous research has argued that the Gold Pool suffered from a flawed design which could not prevent free-riding by its members (Eichengreen 2010), and noted that central banks finally left the Pool because they experienced financial losses (James Reference James1996; Toniolo and Clement Reference Toniolo and Clement2005). These important arguments about the benefits and the design of cooperation cannot explain, however, why the Gold Pool experienced major losses in the fall of 1967, was terminated in March 1968, and why it had operated quite successfully before that, despite frequent minor losses and the uncooperative French behavior. Our explanation, emphasizing the dual role of domestic U.S. policies and the travails of sterling, has the merit of providing a full explanation of the chronology of the Gold Pool.
The first section of the article describes the design and the operations of the Gold Pool, presenting a large amount of previously unknown information. The second section studies the effect of the November 1967 sterling devaluation on the gold market and on U.S. gold reserves. Section three further examines the relationship between sterling and the Gold Pool, showing that the link existed long before 1967 and that it was also dependent on U.S. domestic policies. This peculiar relationship with the dollar was indeed specific to sterling and is not observed with the French Franc or Deutsche Mark. Finally, our concluding section presents implications for the literatures on central bank cooperation, reserve currency, and the history of the international monetary system.
THE BEGINNING, DESIGN, AND OPERATIONS OF THE GOLD POOL
The Bretton Woods System was created by the 1944 Articles of Agreement to design a new international monetary order for the post-war period at a global conference organized at the height of WWII by the U.S. Treasury at the Mount Washington Hotel in Bretton Woods, New Hampshire.Footnote 4 The compromise created an adjustable peg system based on the U.S. dollar convertible into gold at $35 per ounce along with capital controls. The International Monetary Fund (IMF) was established and based on the principle of a credit union, whereby members could withdraw more than their original gold quotas. The institution was meant to provide temporary relief for current account shortfalls.
It took close to 15 years to get the Bretton Woods system fully operational (Bordo Reference Bordo, Michael and Eichengreen1993). In a sense the United States replaced the IMF, whose resources were inadequate to provide global liquidity. The difference between the growth of international reserves required to finance the growth of real output and trade and avoid deflation and the growth of the world’s monetary gold stock was met largely by an increase in official holdings of U.S. dollars resulting from the U.S. balance of payments. By the time full current account convertibility was achieved in 1959, the U.S. dollar was serving the buffer function for which the articles intended the Fund’s resources (Mundell Reference Mundell1969).
Meanwhile, the London gold market—closed in 1939—had reopened in 1954, and the British government gave the restoration of the market high priority in its national policy (Strange Reference Strange and Shonfield1976, p. 71; Harvey Reference Harvey and Bott2013; Schenk 2013). The London gold price—published in dollars in The Financial Times and Wall Street Journal—became a barometer of the credibility of the gold-dollar peg. As a result of the reopening of the market, central banks could now purchase gold in London rather than at the U.S. Treasury. Observers realized that “the London gold market thus functions, in effect, like a dollar market” (Kriz Reference Kriz1959, pp. 7–9). In the Bretton Woods system, the prices of most currencies were fixed to the dollar within a 2 percent band. The price of the dollar was in turn fixed to gold at $35 an ounce. Based on its commitment to the gold peg the U.S. Treasury would be willing to freely buy and sell gold to the monetary authorities of other member countries at the official parity of $35 per ounce. A second way to obtain gold was to purchase it on the largest international gold market in London which offered a fluctuating price of gold. Supply on this market came from gold producers, mainly in South Africa and Russia, as well as sales from central banks and private actors. Demand on the gold market mainly came from central banks, private speculators, and private demand for the industry and arts (jewelry).Footnote 5
In autumn 1960, soon after convertibility was restored in the main countries of the international monetary system, a spike in the London price of gold revealed a lack of confidence in the gold-dollar parity. In order to ensure the stability of the international monetary system, central bank cooperation was called upon to avoid large deviations between the market price of gold and the official gold-dollar parity. It was the first step towards the creation of the Gold Pool.
Central Bank Cooperation Step by Step
The Gold Pool (Gold “consortium,” “club,” or “syndicate” as it was also known to contemporaries) started as a bilateral gentleman’s agreement after the spike in the gold price in October 1960 (Bank of England 1964, p. 18; James Reference James1996, p. 159). The fixing rose as high as $38 an ounce on 25 October, with intraday prices reaching $40 an ounce. This spike was caused by the anticipation of the election of John F. Kennedy, who had promised to run an expansionary fiscal policy. To reduce the dollar price of gold, the Bank of England sold gold in the market on behalf of the U.S. authorities. Subsequently, the Basel group of central banks, meeting regularly at the Bank for International Settlements (Toniolo and Clement Reference Toniolo and Clement2005, p. 363), committed informally not to buy gold in the London market when prices were at or above the shipping parity from New York.Footnote 6 This parity was $35.20 per ounce. At this price it was profitable for central banks to buy gold at the New York Fed and sell it in London for a profit after having paid for transport cost. When turmoil on the London gold price returned in July–August 1961, U.S. officials decided that they alone could not bear the cost of such interventions. In October 1961, Alfred Hayes (President of the New York Fed) proposed a multilateral agreement to allied countries who were regular buyers on the London gold market (United Kingdom, Switzerland, France, and West Germany).Footnote 7 The Bank of England was reluctant to give up its privileged access to the London gold market and share information with other central banks (Toniolo and Clement Reference Toniolo and Clement2005, p. 375), but the U.K. authorities eventually recognized that they could not afford to be left out.Footnote 8 A few months after the October 1960 crisis, the French had been the first to foster the idea of a coordinated central bank intervention scheme to stabilize the price of gold in the spirit of the prewar Tripartite agreement (a 1936 agreement between France, the United Kingdom, and the United States to coordinate currency interventions). Hence the U.S. proposal put forward in October 1961 faced the resistance of the French who were upset because their multilateral proposal had been turned down the year before (Monnet Reference Monnet2013, 2017). Furthermore, the French refused to accept any role for the IMF in the arrangement. The BIS emerged as an alternative.Footnote 9 The BIS Governor, Guillaume Guindey, was instrumental both in convincing the United States to come to the BIS and in convincing his reluctant French peers to accept the American deal. Guindey wrote to the Governor of the Bank of France that cooperation through gold interventions would be a way to increase policy coordination and, thus, would impose more discipline on the United Kingdom and United States who were running balance of payments deficits: “the central banks which, like the Bank of France, behave correctly and rigorously, would benefit from the reinforcement of monetary discipline at the international level.”Footnote 10 However, as emphasized by Eichengreen (2010), nothing in the Gold Pool formally enforced monetary discipline.
In November 1961, Alfred Hayes formally presented the American Gold Pool plan to European central banks at the BIS (Coombs Reference Coombs1976, pp. 62–64). The participating central banks would commit not to buy gold in London, Russia, or South Africa above a fixed price determined by the Gold Pool members. In exchange, they would have access to the surplus gold accumulated by the syndicate. In addition, the New York Fed (which was in charge of selling and purchasing gold for the account of the U.S. Treasury) would stop assessing commission fees on gold transactions with the members of the Pool. The Bank of England was to act as the agent of the Gold Pool, operating on behalf of the syndicate. The Bank of England was not present at the daily fixing at Rothschild’s, but had been intervening in this market since it opened in 1954. The Bank’s dealers therefore had the expertise to conduct such operations. The Bank hosted large gold reserves for other central banks and gold was often traded “loco,” or without leaving its initial location and was simply earmarked with the name of the new owner (Bank of England 1964). The Bank of England started operations for the gold consortium on 6 November 1961. Several days later (18 November), the quotas and the members of the Pool were finally defined. The Gold Pool’s executive arm was the “Gold Experts” who met every two months at the BIS in Basel. The first meeting took place on 9–11 February 1962.Footnote 11
Technically, the Gold Pool was formed as a selling syndicate in 1961, but it also became a gold buying syndicate in February 1962. When the Pool was activated, the Bank of England—as any other member—did not intervene on its own account in the London gold market. The buying (selling) syndicate would buy (sell) gold on the market and offer (demand) it to the participating countries in accordance with their quota. The Bank of England would buy gold to weaken the dollar/gold price (making the dollar price of gold increase) and it would sell gold to strengthen the dollar/gold price (making the dollar price of gold decrease). Purchases of gold were profitable for the Gold Pool members because they occurred at a price below the cost of obtaining gold at the U.S. gold window—including transport costs (see next section). Gold sales (if not offset by subsequent purchases) forced members to replenish reserves of the Pool every month. It implied a decrease in their official gold reserves and a non-negligible financial cost if the dollar price of gold continued to increase. When the gold/dollar price surged, as it did in 1968, the central banks having provided gold to the syndicate lost value. In fine, the Gold Pool was limited by the amounts of gold its members were willing to supply. The prospect of losing gold against dollars was unacceptable to Gold Pool members if they anticipated a continuous increase in the market dollar price of gold, or an official devaluation of the dollar.
Quotas had been fixed in a quite pragmatic manner. First, participating central banks set the amount of gold they agreed to provide to the selling syndicate, and second, the United States doubled the sum to reach 50 percent of the total. In 1962, the same quotas were applied to the buying syndicate. Table 1 shows the initial quotas for each country. The shares stayed the same until the end of the syndicate, but the overall limit of the syndicate increased. The original limit for the Gold Pool gold-selling syndicate was set at $270 million and then increased periodically from September 1966 (see Table 1). These quotas originally represented a tiny share of the members’ gold reserves: 0.8 percent for the United States, Germany, Belgium, and the Netherlands; 0.4 percent for Switzerland; and 1.1 percent for France, Italy, and the United Kingdom. In 1961, the eight members of the Pool held 85 percent of the world’s gold reserves.Footnote 12
RESPECTIVE QUOTA BY MEMBER AND INITIAL SHARE

Sources: Archives of the Bank of France (ABF), 1489200803/60, “Historique sommaire du Gold Pool.”
There had been no clear designed plan at the beginning of the Pool other than the common objective of stabilizing the price of gold. Operations began before all members joined and quotas were defined. At the beginning it was supposed to be temporary (and it was de facto “deactivated” several times in 1962), but it was continuously in operation starting in 1963. Central banks committed not to buy gold freely on the gold market, but they could buy gold at the U.S. Treasury, as France did extensively in 1965 (Bordo, White, and Simard 1995). This behavior was clearly anti cooperative and against the spirit of the Gold Pool, but it did not lead to sanctions. There was no monetary policy discipline or exchange rate rules associated with being a Gold Pool member. Whether domestic policies of central banks and governments—especially U.S. policies—were consistent with the objectives of the Pool was not subject to discussions or requirements by Gold Pool members. Because of this absence of rules and commitment mechanisms, it was not clear how members were going to react to a major surge of the London gold price. Cooperation within the Pool did not involve a change in domestic policy objectives or rules. Central bank cooperation remained mostly technical.
As a technocratic form of cooperation, the Gold Pool was at first a secret arrangement. It was only leaked to the press in March 1962 (first revealed by Le Courrier de Genève). Gold Pool operations, quotas, as well as net losses and profits for each country, remained secret throughout. All members decided to end the Pool on 15 March 1968, after a crisis that we will examine in depth later.
The Gold Pool in Operation
The Gold Pool members agreed on the minimum and maximum gold prices that would automatically trigger constant interventions of the Bank of England, in the name of either the buying or the selling syndicates. The dollar-price of gold accepted by the Gold Pool lay within a band [35.08–35.20] and was not stable within the band over time. Within this range, the Bank of England enjoyed great flexibility in its operations on behalf of the Pool, building on its intimate knowledge of the market (Naef Reference Naef2018).Footnote 13
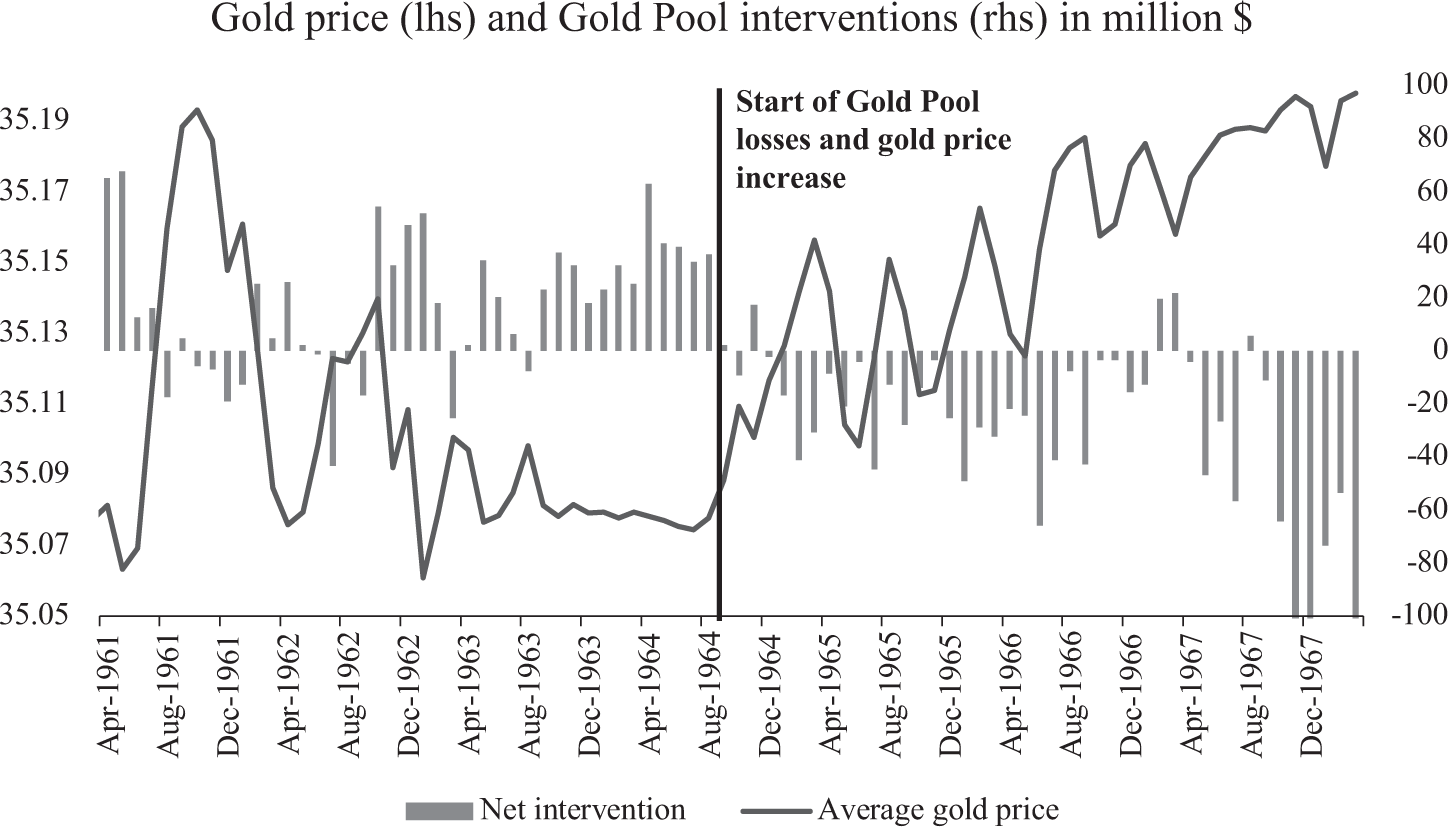
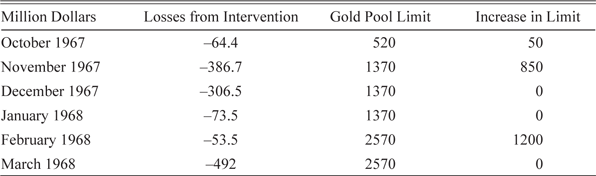
The Pool made profits for a significant period by buying gold at a low price. From February 1962 to the end of 1964, the Gold Pool was almost always in excess (in other words always buying gold as shown by the positive bar charts in Figure 1). From 1962 to 1966, the Gold Pool remained on average a profitable venture for its members.Footnote 14 A detailed chronology of the main events affecting the gold price is available in Bordo, Monnet, and Naef (Reference Bordo, Monnet and Naef2017). After the two successful stabilizations during turmoil on the gold market in 1960 and 1961 (Figure 1), the price stabilized and the implicit target remained around 35.08, the lower bound of the band. The main event affecting the London gold price was the Cuban Missile Crisis (16–28 October 1962). Ironically, Russian sales of gold on the London market—caused by poor Russian harvests and the need to import cereals—were most helpful in pushing the gold price down.Footnote 15 In 1964, however, the gold price came under stress and experienced an upward trend reaching a new plateau closer to $35.20 in mid-1966 and even more markedly in the spring of 1967. Once the upper band was reached, members of the Pool had no choice but to increase the resources of the syndicate, which they did repeatedly until the end of the consortium in March 1968. From its beginning in November 1961 until September 1966, the Pool operated with a limit of resources equal to $270 million. During the last phase of the Pool, the successive limits were then (in millions of U.S. dollars): 320 (September 1966), 370 (May 1967), 420 (June 1967), 470 (July 1967), 520 (October 1967), 1,370 (November 1967), and 2,570 (February 1968). The repeated increase in the Gold Pool’s intervention limit made the system very risky for its members. While the Gold Pool quotas represented less than 1 percent of the members’ gold reserves in 1961, they were equal to 9 percent, on average, of these reserves in 1968.Footnote 16
AVERAGE MONTHLY GOLD PRICES AND NET MONTHLY INTERVENTION

The 1964 Turning Point
It was only by the end of September 1966 that the daily price of gold approached the upper bound of $35.20 on several consecutive days despite interventions by the Bank of England (Figure 1). At that time, the Pool could not let the price increase again. But the troubles of the syndicate had started much earlier. In the fall of 1964, the Pool let the price increase slowly, while mitigating this increase with repeated gold sales. A simple statistical test—following Bai and Perron (Reference Bai and Perron2003)—identifies September 1964 as a key breaking point for the daily price of gold. This turning point is easily seen in Figure 1.
The main political event associated with this gold price reversal is the 1964 sterling crisis. The British election in October 1964 culminating in a Labour victory accentuated instability for sterling (Bordo, MacDonald, and Oliver 2009), but also for global markets. One month before the Labour victory, sterling had hit a three-year low.Footnote 17
The British election was the trigger for several years of sterling in crisis. Both Blackaby (Reference Blackaby1979) and Newton (Reference Newton2009) identified two speculative crises around May–July 1965 and July 1966 (see also Schenk (Reference Schenk2010, chapters 7–8)) before the pre-devaluation crisis that started in the spring of 1967. The British pound’s problems could have created a flight to the dollar. At the same time, however, investors were concerned that the announcements made by Lyndon Johnson during the U.S. election campaign about the launch of the Great Society would worsen the U.S. balance of payments deficit. The fate of the two currencies was clearly intertwined, both in the eyes of investors and politicians. The U.K. and U.S. governments discussed an agreement whereby the United States would support the pound in exchange for a commitment not to devalue (Dumbrell Reference Dumbrell1996; Schenk Reference Schenk2010, pp. 157–59).
The losses of the Pool that began in the fall of 1964 created fundamental disagreements among Gold Pool members on the goals of the syndicate (Toniolo and Clement Reference Toniolo and Clement2005, p. 411). On 4 February 1965, President de Gaulle announced that France would start to systematically convert excess dollar reserves into gold at the New York Fed. French conversion of dollars into gold at the Federal Reserve were concentrated in early 1965 but continued until mid-1966. France, however, remained a member of the Gold Pool during this period. The price was still increasing but at a much more moderate pace than in late 1964 because, at the same time, the Bank of England was also intervening to prevent a more severe rise. The members of the Pool were taking losses. The increase in Gold Pool interventions and an improvement of the U.K. balance of payments at the end of 1966 allowed the price of gold to decrease slightly, but it never went back below its July 1966 level. In the spring of 1967, the Pool started again to experience difficulties, which were associated with two key events. First, the British application to join the European Common Market in May 1967 led many to conclude that the sterling parity needed to be changed before a successful application (Blackaby Reference Blackaby1979, p. 40). Second, the closure of the Suez Canal and the Six-Day War that followed in June 1967 created political uncertainty that was associated with a new increase in the price of gold (Toniolo and Clement Reference Toniolo and Clement2005, p. 413). It is difficult to state whether these events directly undermined the confidence in the U.S. dollar or if their effect on the dollar-price of gold was again mediated by their effect on sterling, as British trade was more immediately affected by the events in the Middle East (Blackaby Reference Blackaby1979). Between 1964 and 1967, the sterling parity was only maintained thanks to international rescue packages (Bordo, MacDonald, and Oliver 2009; Schenk Reference Schenk2010). In the spring of 1967, the Gold Pool had to intervene, but monthly net gold sales were not higher than they were previously. Difficulties still appeared to be temporary and manageable. Yet, on Saturday, 18 November 1967, sterling was devalued by 14 percent from $2.80 to $2.40. Speculation on the gold market increased to unsustainable levels, which triggered unprecedented amounts of interventions by the Gold Pool on the market (see Figure 1).
STERLING DEVALUATION AND THE COLLAPSE OF THE GOLD POOL: A FAILURE OF CENTRAL BANK COOPERATION?
The 1967 Devaluation and the Run on Gold: What We Do and Do Not Know
We are not the first to stress the role of the sterling devaluation as a leading factor explaining the demise of the Gold Pool. Contemporaries clearly refer to the link between the fate of sterling and the fate of the London gold market. Solomon (Reference Solomon1982), Gavin (Reference Gavin2007), and Schenk (Reference Schenk2010) document that from 1961 to 1967, the United States was eager to provide financial and political support to the United Kingdom to avoid a sterling devaluation, which was seen as a menace to confidence in the gold-dollar parity. Gavin (Reference Gavin2007, p. 168) cites a study written by the Federal Reserve in the summer of 1966 that anticipated that a sterling devaluation of 15 percent would produce “serious market uncertainties about the viability of other exchange rates, including those of the dollar.” Coombs (Reference Coombs1976, p. 118) writes that he frequently warned the Federal Open Market Committee (FOMC) of the disastrous consequences of a sterling devaluation. Overall, it is clear that American authorities anticipated that the sterling devaluation would create a shock to the gold-dollar market, although it seems that they were too confident in their ability to handle the situation and underestimated the magnitude of the shock. Following the remarks of contemporaries, Bordo, White, and Simard (1995), Bordo (Reference Bordo, Michael and Eichengreen1993, p. 70), Toniolo and Clement (Reference Toniolo and Clement2005), Schenk (Reference Schenk2010, p. 182), and Eichengreen (2010, p. 57) all noted that the devaluation of sterling undermined confidence in the dollar. These claims, however, have remained unsupported by a quantitative analysis, and its implications for the Gold Pool and central bank cooperation has not been examined. Strange (Reference Strange and Shonfield1976, chapter 3) attributed a higher role to sterling in the troubles of the dollar, much beyond the effects of the sterling devaluation. According to her, the original sin and fundamental cause of the dollar weakness was the role given to sterling and London in the postwar monetary world (p. 71). Moreover, United States assistance to sterling created a strong link between sterling and the dollar: “this dependence of sterling on backing which only the United States could provide, only increased the need of the United States in its turn to seek further measures of multilateral monetary cooperation from European members of the affluent alliance” (p. 89).
The previous literature has left many questions unanswered: Did U.S. gold reserves decrease because of the uncooperative behavior of central banks or because of the interventions of the Pool? Can we identify a regular link between sterling and the dollar price of gold even before the 1967 devaluation? Was sterling the main factor for the fluctuation of the dollar price of gold or did other factors (e.g., U.S. inflation, uncooperative French policies) play a role? Our quantitative analysis will address these three questions in turn.
The Shock to U.S. Gold Reserves: Where Did It Come From?
As shown in Figure 1, the stress created by the sterling devaluation is not visible in the price of gold in late 1967 as it was already reaching the upper band set by the Bank of England, but we observe a sharp and immediate increase in interventions just after the sterling devaluation once the London foreign exchange market reopened on 20 November (Figure 2). Once again using a Bai–Perron autoregressive test, this time on monthly U.S. monetary gold reserves instead of gold prices, a clear break can be found in December 1967, the month following the sterling devaluation.Footnote 18
ILLUSTRATION OF THE BAI-PERRON BREAK IN DECEMBER 1967

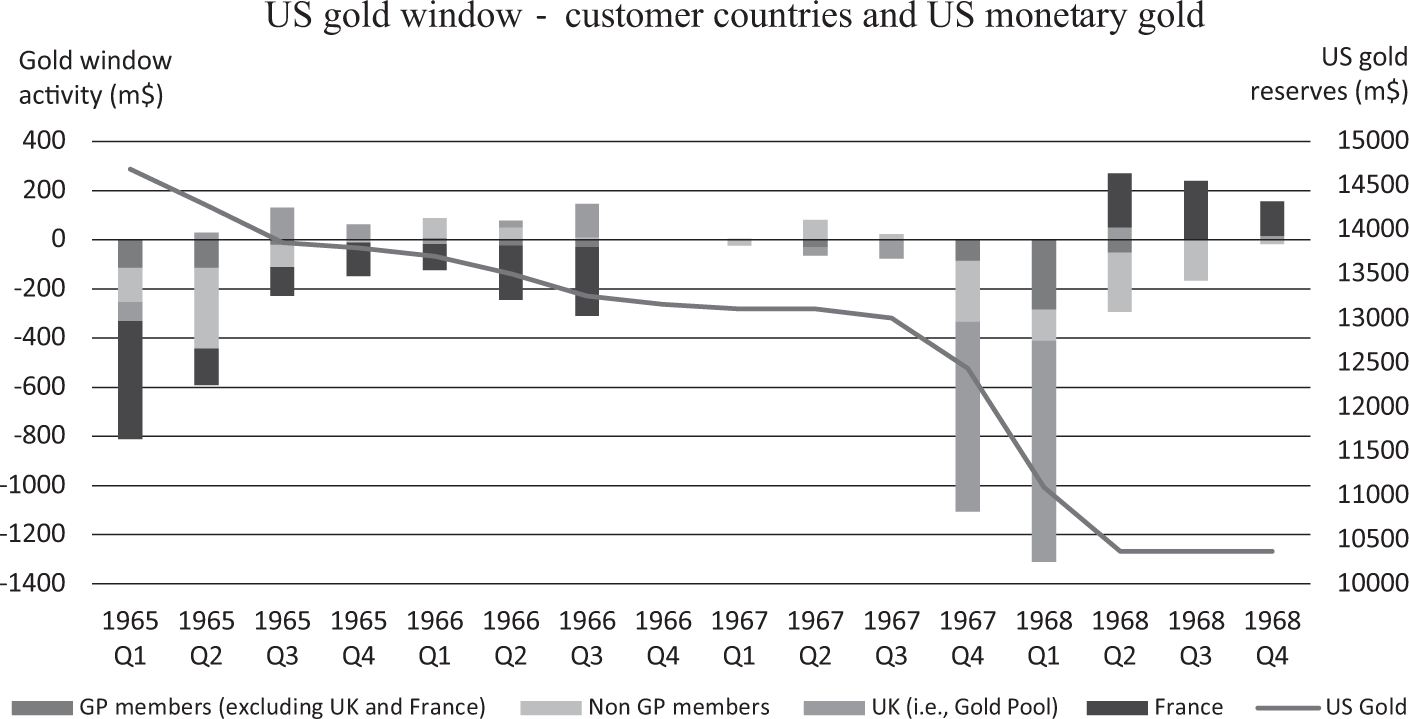
What was the link between the sterling devaluation, the Gold Pool, and the U.S. gold stock? To precisely answer this question, we analyze previously unused data on the identity of buyers at the U.S. gold window. This data was combined from archival sources at the BIS and the Bank of France, but it has yet not been released by the New York Fed. The gold window data along with all the data in this paper are available in the replication file, see Bordo, Monnet, and Naef (2019). Unfortunately, this data only begins in the archives in 1965, likely at a point when the Gold Pool experts began to feel concerned with French withdrawals at the gold window.Footnote 19 The data is instrumental to understanding the collapse of the Gold Pool. Figure 3 shows quarterly data on volumes of gold purchases at the New York Fed gold window. Contrary to the claim by Meltzer (Reference Meltzer1991, p. 63), the data provides evidence that France played no major role in the collapse of the syndicate: By 1967, the country was no longer accumulating dollars to be converted.Footnote 20 After the demise of the Gold Pool in the spring of 1968, France became a net contributor of gold to defend its currency. More generally, Figure 3 clearly shows that there was little pressure on the Fed’s gold window in 1966 and in 1967, before the fourth quarter of 1967.Footnote 21
U.S. GOLD WINDOW CUSTOMER OPERATIONS

Finally, these figures reveal that in Q4 1967 and Q1 1968, the main buyer at the U.S. gold window was the Bank of England which was acting on behalf of the Gold Pool. There was no central bank run on the U.S. gold window. Excluding Gold Pool losses, amounts withdrawn between October and March 1968 were much lower than in early 1965 when France had started to convert dollars into gold. U.S. monetary reserves fell mainly because the Gold Pool had suffered losses while defending the gold-dollar parity on the London gold market.
During the last quarter of 1967, the highest share of gold’s demand besides the Gold Pool came from Algeria. The Bank of Algeria purchased $150 million in gold from the United States, and this purchase was “presumably at French instigation” according to Eichengreen (2010, p. 57, quoting Solomon 1976 and Treasury Papers). However, according to the (unpublished) transcripts of the General Council of the Bank of France, French authorities were not involved in these purchases.Footnote 22 The section “France, a Minor Spoiler?” (infra) will provide a further examination of French behavior.
In January 1968, interventions had decreased because of announcements by the U.S. government to implement policies to reduce the balance of payments deficit using capital controls (Gavin Reference Gavin2007, pp. 177–78). These measures had a short-term effect, allowing the Gold Pool to accumulate gold for nine days in a more positive gold market, but after this short respite, the syndicate was again obliged to intervene. On 31 January, an attack by Vietnamese forces interrupting a ceasefire put new pressure on the London gold market, as it became clear that U.S. military expenditure in 1968 would increase (Gavin Reference Gavin2007, p. 178). The sterling spot and forward exchange rates had been rather stable in January and February, but started to decrease sharply from 20 February. On 28 February, Senator Jacob Javits proposed to suspend U.S. dollar convertibility into gold, increasing pressure on the market (see last section of the article). Table 2 shows the progressive collapse of the Pool with heavy losses starting in November 1967.
GOLD POOL LIMIT AND BANK OF ENGLAND INTERVENTION

Sources: Interventions come from the Bank of England’s dealers reports and the limits come from Archives of the Banque de France (ABF), 1489200803/60, “Historique sommaire du Gold Pool.”
STERLING, THE FIRST LINE OF DEFENSE FOR THE DOLLAR
Sterling and the Gold Price before the 1967 Devaluation
Were sterling and the dollar price of gold already tied before November 1967? We observe in Figure 4 a striking negative correlation between the three-month forward sterling rate and the gold price of the dollar.Footnote 23 The lower the three-month forward sterling rate (or an anticipation of a sterling devaluation), the higher the London gold price (or an anticipation of a dollar devaluation). This becomes more apparent after the election of Labour in the United Kingdom at the end of 1964. Starting in June 1967, the gold price was stabilized near its maximum and reached a ceiling ($35.2; that is, the level at which the Pool intervened, as described previously) while the sterling forward rate kept depreciating.
GOLD FIXING PRICE AT 11am AND LONDON DOLLAR/STERLING THREE-MONTHS FORWARD RATE

Before going further into the empirical analysis, it is useful to make clear why a negative correlation between the two series can be interpreted as evidence of contagion between the two reserve currencies. During Bretton Woods, currencies were all subject to one-way speculation. If a currency was under stress, shorting that currency involved no risk (as it could only be devalued or stay at the existing parity). Since sterling and the dollar were the two most traded currencies at the time, we could expect that rumors of devaluation on sterling would lead to a flight out of sterling into the dollar. This would lead to a positive correlation in Figure 4. By contrast, a negative correlation would mean that investors running out of sterling did not see the dollar as a safe enough currency and that there was contagion from sterling to the dollar.
We test for the negative correlation between the gold price and the sterling forward rate. To do so, we simply regress the daily London price of gold on the forward sterling rate with a one period lag. Using a lag is a way to cope with the fact that the value of the exchange rate is determined at the end of the day whereas the fixing of the gold price takes place in the morning. The estimated equation includes a constant and we correct for auto-correlation using the Huber–White procedure. Over the full sample (from January 1961 to November 1967 or March 1968), the London price of gold is found to be stationary. This is not surprising since the Gold Pool intended to stabilize this price. Hence, it is used in levels in the estimation.
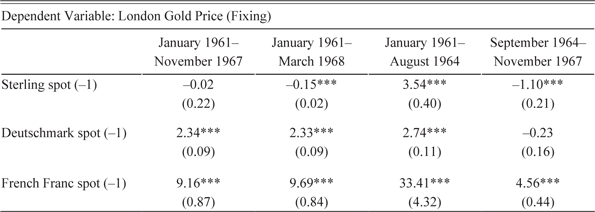
The first estimation sample excludes the 1967 devaluation and stops on 15 November 1967. We find a coefficient of –0.58 which means that when the forward exchange rate depreciates by 1 basis point (which is the standard deviation of the variable), the gold price increases by around 0.6 basis point. The second column of Table 3 shows that the coefficient is smaller when the period December 1967–March 1968 is included. During this period, despite large variations in the sterling exchange rate, the gold price has reached a ceiling and was kept almost constant because of Gold Pool interventions. How did the relationship vary over time? This raises an econometric issue, however, since the price of gold is obviously not stationary over the period of 1964–1966 when, as discussed previously, the Gold Pool allowed a continuous increase until it reached the upper bound of $35.20. The Augmented Dickey–Fuller Unit root test confirms that the series is trend stationary between the October 1964 sterling crisis and the November 1967 sterling devaluation. For this subsample, we account for this linear trend in the estimation. The negative relationship holds and is still significant over 1964–1967, but not over the previous subsample (January 1961 to October 1964).Footnote 24 The period 1961–1963 is not uneventful on the sterling front, but the sterling troubles of 1961 and 1963 remain minor and short lived and, furthermore, the period was filled with international political crises, which did not foster contagion between the dollar and sterling.
RELATIONSHIP BETWEEN THE GOLD PRICE AND THE STERLING FORWARD RATE (DAILY DATA)

Sources: Forward data come from Accominotti et al. (Reference Accominotti, Cen, Chambers and Marsh2019) and gold data from the Dealers’ reports (C8).
The question then arises as to whether this relation is specific only to sterling and the gold-dollar price or if other currencies display the same behavior. As a form of robustness check, we ran the same bivariate regressions with other major currencies. Forward rates were not available to us and we therefore ran the regression using only spot rates for the Deutschemark and French Franc in comparison with sterling.Footnote 25 The results in Table 4 show that both the French Franc and the Deutschmark have a positive relationship with the gold price during the period; both currencies move in the opposite direction of the dollar, appreciating when the dollar depreciates against gold (and the dollar-gold price increases). This means that, unlike sterling, these currencies might be used by investors fleeing to safety. Or at least, they were positively affected by stress on the dollar and the dollar was likely to appreciate when they depreciate (unlike the way that sterling reacted after 1964).
RELATIONSHIP BETWEEN THE GOLD PRICE AND STERLING, DEUTSCHMARK, AND FRENCH FRANC SPOT RATES (DAILY DATA)

Sources: Sterling exchange rate data come from Accominotti et al. (Reference Accominotti, Cen, Chambers and Marsh2019) and French Franc and Deutschmark come from Global Financial Data.
Gold Pool Interventions and U.S. Gold Reserves
The previous analysis of the relationship between sterling and the gold price is necessarily incomplete because the gold price was itself determined by Gold Pool interventions. It was a manipulated price. We therefore directly study the determinants of Gold Pool interventions. Since we also want to consider variables other than the sterling forward rate, we use monthly data and focus on the following potential factors: first, domestic U.S. factors that would damage the credibility of the gold-dollar peg; second, French conversion of dollars into gold starting in 1965 (i.e., anti-cooperative behavior against the Gold Pool); and third, the sterling exchange rate problems having contagious effects on the credibility of the dollar. Monthly data allow us to control for macroeconomic conditions (especially in the United States) while having sufficient degrees of freedom. The dependent variable is the monthly operations performed by the Bank of England for the Gold Pool on the London gold market. It takes negative values when the Gold Pool is in deficit (selling gold and buying dollars). U.S. factors likely to affect the credibility of the dollar are proxied by the U.S. inflation rate, the growth rate of U.S. gold reserves, and the change in the U.S. government deficit. Since the latter variable is only available at a quarterly frequency, we interpolate the series with a quadratic trend.Footnote 26 At a monthly frequency, the change in U.S. gold reserves is the best proxy for the state of the U.S. balance of payments. The pressure of operations by the French central bank on the U.S. gold stock is measured by the growth rate of French gold reserves.Footnote 27 Consistent with the rules of the Gold Pool, French authorities only bought gold at the U.S. gold window and not on private markets. We have checked that the quarterly changes of French reserves match withdrawals at the U.S. gold window for the period we have data for both series (1965–1968). U.K. exchange rate turmoil is proxied by the three-month forward rate of the $/£ exchange rate, as in the previous section.
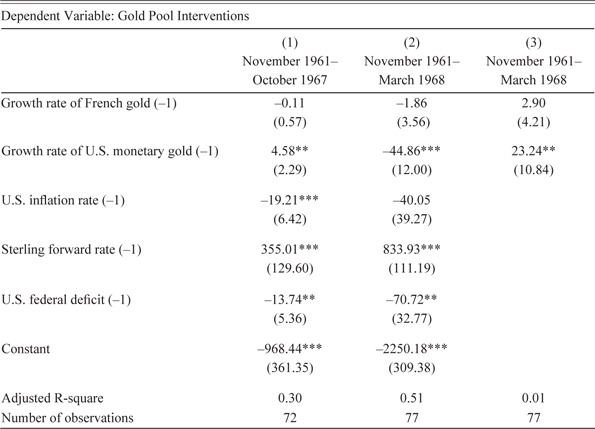
Since interventions of the Gold Pool directly and contemporaneously affect the growth rate of French and U.S. reserves, all explanatory variables are used with a lag in the estimations. To avoid the problem that all our results are driven by the sterling devaluation of November 1967, we ran estimations on two different samples. A first sample (November 1961 to October 1967) does not include the devaluation, and a full sample includes it (November 1961 to March 1968). Raw data of Gold Pool interventions are used in the estimations since they are not seasonal and the series does not have a unit root. For the samples we are looking at, we do not find a significant effect of French operations on Gold Pool interventions. This does not mean that they did not matter during some periods, but they cannot be viewed as a regular major factor. This is even true when not accounting for sterling as done in Table 5, Column (3). On the contrary, the sterling forward rate has a strong effect on Gold Pool operations. The effect is much stronger when the sample included the devaluation, but is nevertheless important before the devaluation (comparing Columns (1) and (2) in Table 5).
DETERMINANTS OF GOLD POOL INTERVENTIONS (MONTHLY DATA)

Sources: French gold are from the IMF International Financial Statistics, U.S. monetary gold, inflation, and deficit are from FRED, and the sterling forward data come from Accominotti et al. (Reference Accominotti, Cen, Chambers and Marsh2019). See additional details in text.
U.S. factors also played a significant role. When the U.S. inflation, deficits or U.S. monetary gold losses increase, the Gold Pool deficit increases (the Gold Pool is forced to sell more gold). The effect of the U.S. budget deficits is five times stronger when the period November 1967–March 1968 is included in the sample, which corroborates the argument that, besides depreciating sterling, U.S. domestic policy (and especially the failed stabilization plan of January 1968, see Solomon (Reference Solomon1982, p. 117) and Gavin (Reference Gavin2007, pp. 177–80)) was also key to explaining the U.S. decision to close the Gold Pool in early 1968.
The path of U.S. gold stocks also influences interventions, with the expected sign before the devaluation of sterling (when the gold stock decreases—meaning the balance of payments deficit increases—the Pool has to intervene more). But the sign of the coefficient is reversed after the devaluation of sterling (conditional on the value of the other variables; see Columns (2) and (3)). This means that it is mostly because of the sterling devaluation and the U.S. inflation rate and deficit that the Gold Pool interventions increased from November 1967 to March 1968, rather than because of an independent effect of the growth of the U.S. gold stock. This result is in line with our previous finding that has stressed that the U.S. gold stock decreased mainly because of Gold Pool losses during this period.Footnote 28
The sterling devaluation was a trigger and led to unprecedented interventions, but the main factors influencing Gold Pool interventions were already in place long before. However, the effect of the sterling devaluation of the gold market and Gold Pool interventions could not be anticipated based on the relationship observed in the previous years: The coefficient on the sterling forward rate are much smaller in Column (1) than in Column (2). It may explain why—despite acknowledging the risk to the gold price (cf. supra)—U.S. authorities did not anticipate that the sterling devaluation would lead to unbearable losses and the end of the Gold Pool. Both the fluctuations of the dollar-sterling exchange rate and the evolution of U.S. macroeconomic variables affected the magnitude of Gold Pool interventions. We have checked that these variables were not collinear; U.S. inflation and deficit were not a cause of the fluctuations of sterling.
Unequal Reserve Currencies
The crisis and the devaluation of the pound sterling, the second reserve currency, could be expected to lead investors to convert sterling into dollars, causing an appreciation of the dollar. What happened was the opposite. Investors rushed to gold and the Gold Pool had to intervene to maintain the gold-dollar parity. However, this contagion between the two reserve currencies should not lead us to conclude that the two currencies played an equal role in the international monetary system and that they were equal in the eyes of investors.
Our results show that the relationship between the pound sterling and the dollar was unique (Table 4), but that it was also unidirectional (we have no evidence that a depreciation of the dollar was more damaging to the pound sterling than to other currencies). We identify three reasons for the particular—but still unequal—relationship between sterling and the dollar. First, the pound was for decades the key reserve currency and remained important in the 1950s and 1960s, mainly because of holdings by the sterling area. A devaluation of sterling meant that the devaluation of a main reserve currency was possible and the dollar could be next. Second, the United States and the United Kingdom had been running balance of payments deficits since 1960 and, unlike other European countries where monetary policy had been used restrictively to resolve imbalances (Monnet 2018, chapters 4 and 7), the American and British governments had been reluctant to take drastic measures to contain inflationary pressures (Solomon Reference Solomon1982; Schenk Reference Schenk2010). In the opinion of international investors and foreign authorities, the two countries were in the same boat and were accused of using the privilege of the reserve currency to avoid the necessary adjustments. Third, the United States had led international initiatives to provide financial support for the pound sterling. As Strange (Reference Strange and Shonfield1976) argued, the United States exposed itself and increased the perception that a British pound crisis would be financially costly for the United States.
In this context, the perception of the credibility of the dollar has become increasingly linked to the credibility of the pound sterling. But this process was not deterministic and it is easy to think of different counterfactual outcomes. If the United Kingdom had devalued earlier and the United States had undertaken policies to resolve balance of payments deficits, the devaluation of sterling in 1967 could have had a negligible effect on the dollar price of gold. Our econometric estimates presented in Table 5 clearly show that the fluctuation in the exchange rate of sterling cannot be considered as the sole cause of the Gold Pool’s interventions to defend the gold-dollar parity. As expected, U.S. domestic variables played a key role. As Despres, Kindleberger, and Salant (1966) pointed out—against Triffin (Reference Triffin1961)—the fixed supply of gold was not in theory a problem for the credibility of the dollar and its role as a reserve currency, as long as investors and foreign monetary authorities needed dollars and considered U.S. monetary policy sufficiently credible (Bordo 2017; Farhi and Maggiori 2018; Bordo and McCauley 2017). The illusion of American and British policymakers in the 1960s was to rely on the cooperation of central banks to buy time, rather than implementing policies to adjust their balance of payments deficits and restore the credibility of their currencies. Instead, cooperation increased the perceived links between the two currencies and the likelihood of contagion. In this regard, it is significant that international discussions on financial assistance for the pound sterling at the BIS and among the G10 countries were conducted in a separate forum from those on the role of the dollar and the Gold Pool (Schenk Reference Schenk2010, p. 205). Cooperation between central banks was developed while separately conducting the discussions on the sources of international imbalances.
France, a Minor Spoiler?
Our econometric investigation concludes that the French conversion of dollars into gold had a quite minor effect on the market dollar price of gold and Gold Pool operations.Footnote 29 This conclusion may seem surprising given that French policy has often been portrayed as a key factor undermining the confidence in the dollar during this period (Coombs Reference Coombs1976; Bordo, White, and Simard 1995; Gavin Reference Gavin2007). Meltzer (Reference Meltzer1991, p. 63) even argues that France was the main gold buyer and presents 1967 as the peak year for French gold accumulation. The French themselves were eager to claim that their behavior was powerful enough to shape the destiny of the international monetary system (Monnet 2017).
So, has France’s power been exaggerated? On the day of the aggressive speech by President de Gaulle against the dollar, the dealers at the Bank of England were unimpressed at best: “The statement on the gold exchange standard by General de Gaulle did not create any fresh activity in the gold market.” So were the subsequent days.Footnote 30 While the speech was followed by one month of general gold price increases (not unusual after September 1964), interventions during this time did not seem to show that the Bank of England was in distress. February 1965 does not stand as a clear break in Gold Pool interventions: The net losses of the Pool were $18.2 million during the three months before and $19.2 million during the three months after de Gaulle’s speech.
In 1967, the Banque de France was no longer demanding gold at the U.S. window, but it suspended its participation in the syndicate during the summer of 1967. This behavior by the French authorities had minor consequences for the functioning of the Pool. France de facto left the Gold Pool in June 1967 because it disagreed with the decision to increase the resources of the Pool, but the French decision to cease participation remained secret until it was revealed by a leak in the press in November 1967, three days after the devaluation of sterling.
A confidential note written at the international directorate of the Banque de France on 8 June 1967 clearly laid down the reasons why France decided to stop participating in the Pool without formally leaving it.Footnote 31 At that time, the losses of the syndicate were not seen as a major concern since they were moderate in comparison to the previous surpluses. According to this note, the main reason for leaving the syndicate was to “no longer support without limit a monetary system that works in a way that we consider unsatisfactory.” Yet, it was recommended not to formally and publicly leave the Pool, but instead to suspend participation if the limit of resources was increased again. Leaving the Pool “would not have been a surprise” to other participants “given the usual reserved attitude” of France toward the Pool, but it would have been an overly strong attack against political cooperation with the Western allies.
Exactly following this recommendation, the Banque de France suspended its participation in the Pool—but did not formally exit—on 11 June at the 31st meeting of the gold experts, when it was decided to increase the limits of the resources of the Pool from 370 to 420 million USD.Footnote 32 By the end of November 1967, given the large and immediate losses that had followed the sterling devaluation, it became clear to other members that France would never contribute again. Meanwhile, although France had suspended its participation in the Pool, the Banque de France did not convert dollars into gold and continued to participate in international cooperation and financial plans to support sterling, such as the (insufficient) one implemented by the G10 on 15 November, a few days before the sterling devaluation.Footnote 33
U.S. Inflation Issues and the Failure of Early 1968 Measures to Restore the Credibility of the Dollar
As our previous estimations have shown, the fate of sterling is not the only factor leading to a lack of confidence in the gold-dollar peg. During the last months of the Pool, it became clear that only a radical shift in U.S. monetary and fiscal policies could have restored confidence in the dollar. A key force undermining confidence in the dollar was the rise in inflation in the United States, beginning in 1965.Footnote 34 Until that year the Federal Reserve Chairman William McChesney Martin had managed to keep inflation low. The Fed also worried about the balance of payments and the stock of U.S. monetary gold in its policy deliberations (Bordo and Eichengreen 2013). Beginning in 1965 the Fed under Chairman Martin shifted to an inflationary policy (Bordo 2017). The U.S. inflation rate was not higher than those in other G10 countries but, as emphasized by Eichengreen (Reference Eichengreen2008, p. 129), economic growth in Europe and Japan was higher, so U.S. inflation should have been lower to avoid increasing the balance of payments deficit. Furthermore, rising U.S. inflation then spread to the rest of the world through growing U.S. balance of payments deficits. This led to growing balance of payments surpluses and inflationary pressures in Germany and other countries (Darby et al. Reference Darby, James, Anna and Alan1983).
Following the devaluation of sterling, European partners of the Gold Pool started to doubt the viability of the scheme, but they were brought together again in a joint statement pledging to support the gold price on 26 November (Schenk Reference Schenk2010, p. 182). American officials proposed a new gold certificate program (Gavin Reference Gavin2007, p. 172). Under this new scheme, Gold Pool members would receive a gold certificate compensating them for their losses with the gold syndicate. However, this paper gold was not welcomed by Europeans. On 28 February 1968 Senator Jacob Javits called for a cessation of Gold Pool activities which only increased the pressure on the Pool (Coombs Reference Coombs1976, p. 165; Solomon Reference Solomon1982, p. 117). A few days before closing the market, Walt Rostow, in a memo to President Johnson, wrote that one of the reasons to close the gold market was to “avoid losing perhaps $1 billion in gold tomorrow (we lost $372 million today [March 14th]).” In the same memo, he stressed that closing the market could “reduce the US bargaining position with the Europeans.”Footnote 35
On 14 March, Johnson asked Treasury Secretary Henry Fowler to contact the British Chancellor of the Exchequer Roy Jenkins to suggest closing the gold market (Roy Reference Roy2002, p. 52). Jenkins welcomed the news to divert the focus from sterling, which again was in crisis, to gold (Hamilton Reference Hamilton2008, p. 89). He took the opportunity to declare a bank holiday and close the foreign exchange market at the same time, making it look like an American initiative to give sterling some breathing space. On 15 March 1968, the Gold Pool was disbanded and a two-tier arrangement was put in its place. In the press release, the United States committed to using all of its gold reserves to defend the $35 parity (the Senate had just approved removing the gold cover, which had limited U.S. commitment; the House would follow a few days later). The counterpart of the deal was that European countries would commit to looser monetary policies to minimize capital flight from the United States (Coombs Reference Coombs1976, p. 171). As emphasized by Toniolo and Clement (Reference Toniolo and Clement2005, pp. 422–23), European central banks were glad to abandon the Gold Pool in March 1968 since the scheme had proved to be costly in the preceding months. Furthermore, the option of the two-tier market had been proposed as an alternative by the Italian and Belgian governors as early as December 1967.The monetary authorities of the Gold Pool agreed neither to sell nor to buy gold from the market and would transact amongst themselves at the official $35 price. As a consequence, the link between the international gold market and official reserves was cut.
CONCLUSION
The impact of the devaluation of the pound was not visible in the price of gold in 1967 since it was stabilized around an upper bound thanks to large Gold Pool interventions. This article was able to examine this impact on Gold Pool interventions and on central banks’ demand at the U.S. gold window, thanks to unique archival data. Contagion between the sterling dollar exchange rate and the dollar price of gold culminated after the November 1967 devaluation, but had started much earlier and continued until the end of the Gold Pool in March 1968.
This article also clarifies the position of France in the Bretton Woods system. Bordo, White, and Simard (1995) as well as Monnet (Reference Monnet2013, 2017) have shown how France behaved opportunistically in the mid-1960s to benefit from Anglo-American weaknesses. French authorities liked to view themselves as a major power and troublemakers against U.S. hegemony, while, for the United States, France was a useful culprit. Evidence in this article shows that the effects of France’s actions on the gold market and the Bretton Woods system were minor at best. The strong link between sterling and the London gold market appears to be a much more salient feature for the period of 1964–1967. There is much evidence to argue, like Strange (Reference Strange and Shonfield1976), that U.S. support for sterling in the 1960s as well as the international role of the London gold market, increased the exposure of the dollar to a sterling crisis. However, we should not neglect that, as our estimations have shown, the dollar price of gold was strongly influenced by domestic macroeconomic U.S. variables. Moreover, the last months of the Pool clearly show that—while the sterling crisis had been a trigger for speculation and was ongoing—only a change in U.S. domestic policies could have calmed the market. These results are in line with Bordo and Eichengreen (2013) and other authors who have emphasized that U.S. domestic policies bear a key responsibility for the lack of confidence in the dollar in the 1960s. Contrary to Strange’s (Reference Strange and Shonfield1976) suggestion, the key role of sterling identified in this article does not imply that the Bretton Woods system could have survived if sterling and London had given up their international role.
Our findings have broader implications for central bank cooperation. Whereas theoretical models define central bank cooperation as the coordination of macroeconomic policy (see Engel (Reference Engel2016) for a survey), we do not know of historical examples of full macroeconomic policy coordination (besides monetary unions). Instead, central banks have frequently implemented cooperation through technical financial arrangements (e.g., swaps, loans, composite reserve currencies, etc.) in order to mitigate the effects of financial crises or to maintain the stability of fixed exchange rates (see Bordo and Schenk (Reference Bordo, Schenk, Michael and John2017) for a survey). Cooperation in the Gold Pool remained technical rather than political and no effort was made to correct imbalances.
It is undeniable that, contrary to the interwar period, central banks agreed to cooperate during Bretton Woods: They granted credit to each other and pooled their interventions. But technical and financial cooperation had clear limits. U.S. monetary policies beginning in 1965 by accommodating expansionary fiscal policy to finance the Vietnam War and the Great Society led to inflation which was not ameliorated in part because of political pressure against tight monetary policies and in part because the monetary authorities underestimated the natural rate of unemployment (Romer and Romer 2002), in the context of lower productivity gains and GDP growth in the United States compared to other advanced economies (Eichengreen Reference Eichengreen2008). This undermined the credibility of the gold-dollar parity, and the U.S. supported measures to delay the adjustment of the sterling exchange rate. Europeans neither committed to implement policies to counter the inflows of U.S. dollars nor to run domestic policies or adjust their peg in order to avoid speculation against their currencies. In these circumstances, the contagion from the 1967 sterling devaluation to the U.S. gold-dollar parity turned out to be a fatal blow. The Gold Pool first absorbed the shock but the cost proved to be too high and central bank cooperation was deemed insufficient. Missing coordination of domestic policies or rule-based domestic policies, the interventions of the Gold Pool were not able to stop contagion between the two main reserve currencies. The possibility of contagion between the leading currencies is quite absent from the literature on multipolar international monetary systems (Eichengreen 2012; Farhi and Maggiori 2018). The story of the Gold Pool highlights that such contagion can occur and may even be more likely when the two reserve countries are tied by cooperative agreements.