INTRODUCTION
Gillnets are commonly used for catching demersal and pelagic fish in the shelf seas and inland waters of Turkey. Whiting Merlangius merlangus euxinus (Nordmann, 1840) is a demersal species that, in the Black Sea Basin, is caught mainly by trawl, with catches peaking during autumn and winter. In the eastern Black Sea, where bottom trawling is prohibited, gill and trammel nets are used by artisanal fishermen. Whiting is one of the most valuable demersal fish species for Black Sea fisheries. The total production of whiting in Turkey in 2010 was 13,558 tonnes, of which 11,894 tonnes (87.7%) was landed from the Black Sea. This species is the fifth most abundant species, contributing 3.4% of the total Turkish marine landings, and is the most abundant species among the catch of demersal fishes of Turkey (TUIK, 2011).
Gillnets consist of a single wall of netting and have a high selectivity for particular sizes of fish, tending to capture mostly large but also individuals smaller than optimum length (Hamley, Reference Hamley1975). In addition, these fishing gears can allow a more size-selective exploitation pattern than some other gears. Fish are caught in gillnets in four ways: (a) gilled: holding by the mesh slipping behind the opercula; (b) snagged: the mesh is around the fish just behind the eye; (c) wedged: holding by the mesh around the body; and (d) entangled: holding by teeth, spines or other protrusions, without necessarily entering the net (Sparre & Venema, Reference Sparre and Venema1998; Fabi, et al., Reference Fabi, Sbrana, Biagi, Grati, Leonori and Sartor2002). Knowledge about the size selectivity of gillnets is very important to understand their effects on aquatic systems for improving their selection properties and also for fisheries management to ensure sustainability of fisheries (Millar & Holst, Reference Millar and Holst1997).
There have been many selectivity studies performed on gillnets throughout the world (e.g. Grégoire & Lefebvre, Reference Gregoire and Lefebvre2003; Fonseca et al., Reference Fonseca, Martins, Campos and Sobral2005; Fabi & Grati, Reference Fabi and Grati2008; Santos & Lino, Reference Santos and Lino2010). In Turkish waters selectivity studies are mainly related to gillnet (e.g. Özekinci, Reference Özekinci2005; Aydın & Düzgüneş, Reference Aydın and Düzgüneş2007; Karakulak & Erk., Reference Karakulak and Erk2008; Ayaz et al., Reference Ayaz, Altınagaç, Özekinci, Özen, Altın and Işmen2011). However, gillnet selectivity studies in the Black Sea are limited to a few species such as red mullet (Mullus barbatus) (Genç, Reference Genç2000; Dinçer & Bahar, Reference Dinçer and Bahar2008) and whiting (Aydın, Reference Aydın1997; Genç et al., Reference Genç, Mutlu, Zengin, Aydın, Zengin and Tabak2002). The present study is the first one using the SELECT method applied to whiting to estimate the selectivity parameters of gillnets with 16, 17, 18, 20 and 22 mm mesh size that are commonly used to catch whiting by fishermen in the region. The selectivity estimation of whiting gillnets will be give us good information on the management of their stock.
MATERIALS AND METHODS
Study area and gears
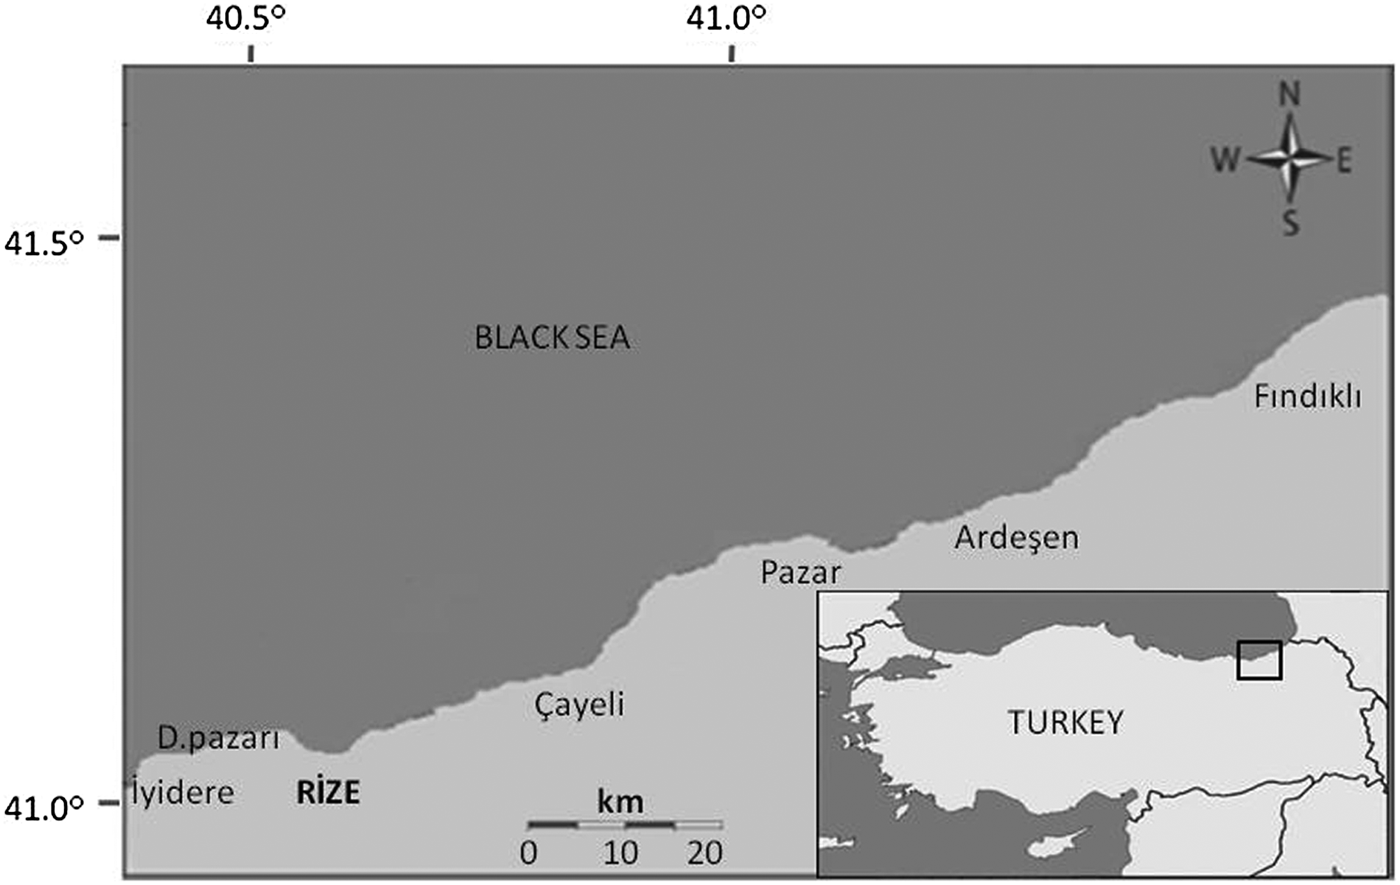
The study was conducted between June 2010 and June 2011 on the eastern Black Sea coast, Turkey. A total of thirteen fishing trials were carried out in the period of experimental fishing in the region (Figure 1). The bottom structures of the fishing grounds were rocky, sandy, muddy and the depths varied from 35 to 95 m. Operational plans relating to fishing grounds for the trials were based on the prior experience of fishermen in the region. Experimental fishing trials were undertaken on the RV ‘Rizesuar’ (12 m long with an engine power of 140 hp) and also the gillnetter ‘Beytul’ (6 m long with an engine power of 28 hp).
Map of the study area.

The experimental gillnets were composed of five different mesh sizes (16, 17, 18, 20 and 22 mm, bar length). The nets were constructed with the same design and characteristics as those used by local fishermen. The nets were equipped with PP Ø4 floatline with PL Ø4 floats (2.2 cm height; 11.68 g weight) and PP Ø6 leadline with 40 g lead sinkers. The nets consisted of PA multifilament webbing made of 210 D/2 and 50 meshes depth with a hanging ratio of 0.64. The gillnet had a total length of 635 m and was obtained using one sheet of each mesh size (each 127 m long). In each trial, five sheets were randomly tied to each other. The nets were set with an anchor and buoy attached to each end.
Experimental procedures
The nets tied to each other were deployed a few hours before sunset and hauled at sunrise. After each fishing operation, all species with or without economic value were taken from the nets and sorted by mesh size. The total length (TL, mm) and total weight (TW 0.1 g) were recorded for all fish.
Selectivity experiments
Gillnet selectivity can be calculated by using different estimation methods. When the size distribution of the fished population is known direct estimation methods are used. But obtaining the knowledge about the size distribution of the fished population is difficult. On the other hand, indirect estimation does not require such knowledge; hence, gillnet selectivity trials are generally carried out by simultaneous fishing with several gillnets having different mesh sizes (Hamley, Reference Hamley1975; Millar, Reference Millar1992; Millar & Holst, Reference Millar and Holst1997; Hovgard & Lassen, Reference Hovgard and Lassen2000). In this study an indirect estimation method, Share Each Length's Catch Total (SELECT) was used, applied on the GILLNET software (Constat, 1998).
The SELECT method is expressed as follows:
 $$n_{lj}=Pois \lpar p_{\,j} \lambda_{l} r_{\,j} \lpar l\rpar \rpar$$
where n lj is the number of length l fish caught in mesh size j, Poisson's distribution is (l) λl rj, p j(l) is the relative fishing intensity of length l fish in the j'th gear, λ l is the abundance of length l fish contacting the combined gear and r j(l) is the retention probability of length l fish in the j'th gear.
The log-likelihood function of n lj, is
 $$\Sigma_{l} \Sigma_{\,j} \lcub n_{l} \log_e \lsqb p_{\,j} \lambda_{l} r_{\,j} \lpar l\rpar \rsqb - p_{\,j} \lambda_{l} r_{\,j} \lpar l\rpar \rcub$$
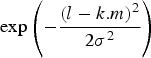
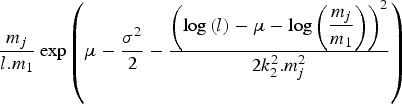
The gillnet data obtained from experimental fishing trials were evaluated in five different models (normal location, normal scale, log-normal, gamma and bi-modal) (Millar, Reference Millar1992; Millar and Holst, Reference Millar and Holst1997; Constat, 1998) by using GILLNET software, and the selectivity curves and parameters were estimated.
Normal location:
 $$\exp\left({ - \displaystyle{{\left({l - k.m} \right)^2 } \over {2\sigma ^2 }}} \right)$$
Normal scale:
 $$\exp\left({ - \displaystyle{{\left({l - k_1 .m_j } \right)^2 } \over {2k_2^2 .m_j^2 }}} \right)$$
Log-normal:
 $$\displaystyle{{m_j } \over {l.m_1 }}\exp \left({\mu - \displaystyle{{\sigma ^2 } \over 2} - \displaystyle{{\left({\log \left(l \right)- \mu - \log \left({\displaystyle{{m_j } \over {m_1 }}} \right)} \right)^2 } \over {2k_2^2 .m_j^2 }}} \right)$$
Gamma:
 $$\left({\displaystyle{l \over {\left({\alpha - 1} \right).k.m_j }}} \right)^{\alpha - 1} \exp \left({\alpha - 1 - \displaystyle{l \over {k.m_j }}} \right)$$
Bi-normal:
 $$\exp\left({ - \displaystyle{{\left({l - k_1 .m_j } \right)^2 } \over {2k_2^2 .m_j^2 }}} \right)+ c.\exp \left({ - \displaystyle{{\left({l - k_3 .m_j } \right)^2 } \over {2k_4^2 .m_j^2 }}} \right)$$
These models observe the ‘principle of geometric similarity’ (Baranov, Reference Baranov1948), with the exception of the ‘normal location’. This principle states that since all meshes are geometrically similar and all fish of the same species (within a reasonable size range) are also geometrically similar, the selectivity curves for different mesh sizes must be similar (Fabi & Grati, Reference Fabi and Grati2008).
This software is based on the SELECT method which has a selectivity curve and parameter estimating procedure by comparison of the number of fish caught by different mesh sizes. The underlying methodology is described by Millar & Holst (Reference Millar and Holst1997). This method is a special case of the SELECT model described by Millar (Reference Millar1992). The parameters for each model were fitted twice under the assumption of both equal and proportional fishing power to mesh size. When assessing the most appropriate model the smallest deviance is taken into account in five different models. Generally, the deviance and the degrees of freedom should be close to each other. A high deviance may show that the chosen model is not appropriate for the data set (Holst et al., Reference Holst, Madsen, Fonseca, Moth-Poulsen and Campos1998; Park et al., Reference Park, Millar, Bae and An2011). Then, for evaluating the goodness of fit estimation of the final model, the plot of model deviance residuals was used (Millar & Holst, Reference Millar and Holst1997).
RESULTS
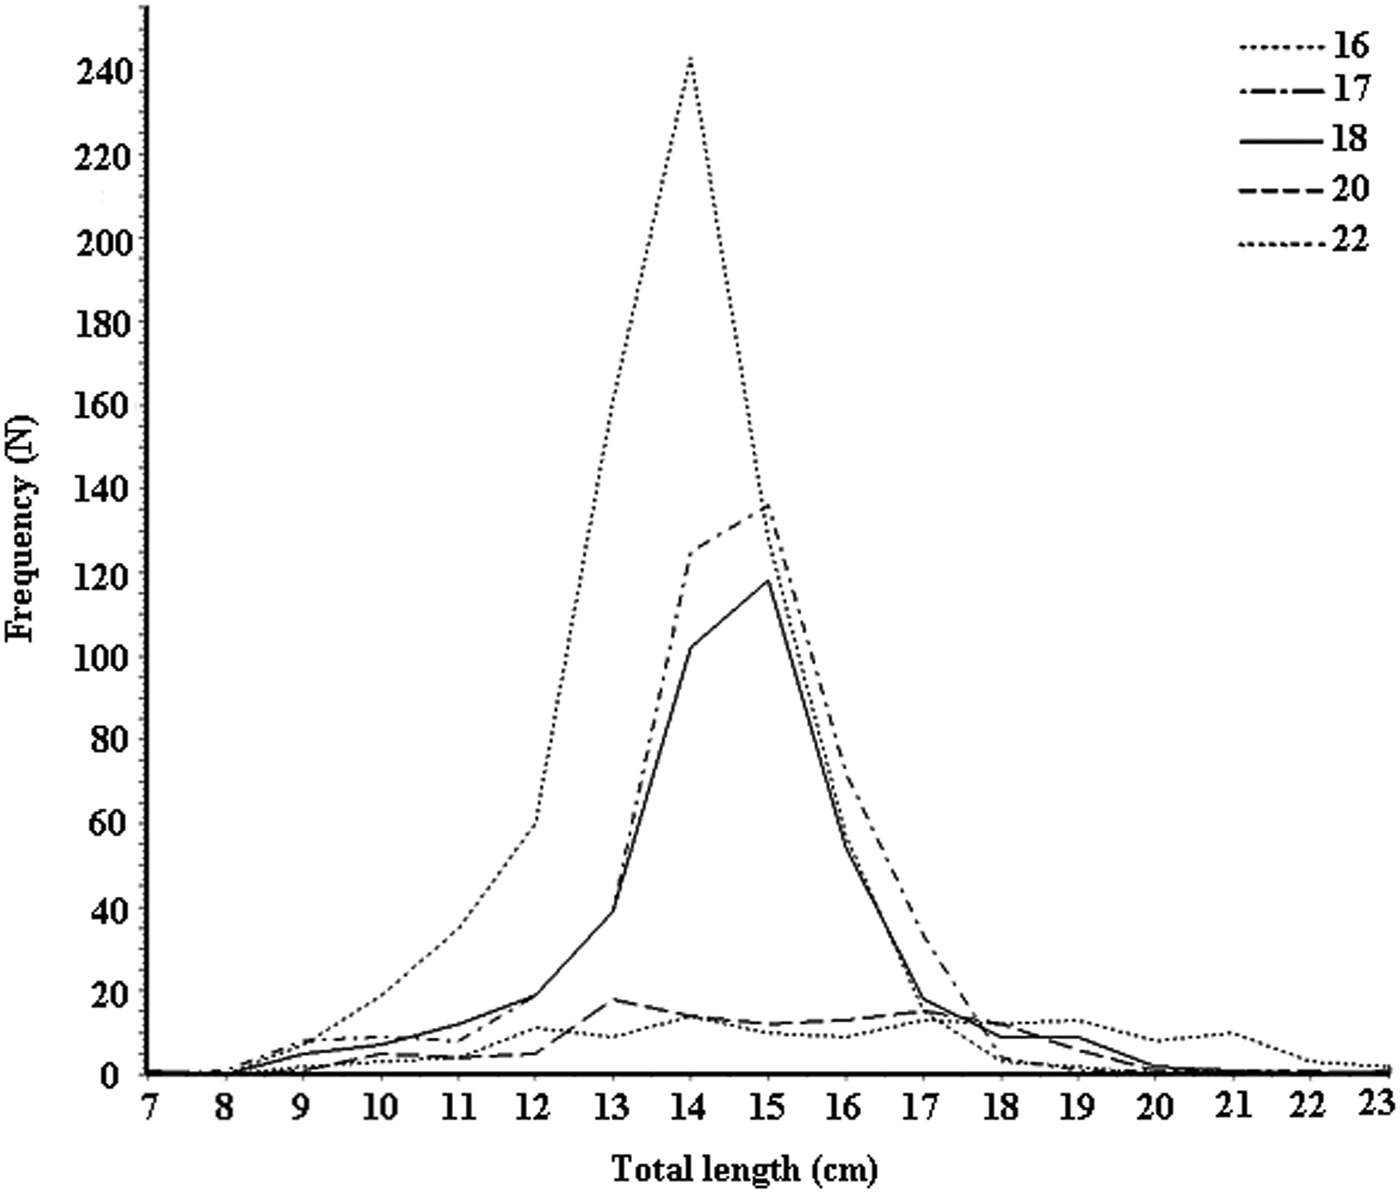
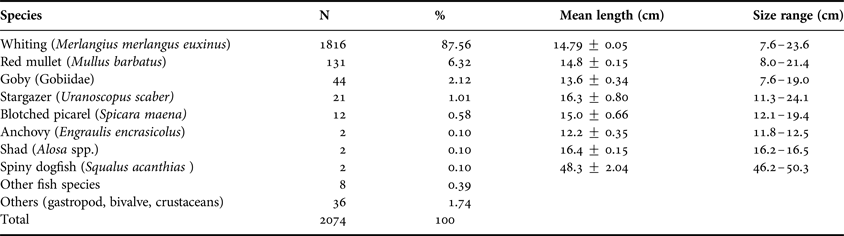
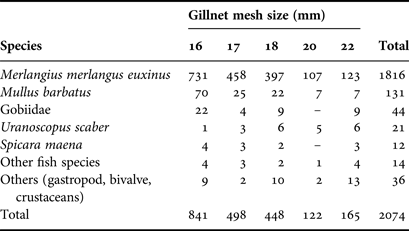
During the study, a total of 2038 fish and 36 macro-invertebrates belonging to 16 and 3 taxa, respectively, were captured with the experimental gillnets (Table 1). The target species, whiting, was the most abundant species, accounting for 87.6% (N = 1816) of the total catch. Red mullet (N = 131; 6.3%), gobies (N = 44; 2.1%) and stargazer (N = 21; 1.0%) were the other taxa that contributed most to the total (Table 1). The numbers of dominant species caught by the different gillnet mesh sizes used in this study are shown in Table 2. With the exception of the 22 mm mesh size, a decline in the number of individuals of whiting and the overall catch with increasing mesh size was observed. The catch size frequency distributions with the five gillnet mesh sizes for whiting is given in Figure 2.
Size–frequency distributions of the whiting caught with gillnets of different mesh sizes.
Catches in number (N), their size ranges (cm), percentage and mean length (cm) of species caught by gillnet.
Catches (N) of dominant species caught by mesh sizes (bar length).
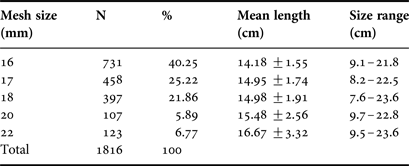
A total of 731, 458, 397, 107 and 123 specimens of whiting were caught with 16, 17, 18, 20 and 22 mm mesh sizes, respectively (Table 2). The whiting caught ranged from 7.6 to 23.6 cm LT, with most fish between 13 and 16 cm. The mean lengths for whiting corresponding to 16, 17, 18, 20 and 22 mm mesh sizes were 14.18, 14.95, 14.98, 15.48 and 16.67 cm, respectively (Table 3).
The total number (N), percentages, size ranges and mean length (cm) of whiting catches by mesh size.
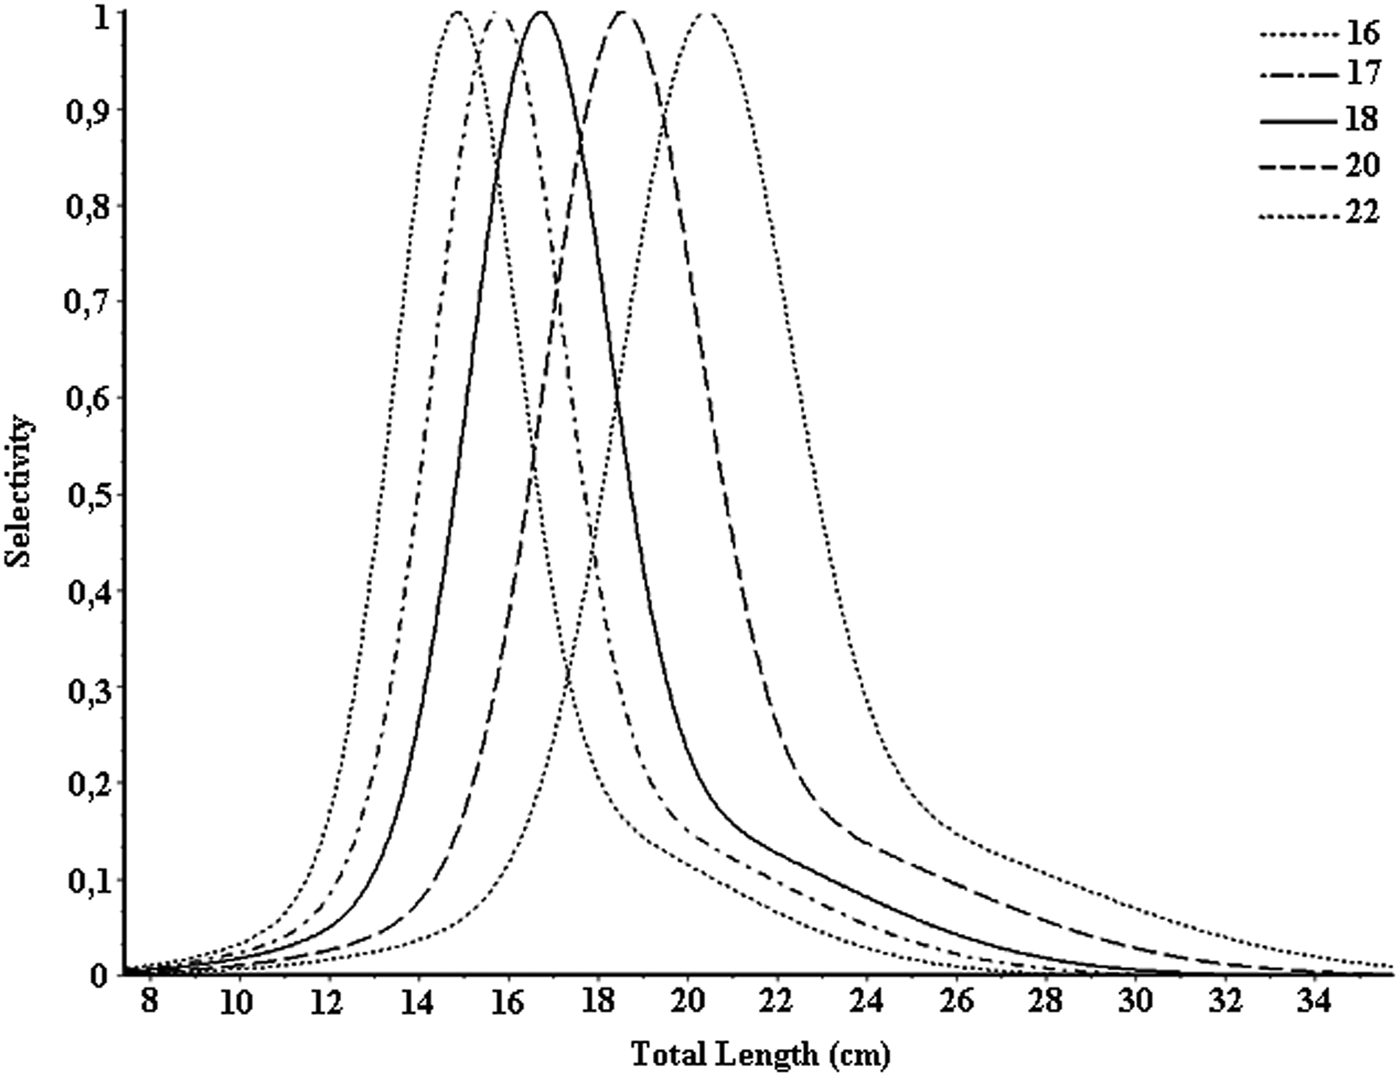
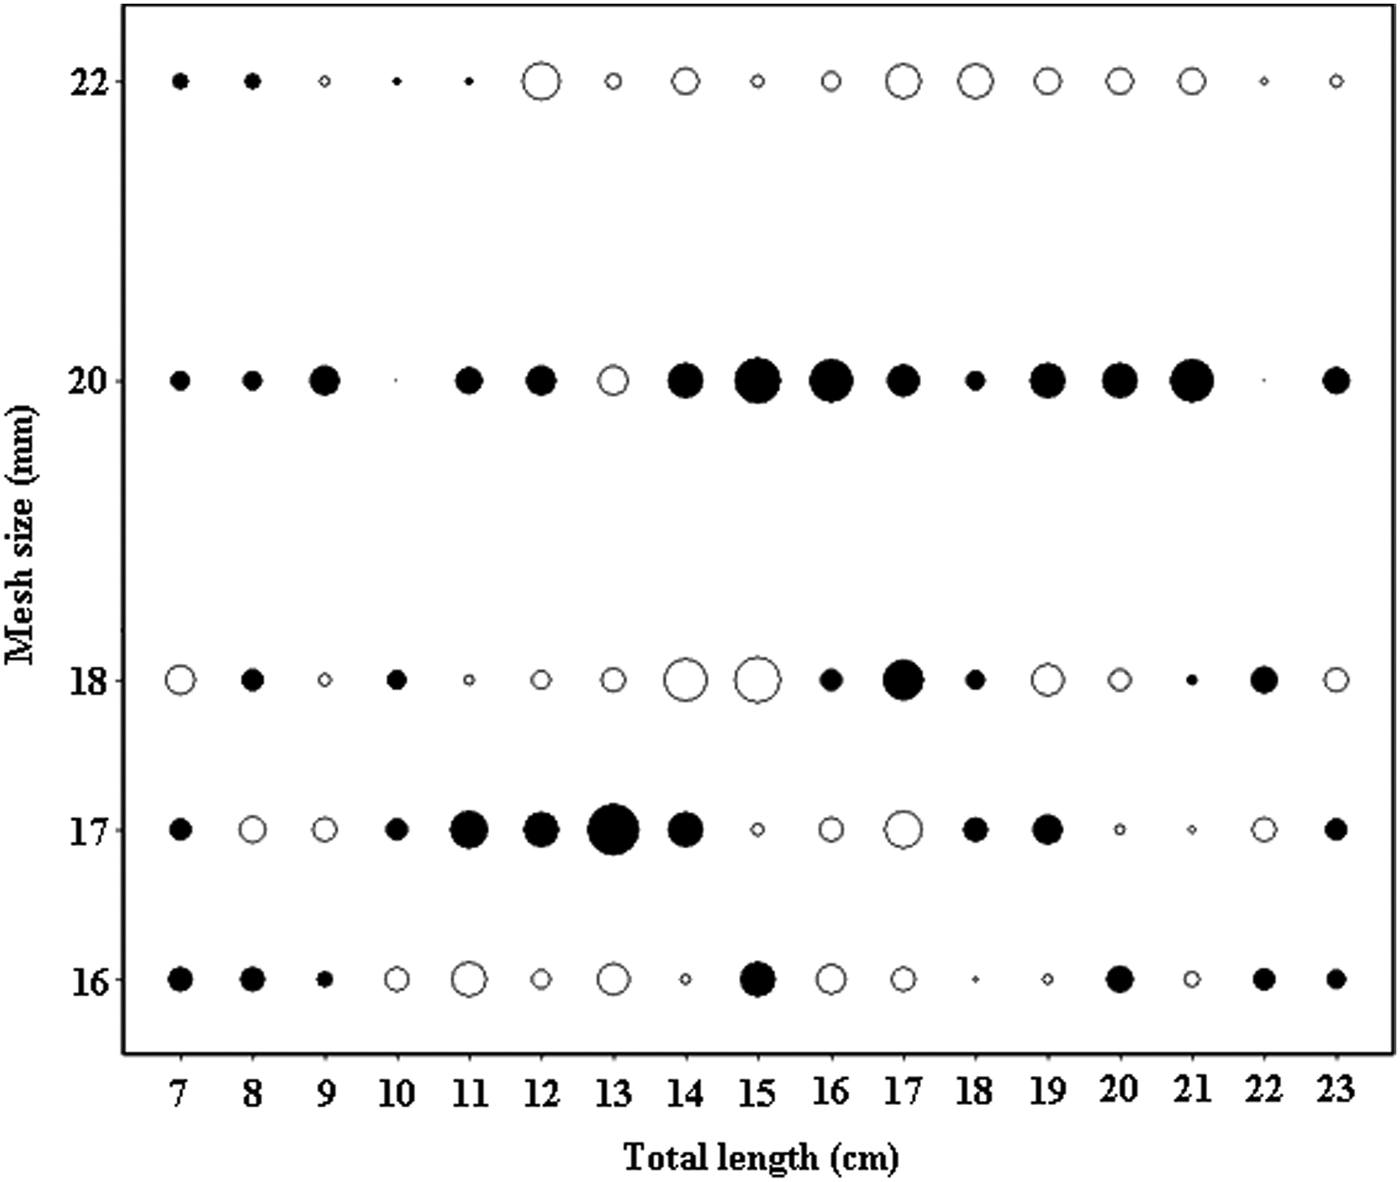
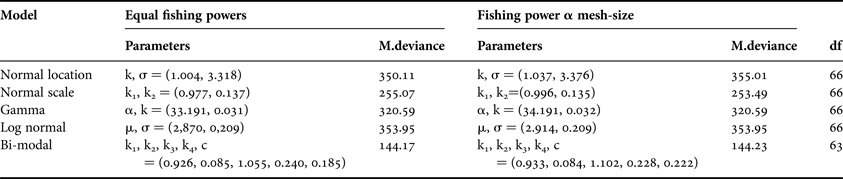
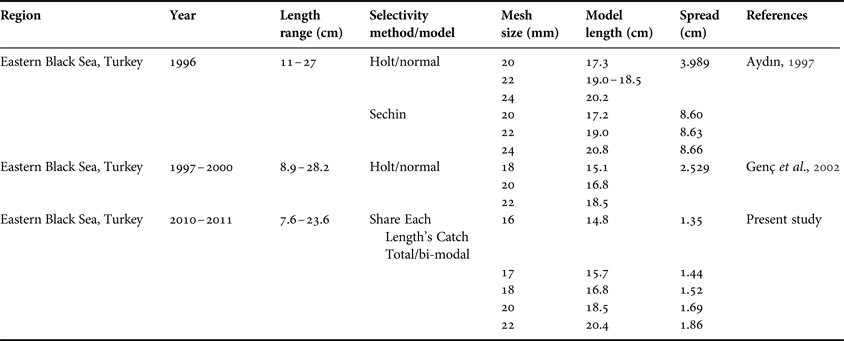
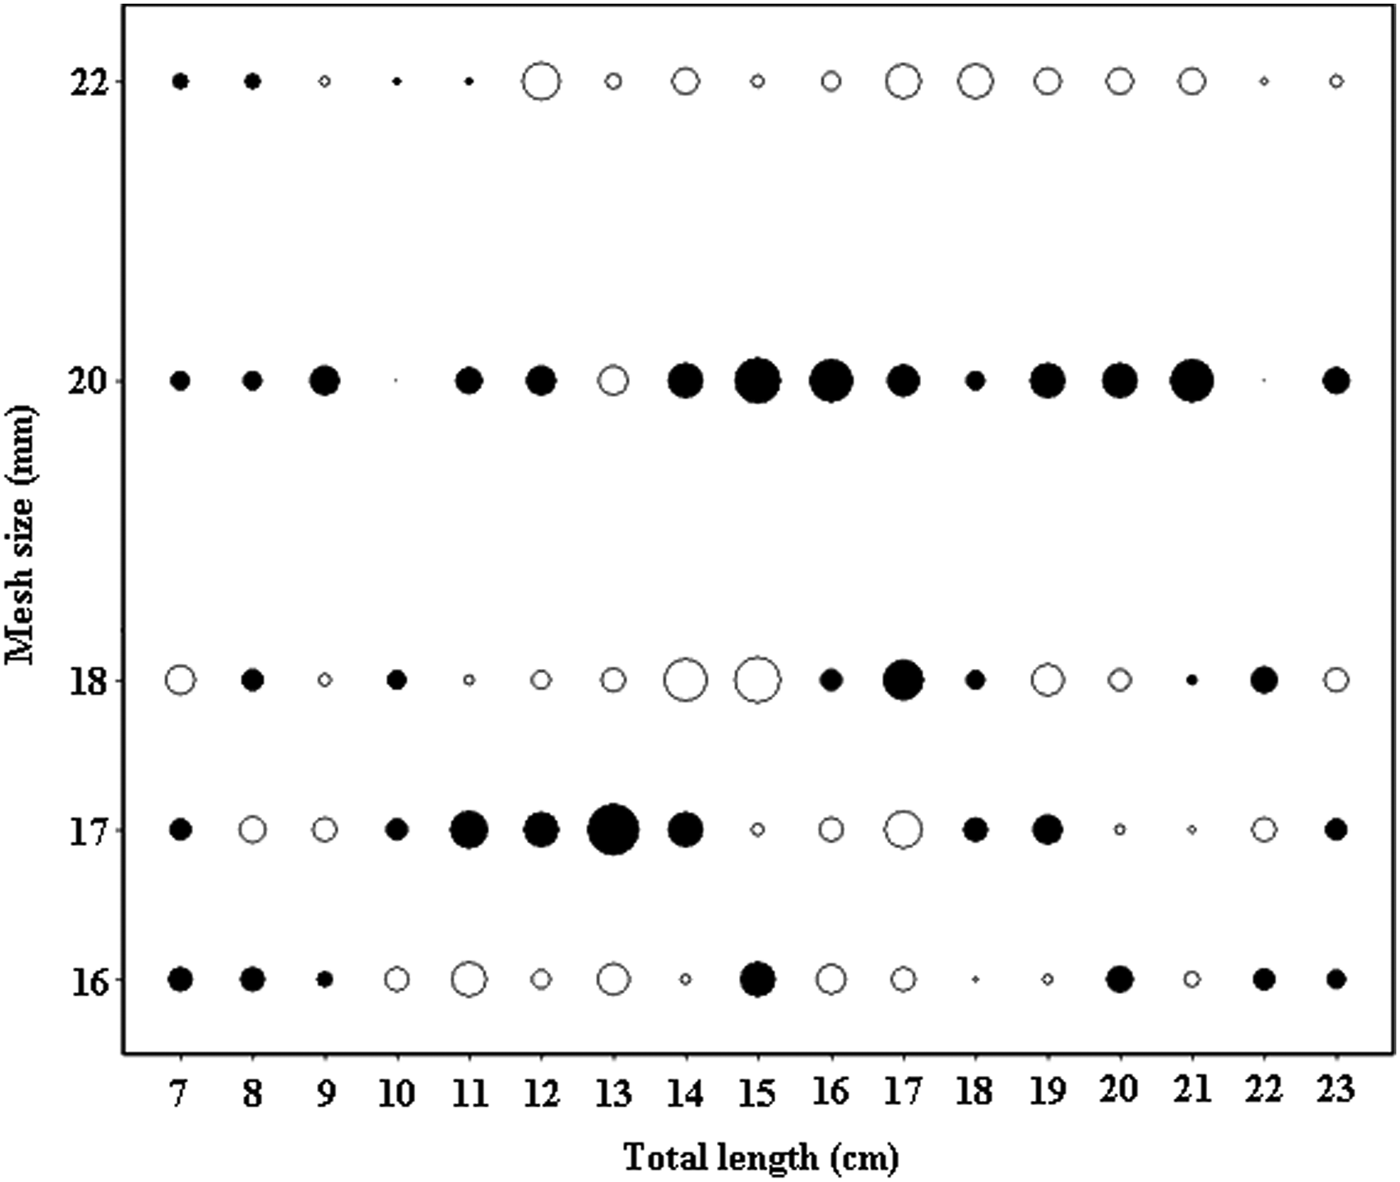
The estimated selectivity model parameters for gillnets are given in Table 4. The modal deviances obtained under the two assumptions of fishing power α mesh-size and equal fishing powers were nearly identical. The bi-modal yielded the best fit, presenting the smallest value (144.17) for modal deviance. The estimated modal lengths using the bi-modal model for 16, 17, 18, 20 and 22 mm mesh sizes were 14.81, 15.74, 16.66, 18.51 and 20.37 cm, respectively. The modal lengths of whiting as well as the spread values increased with mesh sizes (Table 5). The selectivity curves estimated with SELECT model for the different mesh sizes are given in Figure 3, and the plots of the deviance residuals for the best fit model are shown in Figure 4.
Selectivity curves by mesh sizes for whiting.
Deviance residual plots for whiting (• a positive residual, ○ a negative residual).
The Share Each Length's Catch Total model parameter estimates for gillnet selectivity.
Modal length (M. L.) and spread values for the best fit model by mesh sizes.
DISCUSSION
In the present study we estimated the size selectivity for whiting, which is one of the most important species taken in gillnet fisheries in the eastern Black Sea. The selectivity of 16, 17, 18, 20 and 22 mm mesh size used in whiting fishery was estimated by applying the SELECT method using five different models (normal location, normal scale, log-normal, gamma and bi-modal). The bi-modal model provided the best fit by giving the smallest deviance value that was similar in magnitude to the degrees of freedom, compared to other models (Table 4). It can be clearly seen that if the SELECT method was used for gillnet selectivity, the bi-modal model generally provided the best fit (Table 6). Residual plots indicated similar bias for all models, without having significantly different fits to our data. When considering the 20 mm mesh size, it was found that fish between 14 and 21 cm length were caught more than expected. However, for the 22 mm mesh size the opposite was observed. This can be explained by the abundance, distribution and behaviour of the fish in the fishing area as well as the size structure of the population.
Parameters of selectivity curves estimates resulting from the use of different selectivity models for whiting.
The mean length calculated for each mesh size for length–frequency distribution of the total catch, and the optimum length estimated according to the bi-modal model, were closer to each other when compared to other models, which may indicate that the chosen model is more suitable for whiting catch data. Erzini et al. (Reference Erzini, Gonçalves, Bentes, Moutopoulos, Casal, Soriguer, Puente, Errazkin and Stergiou2006) noted that the optimum lengths corresponding to the mean lengths of the catch size is one of the criteria for selecting the most appropriate model. The optimum lengths for 16, 17, 18, 20 and 22 mm mesh size were 14.81, 15.74, 16.66, 18.51 and 20.37 cm, with spreads of 1.35, 1.44, 1.52, 1.69 and 1.86 cm, respectively. The modal lengths in the present study were greater than the values reported by Aydın (Reference Aydın1997) using 20, 22 and 24 mm and by Genç et al., (Reference Genç, Mutlu, Zengin, Aydın, Zengin and Tabak2002) using 18, 20 and 22 mm mesh sizes (Table 6). The differences between the optimum lengths of those studies and this present study could be related to the sampling period, technical characteristics of the nets and different selectivity methods used. The optimum mesh size depends on the length–frequency distribution of fish in the fishing area (Millner, Reference Millner1985). The main factors affecting the selectivity of the gillnets are mesh size, construction of the net, fish shape and behaviour and the capture process of fish into the net (Hamley, Reference Hamley1975). Environmental parameters could also affect gillnet selectivity, such as seabed type, which has an effect on water turbidity and hence visibility, affecting fish behaviour (Constat, 1998).
The length and weight range of whiting specimens varied from 7.6 to 23.6 cm and from 3.44 to 111.54 g with means of, 14.79 ±0.05 cm and 27.17 ±0.52 g, respectively. The mean lengths of whiting were reported as 17.4 cm and 18.77 cm by Aydın (Reference Aydın1997) and Genç et al. (Reference Genç, Mutlu, Zengin, Aydın, Zengin and Tabak2002), respectively. These values were greater than our results. The differences in lengths might be due to sample size, fishing season, depths and stock status (Genç, Reference Genç2000). The mean lengths ranged from 14.18 cm (16 mm mesh size) to 16.67 cm (22 mm mesh size). Most of the fish were caught in the 16 mm mesh size net (40.25%), followed by 17 mm (25.22%), 18 mm (21.86%), 22 mm (6.77%) and 20 mm (5.89%). With the exception of the 22 mm mesh size, most individuals were caught by the smaller mesh sizes. Individuals between 13 and 16 cm dominated the catch with 75.61% (Figure 2).
The size at first sexual maturity of the whiting was reported as 12.5 cm and 12.9 cm for males and 14.7 cm and 13.8 cm for females obtained by Ismen (Reference Ismen1995) and Samsun (Reference Samsun2005), respectively. Ismen (Reference Ismen1995) suggested a minimum catch size of 17.5 cm in order to reduce fishing pressure on whiting stocks. Genç et al. (Reference Genç, Zengin, Başar, Tabak, Ceylan, Çiftçi, Üstündağ, Akbulut and Şahin1999) reported the reproductive age of female whiting as 2 yr (equating with a mean length of 14.94 cm). Currently the minimum catchable size for whiting is 13 cm according to Turkish fisheries legislations (Ministry of Agriculture and Rural Affairs of Turkey, 2012). It can be seen here that there is substantial difference between the size at first sexual maturity and the catchable length. In the light of all these assessments, if the minimum catch size was taken to be 15 cm for conservation and sustainability of the whiting stocks, the percentages of individuals caught under this size were 71.8%, 45.6%, 46.6%, 43.9% and 35% for 16, 17, 18, 20 and 22 mm mesh sizes, respectively. Also, it was determined that the majority of the individuals caught by the 16 mm mesh size were under the size at first sexual maturity. In addition, gillnets of 17 or 18 mm mesh size more intensively caught individuals over the size at first sexual maturity, as well as fewer individuals under this size. While gillnets of 16–18 mm mesh size are frequently used, nets of 20–22 mm mesh size are rarely used in the commercial fishery in the region. It was observed that gillnetters have reduced the mesh sizes since the studies at which 18, 20, 22 and 24 mm meshes were used (Aydın, Reference Aydın1997; Genç et al., Reference Genç, Mutlu, Zengin, Aydın, Zengin and Tabak2002). The reduction in mesh sizes over the years may be due to fisher efforts to get more catch (if the number of large individuals in the stock has decreased) and may indicate a high fishing pressure on the stock over time.
For the protection of local whiting stock, sustainability of the fishing resource and local gillnet fishery, gillnet mesh size should be at least 18 mm. In this context, inclusion of this mesh size, in this study, in the communique regulating the fisheries in Turkey is crucial in terms of sustainable stock management. In this way, a minimum mesh size in gillnets also should be determined for other species.
ACKNOWLEDGEMENTS
We thank Yusuf Ceylan the captain of the RV ‘Rizesuar’ and local fishers for all their co-operation and help during data collection.
FINANCIAL SUPPORT
This study was supported by the Scientific Research Fund of Recep Tayyip Erdoğan University (RTEUBAP) with project number 2010. 103.03.1.