

Since the implementation of the Medicare prescription drug benefit in 2006, seniors in the United States have had a vast array of drug plans from which to choose. In 2006, the median state had 43 choices available. Although many analysts believed that market forces would result in fewer plans being offered over time, the opposite occurred, with the 2009 median having risen to 49. Combined with the dozens of Medicare managed care options available in some areas that also provide drug benefits, beneficiaries in many states have over 100 plans offering drugs from which to choose.
Traditional economic theory posits that more choice unambiguously benefits consumers for both direct and indirect reasons. Consumers benefit directly because a wider array of choices increases the chance that a more desirable one is available. Moreover, there are indirect benefits because choice is a necessary condition for market forces to work effectively. These market forces should then lead to greater efficiency: only products that are valued will be produced, and inputs will not be squandered in the production process. Advancing a similar idea, some psychologists have argued that more choice can increase motivation and improve well-being, as it allows individuals to exercise and experience a greater sense of control. As discussed below, however, some psychologists have begun to question whether the costs of more choice override the benefits.
There are several assumptions implicit in the conclusion that more choices are beneficial rather than detrimental to consumers. There is sufficient information about the alternatives available to consumers; they have the ability to sift through the options to reach a rational and utility-maximizing decision; they will not regret the paths not taken; and that the ensuing market competition does not lead to undue waste (e.g. excess administrative costs). Indeed, consistent with this notion, choice has always been a hallmark of the US health-care system, where, depending on one’s circumstance, opportunities to pick and choose among health insurers, hospitals and specialists abound.
The design of the Medicare drug benefit (Part D of the program) is certainly consistent with the viewpoint that more choice is better. The US Congress had the opportunity to design a drug benefit in any manner it wished, and chose one based on the idea that multiple firms, competing in the marketplace, would result in the highest beneficiary satisfaction at the lowest cost. Although economic theory espouses this kind of competition, the decision was largely based on political ideology, however. Republicans, who controlled Congress and the Presidency at the time the legislation was passed in 2003, wanted a drug benefit that was provided through private insurance and based on competition between insurers over price. Democrats, in contrast, preferred something akin to Parts A and B of Medicare – an entitlement program where drugs simply could be obtained from pharmacies, without insurers being an intermediary. After an extraordinarily contentious debate in which numerous accusations of impropriety were made, the Republican vision was enacted (Oliver et al., Reference Oliver, Lee and Lipton2004).
There was nevertheless some concern that insurers would not want to offer the benefit, and in fact, a good deal of the bill was devoted to dealing with contingencies that would arise if too few companies chose to enter the market. This might have occurred for two reasons: stand-alone drug insurance did not previously exist, and there was the possibility of adverse selection. Ultimately, though, there was no such problem, a large number of companies entered the market, and as noted earlier, this high interest has continued. All told, in 2009, there were 1689 drug plans across the states, but just five companies controlled 55% of the market and ten companies controlled 72% (Centers for Medicare & Medicaid Services, 2009). It should be kept in mind, however, that some of these companies marketed more than one plan.
Moreover, because over 90% of Medicare beneficiaries now have some sort of drug coverage (Kaiser Family Foundation, 2009) – either through Part D plans (39%), so-called ‘Medicare Advantage’ (Part C, generally managed care) plans (20%), coverage from or former employer (18%) or a variety of other sources (14%) – adverse selection of the sickest into the drug benefit has not been much of a problem. Indeed, the Bush administration touted the program as a big success due to the number of choices available, high enrollment and beneficiary satisfaction and premiums that were lower than originally anticipated (Centers for Medicare & Medicaid Services, 2008).
Insurers can offer a standard benefit that, in 2009, has a $295 deductible and 25% coinsurance for the first $2700 in total drug spending. At that point, the beneficiary enters the ‘gap’ or ‘doughnut hole’ where there is no insurance coverage. Once they have spent $4350 of their own money on these cost-sharing requirements, they receive catastrophic coverage with low co-payments (Kaiser Family Foundation, 2009). Insurers are not limited to selling this standard benefit, however, and relatively few do. Rather, they can reconfigure the benefits as they wish so long as the plan they offer is the ‘actuarial equivalent’ of the standard benefit.
Given the complex structure of the benefit, the fact that companies can effectively offer most any benefit package they wish, and the large number of choices available, it is not surprising that program beneficiaries find themselves confused. Hibbard et al. (Reference Hibbard, Greene and Tussler2006) surveyed beneficiaries during the first open enrollment period, and found ‘widespread confusion’ (p. vi) and almost half of respondents reported the decision stressful. Interestingly, those with higher educational levels and incomes were just as confused as those with lower levels.
Confused or not, it is understandable that most Medicare beneficiaries would purchase coverage; the program subsidizes nearly 75% of premium costs. Average monthly premiums paid by beneficiaries averaged about $30 in 2008 (Hoadley et al., Reference Hoadley, Thompson and Hargrave2008). But, because companies are given so much flexibility in configuring their benefits, coverage varies on a number of dimensions, including deductibles, coinsurance, which pharmacies can be used, whether there is any coverage in ‘doughnut hole’, and most importantly, which drugs are included on the company’s formulary. This makes it difficult to make ‘apples to apples’ comparisons, which has had two related impacts: (i) only about 10% of beneficiaries switch plans during the annual open enrollment period, and many of those were low-income enrollees covered by the Medicaid program, who were switched automatically because they did not make a choice (Campbell and Morgan, Reference Campbell and Morgan2007; Neuman et al., Reference Neuman, Strollo, Guterman, Rogers, Li, Rodday and Safran2007); and (ii) very few people are choosing the cheapest plan. Regarding the latter, Gruber (Reference Gruber2009) found that beneficiaries focus too much on premiums and not enough on other costs, which meant that only 6%–9% were choosing the plan that had the lowest total annual costs. On average, they forwent annual savings of $360–$520.
How do Medicare beneficiaries view the large amount of choice that they face? In this article, we use data from the Kaiser Family Foundation/Harvard School of Public Health Survey of seniors, conducted in November 2006, to examine seniors’ desire for extensive vs limited choice, and the factors that affect these desires. Choice is addressed by two survey questions. One is a hypothetical question asking about preferences among dozens of choices vs having the Medicare program choose among companies in the market and offering only a handful to beneficiaries. The other asks whether respondents believe that there are too many, too few or the right amount of plans available. A key distinction between the two questions is that the first question is purely hypothetical and therefore assumes no knowledge of the current array of drug plan choices offered by Medicare. In contrast, the second question presupposes that the participant knows how many drug plan choices are currently available to beneficiaries.
Background: aging, cognitive overload and choice
When details about the new Medicare drug benefit program became public, some decision scientists were probably puzzled with its design. Were he to be alive during that time, Herbert Simon, the Nobel Laureate in Economics in 1978, would likely have been among the first to question its merits. Since the late 1940s, Simon has been one of the most vocal critics of rational choice theory. Instead of viewing individuals as utility maximizers, he advanced the notion of bounded rationality (Simon, 1955, 1956). Simon’s theory of bounded rationality contains two basic ideas. First, human cognitive abilities do not match those assumed by rational choice theory. Instead, humans have limited information-processing capabilities, limited memory capacity, limited time and limited knowledge. Second, the structure of the environment in which people operate plays as much of a role in the decision-making process as the mind does. Hence, ‘a great deal can be learned about rational decision-making … by taking account of the fact that the environment to which it must adapt possess properties that permit further simplification of its choice mechanism’ (Simon, 1956: 129). That is, environmental properties, such as the number of options available, can affect people’s decision-making abilities.
Following Simon’s insights, Barry Schwartz (Reference Schwartz2004) argues that a gap exists between having more choice and making a satisfactory decision. In earlier work, he and his colleagues state, “aspiration to self-determination, presumably through processes resembling those of rational choice, is a mistake, both as an empirical description of how people act and as a normative ideal” (Schwartz, Reference Schwartz2000: 80). Schwartz’ ideas have gained support among a number of researchers, who have shown that having more choice could have negative consequences, such as increased sense of regret and dissatisfaction with one’s choice (e.g. Iyengar and Lepper, Reference Iyengar and Lepper2000; Schwartz et al., Reference Schwartz, Ward, Monterosso, Lyubomirsky, White and Lehman2002; Sethi-Iyengar et al., Reference Sethi-Iyengar, Huberman and Jiang2004).
Iyengar and Lepper (Reference Iyengar and Lepper2000), for example, have shown that having a larger choice set (of jam, chocolate or extra-credit examination questions), compared to a small one, can lead to lower satisfaction rates as well as greater likelihood to avoid making any decision at all. In a more recent investigation, Sethi-Iyengar et al. (Reference Sethi-Iyengar, Huberman and Jiang2004) have broadened their studies into the realm of 401(k) retirement plans, by looking at the data of nearly 800,000 employees. Controlling for age, gender, wage and years with current employer, the authors found an inverse relationship exists between the number of 401(k) plan available and the likelihood that an employee would join a plan. For example, when employees had only two 401(k) retirement plans to choose from, nearly 75% of them joined the program. When the number of plans was 30, the rate of employee signing to the program was reduced to 70%; and when 59 plans were present, the number was further reduced to 60%. Altogether, Sethi-Iyengar et al. (Reference Sethi-Iyengar, Huberman and Jiang2004) showed that for every increase of 10 retirement plans there was a reduction in participation by 1.5%–2%.
A number of other studies convey a similar message. In a randomized experiment, Hanoch et al. (Reference Hanoch, Rice, Cummings and Wood2009) found that adults aged 65 years and above scored lower than their younger counterparts in a series of four questions that required the interpretation of information in tabular format on prescription drug insurance plans. Curiously, even though they performed worse on the task, the seniors were more confident than their younger counterparts that they had correctly chosen the lowest-cost plan. Others (Shah and Wolford, Reference Shah and Wolford2007; Reutskaja and Hogarth, Reference Reutskaja and Hogarth2009) have argued that an inverted U-shaped relationship exists between satisfactions and choice size. They suggest, therefore, that is there is balance and tension between the benefits of having more options and the costs associate with evaluating them.
As the majority of studies on the relationship between choice and decision quality have been conducted with younger population, one might wonder how older adults’ performance would be affected by larger choice size. Old age is associated with decline in cognitive capabilities (for a recent review, see Thornton and Dumke, Reference Thornton and Dumke2005). Yet, only a limited number of studies have evaluated the relationship between age, cognitive decline and choice size. What we do know, however, is that older adults are less likely to correctly interpret objective information than younger individuals, and exhibit more difficulties making medical-related decisions. Hibbard et al. (Reference Hibbard, Slovic, Peters, Finucane and Tusler2001), for example, examined younger and older adults’ understanding of comparative health plan performance information. Their results showed that older (vs younger) adults were significantly more likely to make errors (9% and 25%, respectively). Finucane et al. (Reference Finucane, Mertz, Slovic and Schmidt2005) likewise studied older and young adults’ ability to make decisions in health, financial and nutritional domains. While both older and younger adults performed better on simple compared to complex tasks, as tasks became more complex, the error rates of older adults declined more than did that of their younger counterparts. Finally, Peters et al. (Reference Peters, Dieckmann, Dixon, Hibbard and Mertz2007; Greene et al., Reference Greene, Peters, Mertz and Hibbard2008) have examined the relationship between different information presentation, numeracy levels and decision ability with regard to hospital choice. In an interesting twist to the idea that less information can be beneficial, Peters et al. (Reference Peters, Dieckmann, Dixon, Hibbard and Mertz2007) presented participants either more or less information about hypothetical hospital and were asked to choose the hospital to which they would seek admission if they were in need of medical care. Their result provide support to the idea of ‘less-is-more’ as participants who saw less information were better able to comprehend information and more likely to choose the better quality hospital.
It is hardly surprising, then, that a large majority of older adults (Kaiser Family Foundation, 2006) – and indeed, those of all ages (Public Agenda, 2009) – think that the new Medicare drug benefit is too complicated. This finding is consistent with data on older adults’ educational levels, as less than 20% have a college degree and about 30% did not finish high school (US Census Bureau, 2005). Moreover, older adults have more difficulty in dealing with metrical information (Hibbard and Jewett, Reference Hibbard and Jewett1997) and are more likely to have a poorer understanding of managed care (Hibbard et al., Reference Hibbard, Jewett, Engelmann and Tusler1998).
But, while older Americans believe Part D to be complex, previous research has not examined whether they have preferences concerning the number of choices they are offered. Do seniors prefer to have many options, or would they like Medicare to take a more active role in winnowing down the number of plans in the market and offering a more limited selection of plans to choose from? Furthermore, what are the determinants of the preference for the size of the Part D choice set among seniors? Do socioeconomic and health statuses have an effect on the desire to see more or less choice? This study is designed to address these questions.
The research surveyed thus far leads us to propose a number of hypotheses. First, because seniors view the drug benefits as being too complicated, we hypothesize that respondents will prefer having fewer drug plans from which to choose, and would also be willing for the Medicare program (which presumably has expertise) to choose which of these plans to offer. Second, since nearly all states currently offer over 50 choices, we also predict that respondents will report that there are currently too many plans on the market. Third, because those who are better educated should have less trouble navigating additional choices, we expect that higher education will be positively correlated to wanting more choice. Fourth, since Liberals and Democrats tend to be more favorably inclined toward government interventions and conservatives and Republicans tend to prefer the market mechanism, we expect the former to prefer less choice. Finally, because those who are sicker would prefer to tailor drug formularies to their needs, we expect an inverse relationship between health status and preference for choice size, such that people with worse health will prefer having more choice.
Data and methods
Data
The data are drawn from a nationally representative telephone survey of 1876 adults aged 18 years and above conducted in November 2006 by the Kaiser Family Foundation and the Harvard School of Public Health. The survey over-sampled adults aged 65 years and above, interviewing a total of 718 individuals in this age group. Our analyses are conducted using data from the sample of older adults.
Variables
Preference for number of Part D plans
The first dependent variable is derived from the following survey question and is a hypothetical question that does not presuppose any knowledge about the number of drug plans available to beneficiaries:
“Which statement better reflects your opinion: Medicare should offer seniors dozens of drug plans so individuals can select their own plan to meet their needs, OR Medicare should select a handful of drug plans that meet certain standards, to make it easier for seniors to pick among plans?”
For this question, we created a dichotomous variable for those who ‘preferred dozens of choices’ and those who ‘preferred a handful of choices’. We dropped individuals who responded that they “Did not know” and those who refused to answer the question from the main analysis (n = 65).
Knowledge of number of Part D plans
The second dependent variable is derived from the following survey question and presupposes knowledge about the number of choices currently available to beneficiaries:
“Do you think people on Medicare have too many, too few, or about the right amount of drug plans to choose from?”
We created three mutually exclusive categories for this outcome variable (too many, too few, right amount), and dropped individuals who responded that they “Did not know” and those who refused to answer the question from the main analysis (n = 99).
Explanatory variables
The survey also included questions that serve as independent variables of interest to test our hypotheses. These include education (less than high school, high school graduate, some college, college graduate), self-assessed health status (fair or poor health vs good, very good or excellent health), political views (Conservative, Moderate, Liberal, Other) and political party (Republican, Democrat, Independent, Other). Additionally, we include control measures for basic demographic characteristics including age (indicator for age 75+), gender, race/ethnicity (White, Black, Other races/ethnicitiesFootnote 1). Finally, we include an indicator for those who report the use of any prescription drugs.
In addition to those we dropped because they had missing values on the dependent variables of interest, we also dropped individuals who had missing values on key explanatory variables (age, marital status, race, education, self-rated health, take medication). Our final sample for the analysis examining correlates with the preference for the number of Part D plans comprises 631 seniorsFootnote 2, and the sample for the analysis examining the knowledge of how many Part D plans there are comprises 597 seniors.Footnote 3
Statistical methods
To examine the correlates with the preference for the number of Part D plans offered, we conducted a weighted logistic regression analysis using the response category of ‘prefer handful of plans’ as the omitted reference category. The normalized weights account for the over-sampling of those aged 65 years and above, and post-stratification adjustment by gender, age, race, region and education to 2005 Census Current Population Survey estimates for the nation.
When examining the correlates with the knowledge of how many Part D plans exist, we conducted a weighted multinomial regression analysis using the response category of ‘right amount of plans’ as the omitted reference category. To assess the robustness of our findings, we also conducted sensitivity analyses to account for the missing values that were dropped from our main analysis. We created two new outcome variables that added an additional category for those who responded that they “Did not know” and those who refused to respond to this particular question. We then conducted two multinomial regression analyses with the new dependent variables and the augmented sample, obtaining similar results to our main regressions of interest.Footnote 4
Findings
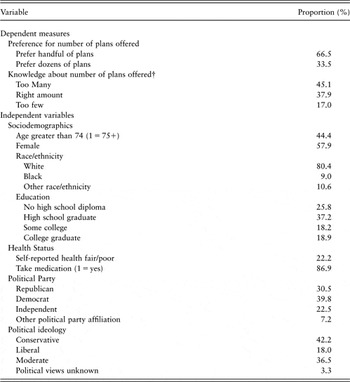
Turning first to the descriptive statistics for our outcome variables of interest (Table 1), two-thirds of the analytic sample (n = 631) said that they would prefer a handful of plans to choose from, whereas only one-third responded that they would prefer dozens of choices. When examining whether respondents thought that there were too many, too few or the right amount of plans, 45% of the analytic sample (n = 597) thought that there were too many Part D plans to chose from, 38% thought that the right amount of plans were offered and 17% responded that there were too few plans.
Weighted analytic sample descriptive statistics (n = 631)

† Analytic sample size is 597.
Table 1 also provides weighted descriptive statistics for the analytic sample that was derived to examine the first dependent variable of interest (preferred number of plans).Footnote 5 The majority of analytic sample is between the ages of 65 and 74 years, female and White. Approximately, three-fifths of the sample has a high school education or less. The members of the sample appear to be relatively healthy, with approximately 23% reporting that their health was fair or poor. Finally, it is of interest to note the breakdown of political party affiliation and political ideology. When examining political party affiliation, the most common responses for these two analytic samples were Democrat (40%), followed by Republican (31%) and Independent (23%). When examining political ideology, however, the most common response was Conservative (42%), followed by Moderate (37%) and Liberal (18%).
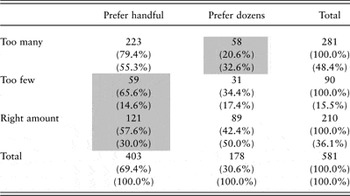
We first examined the consistency of the two main questions in this study (Table 2). By examining a cross-tabulation of these two variables for those who answered both questions (n = 581), we can gain a sense as to whether individuals answered the question that presupposes knowledge about how many plans there were (too few, too many, right amount) in a manner that is consistent with the question that assessed their preferences using two hypothetical scenarios (prefer handful, prefer dozens). For example, did individuals respond that there were too few plans in one question, but then state that they preferred a handful of plans to choose from? Assessing the consistency of these two questions will enable us to assess the similarity of the constructs about which these two questions are measuring, before we examine the correlates of these responses in multivariate regression analysis.
Concordance and discordance between the two choice questions

Note: Shaded areas represent discordance between question responses.
In Table 2, we see that there is a high degree of inconsistency between how seniors from our analytic samples responded to these two questions. Specifically, 41% of the 581 respondents who answered both questions provided a combination of answers to these two questions that was inconsistent, suggesting that the question that assumes knowledge of how many drug plans were offered may not provide the best assessment of how many choices seniors would prefer to have. When looking at the specific inconsistent pairs of answers, nearly 21% of those who said that they thought that there were too many plans said that they would prefer dozens of choices. Even more striking, 66% of those who thought that there were too few plans and 58% of those who thought that there was the right amount of plans responded that they would prefer a handful of drug plan choices. Thus, more than half of those who responded that there were too few choices or the right amount of choices may not have been aware of how many Part D plans were actually offered in their state at the time of the survey.
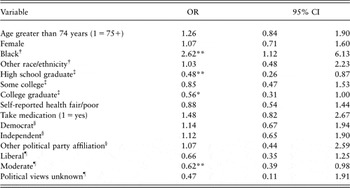
Table 3 presents results from the logistic regression analysis, which examines predictors of those who report that they would prefer dozens of drug plan options vs those who prefer a handful of options. Counter to our intuition, there was an inverse relationship between education and preference for more plans. Relative to those without a high school education, high school graduates and college graduates are significantly more likely to prefer having a handful of options than having dozens, with odds ratios (ORs) of 0.5 (95% confidence interval (CI) = 0.3, 0.9) and 0.6 (95% CI = 0.3, 1.0), respectively. In addition to education, race also plays an important role in the number of choices that seniors would prefer to have. Relative to Whites, Blacks have more than two and a half times the odds of preferring dozens of options to a handful of options (OR = 2.6, 95% CI = 1.1, 6.1). As expected, political ideology was associated with preference for plan size. Compared to the Conservatives, Moderates are significantly less likely to state that they would prefer having dozens of plans to having a handful of plans (OR = 0.62, 95% CI = 0.4, 1.0).
Logistic regression examining predictors for those who prefer dozens of Part D plans

OR = odds ratio; CI = confidence interval.
*p < 0.10; **p < 0.05.
Omitted reference categories: †White; ‡Less than high school; §Republican; ¶Conservative.
Analytic sample size: n = 631.
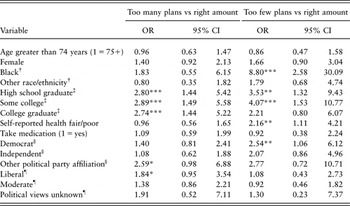
Table 4 presents results from the multinomial logistic regression analysis, which examines predictors of those who think that there are too many or too few plans relative to those who thought that there was the right amount of options. As with the logistic model, our results reveal an unexpected relationship between education level and the response regarding choice size. Those with higher education are significantly more likely to respond that there are too many and too few plans relative to those who have less than a high school degree.Footnote 6 Relative to those without a high school degree, those who graduated from high school have 2.8 times the odds of responding that there were too many plans (95% CI = 1.4, 5.4), and 3.5 times the odds of responding that there were too few plans (95% CI = 1.3, 9.4) vs the right amount. Those with some college (relative to those without a high school degree) have 2.9 times the odds (95% CI = 1.5, 5.6) for responding that there were too many plans and a risk ratio of 4.1 (95% CI = 1.5, 10.8) for responding that there were too few plans. The OR for college graduates (relative to those without a high school education), however, is only significant when comparing the likelihood of responding that there are too many plans vs the right amount of plans (OR = 2.7, 95% CI = 1.4, 5.2).
Multinomial logistic regression examining predictors for those who think there are too many or too few plans

OR = odds ratio; CI = confidence interval.
***p < 0.01; **p < 0.05; *p < 0.10.
Omitted reference categories: †White; ‡Less than High School; §Republican; ¶Conservative.
Analytic sample size: n = 597.
In addition to education, race, self-rated health status and political party affiliation were significantly associated with whether respondents felt there were too few plans relative to the right amount of plans. Compared to Whites, Blacks were much more likely to respond that there were too few choices available (vs the right amount), with an OR of 8.8 (95% CI = 2.58, 30.09). Compared to those with good, very good or excellent self-rated health, those who reported that they were in fair or poor health had 2.2 times the odds (95% CI = 1.11, 4.21) of reporting that there were too few plans than reporting that the right amount of plans were available. Finally, political party affiliation also plays a role in whether respondents felt that there were too few plans vs the right amount, although this association is in an unexpected direction. Compared with Republicans, Democrats are significantly more likely to report that there were too few plans vs the right amount (OR = 2.5, 95% CI = 1.06, 6.1).
Discussion
After presenting some of the study’s limitations, we discuss the unexpected findings in more detail, and conclude with some policy options consistent with the main findings.
Limitations
There are two main limitations for this study. First, there is a possibility that the choice preference question, one of the two independent variables, could have been interpreted differently than was intended. One issue is that it is possible that wording encouraged respondents to say that they prefer a handful to dozens of choices, because ‘dozens’ could encompass a range of 24 to more than 100 drug plans. A related issue is that some of those preferring fewer choices could have been swayed not by the fewer number of options, but rather by liking the idea that Medicare would do the selecting and that it would be based on plans meeting ‘certain standards’. (Others, of course, might not like the idea of government being involved in this part of the process.) Although we cannot address these concerns directly, efforts were made to make the question as valid as possible. After the authors drafted the question, it was modified by survey experts at the Kaiser Family Foundation to make it as even handed as possible and to help ensure the question’s validity. Recall that the question reads as follows:
“Which statement better reflects your opinion: Medicare should offer seniors dozens of drug plans so individuals can select their own plan to meet their needs, OR Medicare should select a handful of drug plans that meet certain standards, to make it easier for seniors to pick among plans?”
Each of the two choices was listed as having a single advantage, and no disadvantages were mentioned. For those preferring many choices, this was reinforced by the notion that they could ‘select their own plan to meet their needs,’ whereas for those preferring fewer choices, reinforcement was through making ‘it easier for seniors to pick among plans.’ Moreover, these are the primary advantages that proponents of more choice and proponents of less choice put forth when trying to argue which is best.
The second limitation is possible endogeneity. In November 2006, when the survey was conducted, seniors were engaged in their second open enrollment period for Medicare drug and managed care plans. About 40% of the analytic samples said that they had enrolled in a stand-alone drug plan at the time of the survey. This could have influenced or may have been influenced by their views about choice. Although the data set included a variable concerning whether the respondent possessed drug coverage, we did not include it because of the concern that it would be an endogenous regressor that may have introduced bias into our model estimates. As a sensitivity analysis, we re-ran the models with this variable included, and the results did not change substantively. From this, we conclude that possible endogeneity from this variable did not unduly affect the results.
Unexpected findings
How can we explain the inconsistency between wanting Medicare to offer few plans with the belief that there is currently the right number or even too few plans to choose from? Recall that one question required knowledge while the other asked for opinion only. In light of previous findings, we believe that beneficiaries’ response to the factual question might be misguided. That is, it is likely that beneficiaries were not aware of the number of plans being offered in their geographic area, and thus their response better reflects lack of knowledge rather than belief about the number of choices available to them. This supposition is supported by another survey of seniors conducted by the Kaiser Family Foundation in February 2006. This took place about three months after seniors were allowed to sign up for the drug benefit, and more than a month after the program had been in place and benefits were available. While nearly all beneficiaries had 40 or more plans from which to choose, only 19% said that they thought there were more than 20 plans available. About one-third (32%) thought that there were fewer than five or 5–20, (49%) indicating that they did not even want to offer their ‘best guess’ (Kaiser Family Foundation, 2006).
Returning to the interpretation of our results, a common finding in psychology is the positive relationship between intelligence – where education can serve as one proxy – and ability to process information (Rammsayer and Brandler, Reference Rammsayer and Brandler2007), as well as between intelligence and memory (Kyllonen and Christal, Reference Kyllonen and Christal1990). Thus, one would expect a positive relationship between education level and preference for greater choice size. Counter to our predications, the results went in the opposite direction: those with a higher level of education (high school and college graduates) were more likely to prefer having only a handful of plans relative to those with less than a high school diploma. One possible reason for these findings could stem from familiarity with the health insurance market. Those with higher education probably were more likely to have had health insurance from their employer and thus be accustomed to facing a choice of only a few health-care plans. Those with less than a high school education, however, might have had less exposure in choosing health insurance and thus wanted the ‘benefit’ of having as much choice as possible. Another possible reason for these findings could be that the more educated have a better understanding of the complexity involved with having too many choices and the cognitive demand this would place on the beneficiary to choose the ‘best’ plan.
When examining determinants of the question presuming knowledge about the number of plans, there was another unexpected result from our analyses with regards to education. Those with higher education were more likely to say that there are currently too many plans than the right amount of plans, and they were more likely to say that there are currently too few plans than the right amount of plans. This may have occurred because among those with lower education, fewer of them actually know how many plans were currently being offered. Thus, perhaps they ‘covered’ for their lack of knowledge by responding that the right numbers were being offered. Supplemental analyses of the predictors of inconsistent answers (not shown) provide some support for this hypothesis. Among those who stated that they preferred only a handful of plans and gave inconsistent answers, the more educated were more likely to state that there were too few plans, whereas the less educated were more likely to state that there was the right amount of plans.
Another finding of interest was that Blacks preferred a more extensive choice of plans. Consistent with this finding, in the multinomial regression, they were also more likely relative to Whites to feel that there were too few plans available. Although our study does not provide any direct insights into why this is the case, one possibility would be a distrust of government making choices for them.
Political affiliation affected participants’ beliefs as well. As predicted, Liberals and Moderates were more likely to prefer having government winnow down the number of choices as well as say that there were too many plan choices. But, contrary to expectations, Democrats were more likely than Republicans to say that there were either too many plans or too few plans available (vs the right number). Although it is difficult to explain this result, one should bear in mind that we have more confidence in the first dependent variable, as it does not presuppose that people know how many drug plans are actually available.Footnote 7 In addition, findings from supplemental analyses examining the patterns of inconsistent answers (not shown) suggest that there are significant differences between Democrats and Republicans in the types of inconsistent answers given. Specifically, among those who responded that they prefer a handful of plans and provided inconsistent answers, Democrats are more likely to say that there are too few plans, whereas Republicans are more likely to respond that there is the right amount of plans. If we put more credence in the results from the choice preference question, it is likely that many of the Democrats who responded that there are too few plans did not actually know how many plans were being offered.
Policy implications
If seniors do not understand comparative information about their various health plan choices, the obvious solution would be to provide them with easy-to-understand information, and further counseling. Currently, a great deal of effort is being conducted on developing optimal ways to display information about competing health plans, an example of which is the Consumer Assessment of Healthcare Providers and Systems program (Agency for Healthcare Research and Quality, 2009). Our findings suggest that there is a need to educate consumers about how to use such information, especially to those with low levels of educational attainment. Our unexpected finding for education suggests that those without a high school degree may not be fully aware of the difficulties in navigating a complex array of drug plan options.
We believe that there are three other policy options that would involve more fundamental change. They are (i) removing insurers Part D of Medicare so that beneficiaries simply purchase drugs and be reimbursed by the program; (ii) having the Medicare program winnow down the number of firms that are available for beneficiaries to choose; and (iii) standardizing benefits.
Removing insurers from the drug benefit
The first option, removing insurers from the system, is consistent with what the Democratic minority proposed during the debate about the drug benefit in 2003. Such an option would solve the problems found in this study and by other researchers, as seniors would not have to pick a prescription drug plan. Rather, they would use the Medicare drug benefit simply to fill prescriptions either at their pharmacy or through the mail, paying whatever co-payments are required. Moreover, if the political will existed to do this (which we question below), it would allow Medicare to directly negotiate drug prices, something that most analysts suggest would lead to considerable savings.
The value added by insurers is something about which there continues to be much disagreement; space does not allow an analysis of competing views. Rather, we just address the political side. Insurers have shown that they have considerable clout in any discussion of health-care reform in the United States, and that, coupled with the fact that Medicare beneficiaries have a favorable opinion of the benefit, makes it hard to envision enacting fundamental changes any time soon. The Obama administration has kept its reform agenda much more modest, mainly suggesting that it might be possible for Medicare to be involved in price negotiation with pharmaceutical companies without otherwise changing the role of private insurers (Obama–Biden, 2009).
Winnow down number of competing firms
One of the policy options included in the survey analyzed in this article was having Medicare winnow down the number of health plan choices, so that beneficiaries are given only a subset (e.g. 10). This type of policy could work in a similar fashion to how employers limit the number of investment options or health plan options to employees. The government could set certain standards for the type of benefits that a drug plan must offer; companies offering drug plans could submit a bid to the government of what they could offer given those set standards; and the government could choose a handful of plans that offer seniors the best value.
One might view this option as an example of ‘libertarian paternalism,’ a theory developed by Thaler and Sunstein (Reference Thaler and Sunstein2003, Reference Thaler and Sunstein2008). In their book Nudge (2008), they suggest that consumer welfare could be improved in many walks of life if both private and public decision-making bodies did more to ‘nudge’ consumers to make choices that are in the best interest. Their prescription is in the libertarian mold because consumers are still given a choice, but paternalistic in that the consumer is guided toward the right one.
As we showed in this article, when asked, beneficiaries say that they would prefer that government winnow down choices, compared to the status quo. In another study, some of the current authors examined other examples where government has been involved in winnowing down choices for consumers, and found that there are examples of such programs operating successfully in the United States (Rice et al., Reference Rice, Cummings and Kao2008). As with the previous policy option, such a proposal would likely face strong political opposition by the insurance industry, because it would limit the number of firms that would be able to offer plans to Medicare beneficiaries.
Standardizing plans
A final option – standardizing drug insurance plans – is probably more politically feasible because it would not cut down the number of insurers. Under standardization, companies are required to ensure that benefits conform to exact requirements as set by government regulation. If, say, there are five standardized plans, labeled A through E, all companies selling Plan A or any of the other plans must provide identical benefits. This allows for easy comparison across companies; if benefits are the same, the only difference would be premiums, service, and perhaps the financial stability of the company. Hoadley (Reference Hoadley2008) has formulated and examined several ways in which prescription drug benefits could be standardized. It should be noted that ‘Medigap’ policies – private insurance sold to cover gaps in Medicare coverage – have been standardized for almost two decades. Most studies have found the policy to have been very successful, improving consumer understanding and satisfaction, and reducing abuses in the market (Fox et al., Reference Fox, Snyder and Rice2003).
There are two potential issues associated with standardizing Medicare Part D plans. The first is fairly technical. When information is standardization, it is necessary for beneficiaries to use two tables of information, rather than one. One table provides the benefits of each standardized plan, and the other, provides the premiums charged by each insurer. It may be challenging for beneficiaries to navigate two tables, although in Medigap, this does not seem to have presented as a major problem. Second, the main element over which drug plans vary is the drug formulary. Thus, it would seem that formularies would be especially ripe for standardization. The problem is that the program was designed for companies to compete on the basis of these formularies. Those that are able to negotiate the best rates with drug makers and pharmacies and offer the most popular drugs in a given class should have a marketing advantage. Standardizing this benefit would then weaken the main competitive feature of the program.
Conclusions
In conclusion, none of these policy prescriptions will be an easy sell. While seniors complain about the complicated nature of the drug benefit and the surfeit of drug plan choices, they are generally satisfied with the benefit, in part, because it is deeply subsidized. Moreover, the drug benefit has been extremely profitable for the pharmaceutical industry (Waxman, Reference Waxman2006), so they are likely to join insurers in opposing any revamping of the program. This study, however, has shown both a desire for simplification through by having fewer choices, as well as some worrisome findings – for example, that seniors do not realize the actual extent of the choices available, and that those with lower education may have ‘covered’ for their lack of knowledge by indicating that they wanted more choice compared to those with higher levels of education. The recent change in the political landscape in the United States, however, does offer an opportunity to reconsider the configuration of the Medicare prescription drug benefit.
Acknowledgements
We thank the Kaiser Family Foundation and the Harvard School of Public Health for allowing us to use their database and including an additional question in their survey. In particular, we are grateful to Mollyann Brodie and Tricia Neuman of the Kaiser Family Foundation for their support and advice. We also thank several other reviewers like Brian Elbel, Betty Tanius and Stacey Wood of a draft of this article. This work was supported by a Robert Wood Johnson Foundation Investigator Award in Health Policy Research. The views expressed imply no endorsement by the Robert Wood Johnson Foundation.