Introduction
Limited allelic diversity in domesticated species, fast-evolving pests, and diseases and effects of abiotic stresses are forcing geneticists and breeders to identify new sources of allelic diversity. The utilization of genetic diversity for grain and straw yield and quality traits has been practiced since the dawn of agriculture. After the translation to modern cropping systems, there was a shift to cultivars with high yield potential but with lower allelic diversity (Jaradat, Reference Jaradat2013). Crop wild relatives have been the focus of attention over the last decades due to reduced allelic diversity in the domesticated gene pools (Charmet, Reference Charmet2011; King et al., Reference King, Grewal, Yang, Hubbart, Scholefield, Ashling and King2017). Breeding for improved yield, abiotic and biotic stress tolerance, and end use quality is a continuous process and requires novel allelic diversity (Schneider et al., Reference Schneider, Molnar and Molnar-Lang2008; Kilian et al., Reference Kilian, Mammen, Millet, Sharma, Graner, Salamini, Hammer, Ozkan and Kole2013). With the growing demand for human food supply around the world, there is even more pressure to identify, select, and breed novel allelic diversity for crop improvement.
One of the most promising genera for the improvement in wheat species (Triticum sp.) is the genus Aegilops (goatgrass). Aegilops is the closest genus to Triticum with two known/proposed ancestral species (Ae. speltoides and Ae. tauschii) of bread wheat (Triticum aestivum L.). Aegilops genus consists of 23 species and some of these are on the first (ex: A. tauschii, D genome donor) and second (Ae. speltoides, possibly B genome donor), while others are on the third gene pool of bread wheat (van Slageren, Reference Van Slageren1994; Salamini et al., Reference Salamini, Ozkan, Brandolini, Schafer-Pregl and Martin2002; Dubcovsky and Dvorak, Reference Dubcovsky and Dvorak2007; Kishii, Reference Kishii2019). There has been growing interest in the introduction of allelic diversity from wheat wild relatives to durum and bread wheat (Mujeeb-Kazi et al., Reference Mujeeb-Kazi, Rosas and Roldan1996; Ceoloni et al., Reference Ceoloni, Kuzmanović, Ruggeri, Rossini, Forte, Cuccurullo and Bitti2017). Many of the species in the genus Aegilops share a similar genome and chromosome structure with species in Triticum which makes them good candidates for interspecific hybridization and chromosome introgressions.
Aegilops mutica Boiss (Amblyopyrym muticum (Boiss) Eig; 2n = 2x = 14) is a wild relative of wheat that is endemic to Turkey and Armenia. It is a diploid species with a genome symbol of TT (Kilian et al., Reference Kilian, Mammen, Millet, Sharma, Graner, Salamini, Hammer, Ozkan and Kole2013; Kishii, Reference Kishii2019). Ae. mutica has gained some attention due to its potential for abiotic and biotic stress tolerance (Othmeni et al., Reference Othmeni, Grewal, Hubbart-Edwards, Yang, Scholefield, Ashling and King2019). It has been reported to have wide genetic variation, as a result of its out-crossing nature (Sasanuma et al., Reference Sasanuma, Chabane, Endo and Valkoun2004), which makes it a good candidate for crop improvement. Recently there has been a growing interest in the introgression of the diversity available in Ae. mutica to durum (Triticum turgidum L. ssp. durum) and bread wheat (King et al., Reference King, Grewal, Yang, Hubbart, Scholefield, Ashling and King2017, Reference King, Newell, Grewal, Hubbart-Edwards, Yang, Scholefield and King2019; Iefimenko et al., Reference Iefimenko, Antonyuk, Martynenko, Navalihina and Ternovska2018). Even though there is a wide potential for the improvement of allelic diversity in the domesticated wheat gene pool with Ae. mutica, the number of accessions available and evaluated in gene banks are quite limited. Ae. mutica is reported to be endangered in Armenia, one of two countries it is found/reported (Haruntyunyan et al., Reference Haruntyunyan, Dulloo, Yeritsyan and Danielyan2010). There is an urgent need for the collection, characterization and utilization of Ae. mutica for conservation purposes and introgression of novel alleles for crop improvement. Therefore, the aim of this study was to evaluate the genetic diversity of a panel of Ae. mutica accessions from central Anatolia and discuss usage possibilities in pre-breeding.
Material and methods
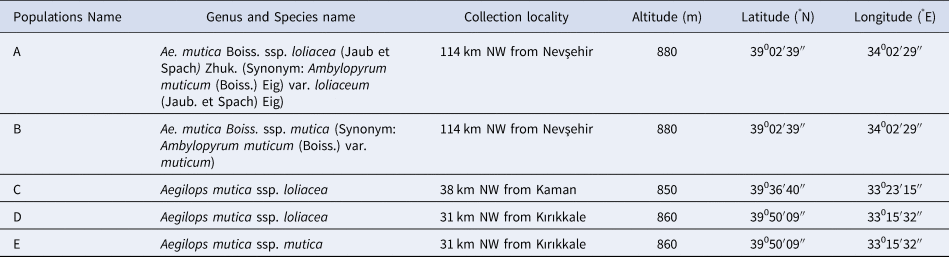
In this study, seventy-five genotypes were used from five newly collected Ae. mutica populations. The samples were originally collected in 2005. In each population, approximately 30 spikes were sampled from different plants, and each plant was considered when separated at least by 1 m intervals from others collected. Single seeds from randomly collected spikes were used. Each population was represented by fifteen individuals. Details of the population collection sites are presented in Table 1.
List of Aegilops mutica populations used in the study

Total genomic DNA was isolated from young leaves according to the cetyltrimethylammonium bromide protocol (Doyle and Doyle, Reference Doyle and Doyle1987) with some modifications of Özkan et al. (Reference Özkan, Brandolini, Pozzi, Effgen, Wunder and Salamini2005). The extracted DNA was evaluated qualitatively in addition to quantity, measured by 0.8% agarose gel electrophoresis. Before using DNA for molecular analysis, the DNA was diluted to the required concentration of 10 ng/ml for SSR applications. Initially, 96 SSR primers mapped to the A, B and D genomes were first screened on eight Ae. mutica genotypes not only to detect their polymorphism level but also PCR amplification. After screening, 29 SSR primers were selected for further work (Table S1). M13 tailed-primer PCR amplification of SSRs according to Schuelke (Reference Schuelke2000) was performed in a 12 μl PCR mix containing 1X buffer, 0.125 mM dNTPs, 0.4 pmol M13 sequences tailed forward primer, 0.3 pmol reverse primers, 3.0 pmol universal M13 primer labelled with one of four (6-FAM, VIC, NED or PET) fluorescent dyes, 0.12 U Taq DNA polymerase, and approximately 50 ng genomic DNA. PCR amplification was performed with an initial denaturation at 94°C for 5 min; 30 cycles of 94°C for 1 min, 55 to 67°C (annealing temperature depending on primers) for 1 min, 72°C for 1 min; followed by 8 cycles of 94°C for 30 s, 53°C for 45 s, and 72°C for 45 s; and a final extension at 72°C for 10 min. A set of four PCR products (1 μl each) labelled with a different dye was combined with 0.25μl GeneScan-400 LIZ® size standards (Applied Biosystems) and 9.86 μl Hi-Di™ Formamide (Applied Biosystems), denatured at 94°C for 5 min, chilled on ice, and separated on an ABI 3130xl Genetic Analyzer (Applied Biosystems). The SSR fragments were scored and checked twice using the Gene Mapper software v3.7 (Applied Biosystems) as described in the user manual.
The SSR was scored as binary data (1/0), indicating the presence or absence of a marker in the genomic representation of each sample. Several genetic diversity parameters were calculated for each locus and population using the GENALEX6.5 software (Peakall and Smouse, Reference Peakall and Smouse2006). Principal coordinate analysis (PCoA) used to explore multivariate relationships among inter-individual genetic distances within and among populations was also performed with the GENALEX6.5 software. Genetic relationships between 75 individuals from 5 populations of Ae. mutica revealed by SSR markers, based on neighbour-joining (Perrier et al., Reference Perrier, Flori, Bonnot, Hamon, Seguin, Perrier and Glaszmann2003) method using the Jaccard similarity coefficient (Jaccard, Reference Jaccard1908), was accomplished with DARwin 6.0.12 software (Perrier and Jacquemoud-Collet, Reference Perrier and Jacquemoud-Collet2006). The definition of population structure was performed with the STRUCTURE v.2.3.4 software (Pritchard et al., Reference Pritchard, Stephens and Donnelly2000) using a model-based clustering method. The structure analysis was carried out with K = 10, 5000 burning length, and 50,000 reps over 10 iterations, and the results were run in the Structure Harvester software v. 0.6.94 (Earl and Vonholdt, Reference Earl and Vonholdt2012) for an estimated K for the 75 genotypes. Delta K (ΔK) is based on the rate of change in the log probability of data between successive K values. This was used to determine the number of clusters (K) in the populations (Evanno et al., Reference Evanno, Regnaut and Goudet2005).
Results
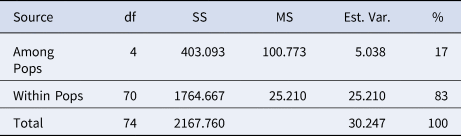
A total of 29 polymorphic and amplified SSR markers, out of 96, showing consistent banding patterns were chosen for assessing genetic diversity among Ae. mutica genotypes studied. 297 markers were produced by these 29 SSR primer pairs. Analysis of molecular variance (AMOVA) was calculated to assess the variance within and between five populations of Ae. mutica collected from different regions. The largest portion of the molecular variance was distributed within the populations (83%), and there was a relatively low variance between populations (17%) (Table 2).
AMOVA summary for the variation within and between populations

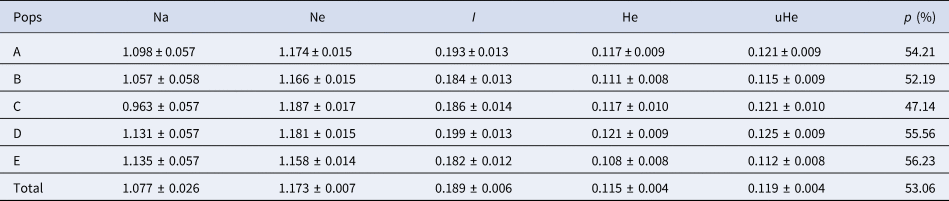
The genetic diversity parameters for each population are given in Table 3. The number of alleles (Na) per population was between 0.963 (C) and 1.131 (E). The highest number of effective alleles (Ne) per locus was in population C with 1.187 alleles, while the lowest was in population E with 1.158 alleles per locus. Shannons' Information Index (I) was the highest in population D (0.199) while the lowest I value was in population E (0.182). The highest expected (He) and unbiased heterozygosity (uHe) values were obtained in population D and the lowest values on He and uHe were in population E. Overall mean values for Na was 1.077, Ne was 1.173, I was 0.189, He was 0.115 and uHe was 0.119 (Table 3). The average polymorphic loci values of all populations were between 47.14 to 56.23% with a mean polymorphism level of 53.06%. The lowest polymorphism was in population C (47.14%), and the highest was in population E (56.23%) (Table 3).
The number of alleles per locus (Na), number of effective alleles per locus (Ne), Shannon's information index (I), expected Heterozygosity (He) unbiased heterozygosity (uHe), and percentage of polymorphic Loci of five Ae. mutica populations each consisting of 15 accessions

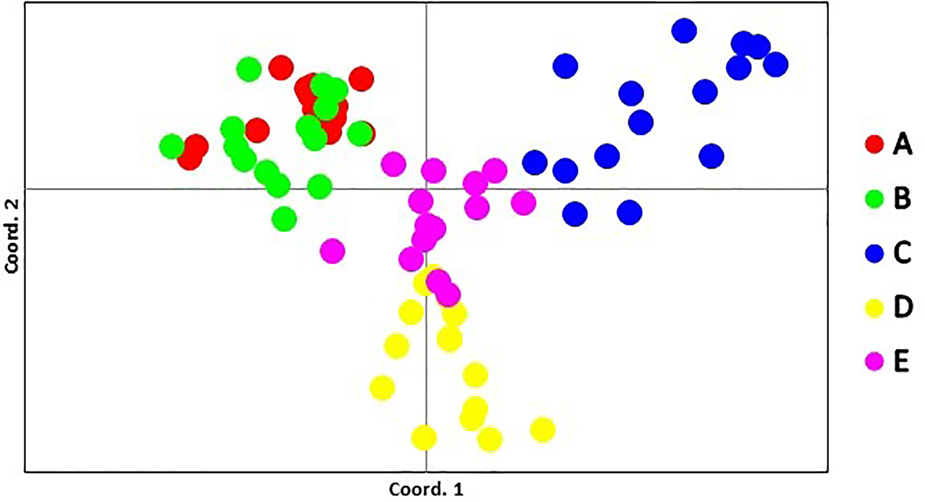
PCoA analysis separated 75 accessions into 4 major clusters, with some falling between groups. There was a clear distinction between populations C, D and E, while A and B were grouped. Populations A and B were significantly different/diverse from C, D and E. According to PCoA analysis of the populations, A and B formed a group while keeping a distance from the rest of the populations. Only some of the accessions in populations D and E are mixed, the rest of the accessions in these two populations were separated (Fig. 1).
Principal Coordinate Analysis (PCoA) of the five populations of Ae. mutica. Colours and letters represent accessions in each population.

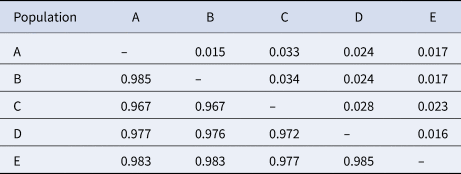
Nei genetic distance and identity values are given in Table 4. The most distant populations were B and C with 0.034, while the closest populations were A and B with 0.015. Similarly, B–C and A–C also had the highest distance values. Nei genetic identity values ranged between 0.967 and 1.000. The highest identity values were between populations' A and B and between D and E (0.985). In contrast, the lowest identity values were between populations A and C, and B and C (0.967).
Nei genetic distance and Nei identity values among Ae. mutica populations

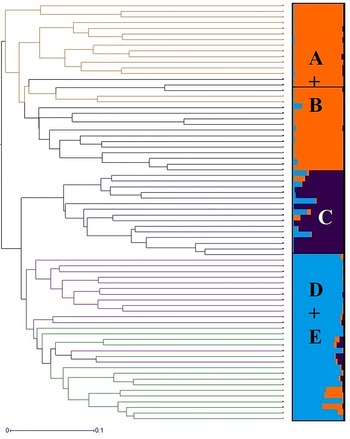
The structure analysis (Hubisz et al., Reference Hubisz, Falush, Stephens and Pritchard2009) was performed with five populations of Ae. mutica based on allele frequency values of 29 SSR markers. The best K cluster values were obtained at K = 3 (Fig. S1). A considerably low level of admixture was observed between the populations except for population C (Fig. 2). While populations A and B formed close clusters, populations D and E formed another cluster. The population with the highest mixture ratio was the 3rd (C) which had some level of admixture mostly from D and E, and few from A and B. Populations A–B (Orange), and D–E (Blue) shared a similar colouring pattern (Fig. 2). Population groupings were mostly distinct except for six genotypes from the population E distributed in the sub-clusters of the population D, in which three accessions formed a separate line, while others were distributed across the sub-clusters of population D. A similar mixture was observed within population B, in which two accessions of population A formed a cluster within population B. The rest of the populations formed clusters with lines within each population. Populations A and B are structured in one main cluster and separated into two sub-clusters in the dendrogram. Similarly, C and E also formed another cluster and separated into two sub-clusters. On the other hand, population D had six admixtures from population E forming the most mixed cluster (Fig. 2).
Dendrogram of population diversity for 75 accessions evaluated with 29 SSR markers. Each letter (A–E) represents a population with fifteen lines.

Discussion
Aegilops is a major genus in the Triticeae tribe with 23 species at various ploidy levels. Some of these species represent candidate parents of bread wheat, while others serve as the primary, secondary, and tertiary gene pool of wheat (Harlan and de Wet, Reference Harlan and de Wet1971; van Slageren, Reference Van Slageren1994; Kishii, Reference Kishii2019). The introgression of alien genes, transgressions, and substitutions has always been a major interest in accelerating allelic diversity in domesticated wheat species (Merezhko, Reference Merezhko1998). Ae. tauschii, as a progenitor of bread wheat, has successfully been incorporated into amphiploid development (Mujeeb-Kazi et al., Reference Mujeeb-Kazi, Rosas and Roldan1996; Sorrells et al., Reference Sorrells, Gustafson, Somers, Chao, Benscher, Guedira-Brown, Huttner, Kilian, Mcguire, Ross, Tanaka, Wenzl, Williams and Qualset2011; Feldman and Levy, Reference Feldman, Levy, Molnár-Láng, Ceoloni and Doležel2015). Several other species in the Triticeae tribe have also been used or utilized for the identification and introduction of novel alleles of biotic (Makkouk et al., Reference Makkouk, Comeau and Ghulam1994; Assefa and Fehrmann, Reference Assefa and Fehrmann2000; Hysing, Reference Hysing2007), and abiotic stress tolerance (Blum, Reference Blum and Blum2011). Aegilops species have been the major interest in wheat breeding (Schneider et al., Reference Schneider, Molnar and Molnar-Lang2008) and cytogenetics (Lukaszewski, Reference Lukaszewski2017) for decades. Genomic characterization of wheat wild relatives in primary to tertiary gene pools has a vast potential for global food sustainability and improvement (Tuberosa et al., Reference Tuberosa, Graner and Varshney2011; Mujeeb-Kazi et al., Reference Mujeeb-Kazi, Kazi, Dundas, Rasheed, Ogbonnaya, Kishii, Bonnett, Wang, Xu, Chen and Mahmood2013; Lee et al., Reference Lee, Tuberosa, Jackson and Varshney2014; Bedő and Láng, Reference Bedő, Láng, Molnár-Láng, Ceoloni and Doležel2015).
Ae.mutica (Amblyopyrum muticum; 2n = 2x = 14; TT) is an annual wild relative of wheat, found predominantly in Turkey and rarely in Armenia, Azerbaijan (Eldarov et al., Reference Eldarov, Aminov and van Slageren2015; Othmeni et al., Reference Othmeni, Grewal, Hubbart-Edwards, Yang, Scholefield, Ashling and King2019) and Iran (Assadi, Reference Assadi1996). According to ITS and trnL-F sequence (Bordbar et al., Reference Bordbar, Rahiminejad, Saeidi and Blattner2011) and 5S rDNA data (Baum et al., Reference Baum, Edwards and Johnson2009), Am. muticum should be classified in Aegilops as Ae. mutica, as suggested by Dvořák and Zhang (Reference Dvořák and Zhang1992) and Feldman and Levy (Reference Feldman, Levy, Molnár-Láng, Ceoloni and Doležel2015). Even though its gene pool was reported to have various resistance genes to powdery mildew and leaf rust, as well as abiotic stresses (Othmeni et al., Reference Othmeni, Grewal, Hubbart-Edwards, Yang, Scholefield, Ashling and King2019; Fellers et al., Reference Fellers, Matthews, Fritz, Rouse, Grewal, Hubbart-Edwards, King and King2020), the discovery of genetic structure and diversity in Ae. mutica has been neglected until recently (Liu et al., Reference Liu, Li, Gong, Li, Han, Li, Song, Liu, Cao, Chu, Yang, Huang, Zhao and Liu2015; King et al., Reference King, Grewal, Yang, Hubbart, Scholefield, Ashling and King2017; Iefimenko et al., Reference Iefimenko, Antonyuk, Martynenko, Navalihina and Ternovska2018). Othmeni et al. (Reference Othmeni, Grewal, Hubbart-Edwards, Yang, Scholefield, Ashling and King2019) and King et al. (Reference King, Newell, Grewal, Hubbart-Edwards, Yang, Scholefield and King2019) report the successful introgression of Ae. mutica into durum and bread wheat genome (AABBTT), with the advantage of the Ph1 locus (Feldman and Levy, Reference Feldman, Levy, Molnár-Láng, Ceoloni and Doležel2015). Ae. mutica might be a good candidate for improving allelic diversity in wheat due to suppressed Ph1 activity and homoeologous pairing. The Ph1 suppressor is reported in Ae. mutica and in Ae. speltoides (Moore, Reference Moore2005). Very few studies report the evaluation and use of genetic diversity in this species (Hegde et al., Reference Hegde, Valkoun and Waines2002; Villar et al., Reference Villar, Maranon, Quero, Panadero, Arenas and Lambers2005; Schneider et al., Reference Schneider, Molnar and Molnar-Lang2008; King et al., Reference King, Grewal, Yang, Hubbart, Scholefield, Ashling and King2017; Othmeni et al., Reference Othmeni, Grewal, Hubbart-Edwards, Yang, Scholefield, Ashling and King2019). Even though there were reports, none of the above studies thoroughly cover the centre of diversity and level of population structure in Ae. mutica, while providing examples and certain use in cytogenetics applications. So, the diversity available in Ae. mutica gene pool is mostly unknown and untouched.
Population structure and diversity
This study aimed to evaluate five different Ae. mutica populations collected from central Anatolia (Table 1). A total of 75 accessions were evaluated with 297 markers using 29 SSR primer pairs. The results revealed a unique diversity among (83%) and between the populations (17%). There were no studies previously reporting genetic diversity among and between natural populations in Ae. mutica, but Naghavi et al. (Reference Naghavi, Hajikram, Taleei and Aghaei2010) reports 88.6% diversity among, and 11.4% between populations in Ae. tauschii from Northern Iran, which was in a similar range to our results. The variation among the populations was low compared to the variation within each population (Table 2), which might be partly explained by open pollination. Three of the populations (C, D and E) formed distinct groups in dendrograms and PCoA analysis, while populations A and B were mixed (Figs. 1 and 2). Populations A and B were collected from a close distance, both from the same region, on the other hand, populations C, D and E were collected from more distant regions (Table 1). Therefore, the proximity of collection sites might be a reason for the mixed groupings in these two. The PCoA analysis formed three separate clusters for populations C, D and E. The collection sites of these populations are separated by a low range of mountains and hills. The climate in all five collection sites was a semi-arid central Anatolian climate with harsh winters and short summers.
There were 47.14% (Pop. C) to 56.23% (Pop. E) polymorphic loci within five populations. Previous reports on Ae. mutica was not found, but similar observations were reported in related Aegilops species. Since we found only 29 SSR primers polymorphic out of 96 initial starts, there is a need for the development and validation of new primers for the in-depth identification of natural population diversity. At last, 29 SSR primers provided a clear distinction between the five populations evaluated.
Shannon's information index (I) values ranged between 0.182 (Pop E) and 0.199 (Pop D) (Table 3). The results observed here were the first report for Ae. mutica. However, when we compared, I value with a related species, Ae. tauschii from Northern Iran, Ae. tauschii had a 0.30 I value (Naghavi et al., Reference Naghavi, Hajikram, Taleei and Aghaei2010). The I value for Triticum urartu from a wider collection area (lower fertile crescent) was between 0.08 and 0.39, which is expected given the distance between collection sites. Overall, even though there was no way to make a direct comparison, related species were in a similar range. There is, therefore, a need for further collections from the wild populations of Ae. mutica for diversity analysis and gene bank collections.
The level of heterozygosity is expected to be higher in Ae. mutica than in self-compatible Aegilops species, due to open pollination in the former. We identified an average of 0.119 unbiased heterozygosity which is higher than previously reported (0.08) from a single population gathered in Central Anatolia (Hegde et al., Reference Hegde, Valkoun and Waines2002). The level of difference might be due to the comparatively different sizes of the populations in our study and that previously reported. One spike was collected from one population in Hegde et al. (Reference Hegde, Valkoun and Waines2002), while there were 75 individuals from five different populations in this study. Therefore, it is plausible to expect higher heterozygosity in the current set.
There were several reports on the utilization of A. mutica in wheat breeding against abiotic and biotic stress factors. Even though it is in the wider gene pool of wheat, due to its ancestral relationship to the B genome lineage (Li et al., Reference Li, Zhang, Wang, Li, Sha, Wang, Ding, Li, Zhao, Wu, Gong, Mafessoni, Levy and Liu2022), A. mutica is a major candidate in the wild relatives of wheat (Grewal et al., Reference Grewal, Coombes, Joynson, Hall, Fellers, Yang, Scholefield, Ashling, Isaac, King and King2022). King et al. (Reference King, Grewal, Yang, Hubbart, Scholefield, Ashling and King2017) report large sequence similarities between bread wheat and Ae. mutica, which would enable possible cross-species evaluations and new marker discovery for Ae. mutica. Edet et al. (Reference Edet, Gorafi, Nasuda and Tsujimoto2018) suggest a close relationship between an ancestral species, Ae. mutica and Ae. speltoides, and five polyploid Aegilops species Ae. triaristata, Ae. crassa, Ae. juvenalis, Ae. vavilovii and Ae. columnaris according to sequence similarities. A similar study also suggests a possible ancestral role of Ae. mutica in wheat history (Glémin et al., Reference Glémin, Scornavacca, Dainat, Burgarella, Viader, Ardisson, Sarah, Santoni, David and Ranwez2019). Genes originating from A. mutica in the introgression lines of wheat are reported to have resistance against leaf, stem and stripe rust, Puccinia sp. (Fellers et al., Reference Fellers, Matthews, Fritz, Rouse, Grewal, Hubbart-Edwards, King and King2020).
The above studies as well as its outcrossing nature, highlight the importance and possible use of Ae. mutica in allele discovery and cytogenetics applications. The ease of generating introgression lines due to naturally available Ph1 inhibitor would enable the addition of the vast resources available in the genome of A. mutica (Fellers et al., Reference Fellers, Matthews, Fritz, Rouse, Grewal, Hubbart-Edwards, King and King2020; Coombes et al., Reference Coombes, Fellers, Grewal, Rusholme-Pilcher, Hubbart-Edwards, Yang, Joynson, King, King and Hall2022) into the wheat genome. High throughput sequencing platforms and the generation of doubled haploids would enhance the speed of introduction and reduce the linkage drag (Grewal et al., Reference Grewal, Coombes, Joynson, Hall, Fellers, Yang, Scholefield, Ashling, Isaac, King and King2022).
Germplasm in-situ and ex-situ conservation
Ae. mutica, as an outcrossing and diploid member of the Triticeae tribe, holds its position as an important and unexplored candidate in wheat genetic improvement and novel allele discovery. This preliminary study provides a snapshot of the vast reservoir available in the gene pools of Ae. mutica. Even within a relatively short distance, five different populations provided a clear wide allelic potential. Ae. mutica is not endangered in Turkey, however, there is a need for the identification and protection of the population hot spots in central Anatolia and the rest of the Caucasian region. Further studies with diverse accessions from the entire Caucasian region may provide new insights and identify unique allelic diversity. Introgression of Ae. mutica and new advances in sequencing techniques may allow the broader introduction of this species into the wheat genome.
Supplementary material
The supplementary material for this article can be found at https://doi.org/10.1017/S1479262122000235