Introduction
The bird’s visual system, unlike that of mammals, includes a substantial efferent projection from the brain to the retina. In ground-feeding birds, roughly 10,000 myelinated efferent fibers, also known as retinopetal or centrifugal fibers, originating from the isthmo-optic nucleus (ION) in the midbrain, enter the contralateral retina via the optic nerve (Cowan & Powell, Reference Cowan and Powell1963). The function of this projection is unknown, but since the input to the ION is largely from the optic tectum via a minimal number of synapses (Holden & Powell, Reference Holden and Powell1972; Uchiyama et al., Reference Uchiyama, Yamamoto and Ito1996; Li et al., Reference Li, Hu and Wang1999), it would seem to be designed for the rapid modification of retinal activity.
Several salient features of the efferent input to the retina must be regarded as clues to its function. In each of the three species that have been examined, quail (Uchiyama et al., Reference Uchiyama, Aoki, Yonezawa, Arimura and Ohno2004), pigeon (Hayes & Holden, Reference Hayes and Holden1983), and chicken (Fritzsch et al., Reference Fritzsch, Crapon de Caprona and Clarke1990; Morgan et al., Reference Morgan, Miethke and Li1994; Fischer & Stell, Reference Fischer and Stell1999), the efferent input is overwhelmingly to the inferior retina. Typically, every efferent fiber originating in the ION forms a large and complex synapse with the cell body of a single amacrine cell of a particular and unusual type (Dowling & Cowan, Reference Dowling and Cowan1966; Uchiyama & Ito, Reference Uchiyama and Ito1993; Fischer & Stell, Reference Fischer and Stell1999). These amacrine cells, now commonly called “target cells,” were first described as “association amacrine cells” by Cajal in the late 19th century (Ramón y Cajal, Reference Ramón y Cajal1896). Target cells, by virtue of their large size and strong staining for parvalbumin (Fischer & Stell, Reference Fischer and Stell1999), are readily identified in the retina. Their anatomy is unusual in that they have only a few rudimentary dendrites and, in violation of the general definition of amacrine cells, an axon that in many instances runs to distant parts of the retina where it terminates in a small axonal arbor (Ramón y Cajal, Reference Ramón y Cajal1889; Uchiyama et al., Reference Uchiyama, Aoki, Yonezawa, Arimura and Ohno2004). The absence of proper dendrites argues that the input to target cells is overwhelmingly, perhaps exclusively, from its efferent fiber synapse and consistent with this, target cells are, like efferent fibers, confined to the inferior retina (Catsicas et al., Reference Catsicas, Catsicas and Clarke1987a; Cellerino et al., Reference Cellerino, Novelli and Galli-Resta2000). This striking restriction of efferent input to the inferior retina has been the basis of several hypotheses concerning efferent function (e.g., Clarke et al., Reference Clarke, Gyger and Catsicas1996).
Another clue to efferent system function, though one that has not so far been explored, may lie in the details of the efferent input within the inferior retina. Only in pigeon is there a density map of sufficient resolution to determine these details, but from this map, it is clear that efferent input, though present in the surrounding retina, is absent from the area centralis (Hayes & Holden, Reference Hayes and Holden1983). Some ambiguity is associated with this observation in that the authors do not say whether the entire area centralis or just a part is free of efferent input. In their careful wording, they say that efferent terminals “were absent from a circular area about 500 μm diameter centered on the area centralis.” Very likely this ambiguity resulted from the lack of any exact way to define the border of the area centralis. Setting aside this issue, a plausible interpretation of their observation might be that the function of the efferent system and the high acuity function of the area centralis are mutually exclusive. The results we present here, however, argue that this interpretation is not correct.
To test the idea that high acuity and the function of the efferent system are mutually exclusive, we have examined the efferent system in the chicken retina. Using an antibody to rhodopsin, we have located the area centralis, a rod-free zone, and mapped the distribution of target cells in and around this region. While there are differences between pigeon and chicken in the position of the area centralis within the retina, our main finding is that unlike pigeon, the efferent system is present in the chicken area centralis at a density no different from surrounding regions.
Materials and methods
A total of 31 white leghorn chickens (Gallus gallus) were used in this study, all of which were hatched from eggs acquired from the Avian Sciences Facility of the University of California, Davis. All animal care and experimental protocols were approved by the Institutional Animal Care and Use Committee of the University of California, Davis.
Three-week-old chickens were sacrificed with an interperitoneal injection of pentobarbital (Beuthanasia-D, 047305; Webster Veterinary, Sterling, MA). The eyes were removed and hemisected; the anterior chamber and vitreous were discarded, and the posterior eyecup was set aside to be prepared for immunohistochemistry.
CERN-901 antibody
The antibody CERN-901 was raised in female New Zealand rabbits against purified chicken rhodopsin as described for other visual pigments (Foster et al., Reference Foster, Garcia-Fernandez, Provencio and DeGrip1993). Purified chicken rhodopsin was prepared in a procedure modified from Okano et al. (Reference Okano, Fukada, Artamonov and Yoshizawa1989). Chicken photoreceptor outer segments were isolated on a continuous sucrose gradient as described for bovine (De Grip et al., Reference De Grip, Daemen and Bonting1980). Visual pigments were solubilized in 20 mM dodecylmaltoside (Degrip & Boveegeurts, Reference Degrip and Boveegeurts1979) and subjected to ConA-affinity chromatography (De Grip, Reference De Grip1982). After elution of cone pigments with 2 mM α-methylmannoside, rhodopsin was eluted with 100 mM α-methylmannoside and further purified by anion-exchange chromatography over diethylaminoethyl cellulose. Fractions with an A280/A500 ratio ≤2.2 were used for antibody production. CERN-901 was shown to react with rhodopsins in a variety of species but not to cross-react with cone opsins (Geusz et al., Reference Geusz, Foster, DeGrip and Block1997; Rothermel et al., Reference Rothermel, Willbold, deGrip and Layer1997; Jacob et al., Reference Jacob, Rothermel, Wolf and Layer2005).
Preparation of retinal sections and flat mounted retinas
Retinas intended for sectioning were fixed in a chilled solution of 3% glutaraldehyde (16020; Electron Microscopy Sciences, Hatfield, PA) in phosphate-buffered saline (PBS) for 2 h. Following three 10-min rinses in PBS, retinas were placed in a 30% sucrose solution overnight at 4°C. Prior to sectioning, retinas were embedded in OCT gel (27050; Ted Pella, Redding, CA) and set on a block of dry ice for rapid freezing. Sections of 5 μm thickness were cut on a cryostat, collected on gelatin-coated slides, and stored at 4°C for later use in immunohistochemistry.
Retinas that were to be flat mounted were fixed in a chilled solution of 4% paraformaldehyde (19208; Electron Microscopy Sciences) in PBS for 1 h. Following three 10-min rinses in PBS, the retina was transected vertically and gently detached from the eyecup while floating in PBS. The pecten was carefully excised, and two or three radial tension cuts were made prior to storage in PBS overnight at 4°C.
Immunohistochemistry
Retinal sections were given three quenching washes for 5 min in a solution of 1% glycine and 0.1% Triton (X-100; Sigma, St. Louis, MO) in PBS, followed by a blocking solution of 3% bovine serum albumin (BSA, A2153; Sigma) and 0.1% Triton in PBS for 30 min. Primary antibodies, rabbit CERN-901 and mouse anti-Parvalbumin (P-3088; Sigma), were diluted in blocking solution to concentrations of 1:2000 and 1:1000, respectively, and applied to the sections for 1 h at room temperature. This was followed by three 20-min rinses with PBS, and the application of the secondary antibodies goat anti-rabbit conjugated to Alexa Fluor 488 (A11008; Invitrogen, Carlsbad, CA) and goat anti-mouse conjugated to Alexa Fluor 568 (A11004; Invitrogen), both at a concentration of 1:500 in blocking solution. Sections were incubated in secondary antibodies for 1 h. After further washing in PBS, sections were mounted with Vectashield (H1400; Vector Labs, Burlingame, CA) and visualized with an inverted confocal microscope (Olympus FLUOVIEW) equipped with argon (568 nm) and krypton (488 nm) lasers. When necessary, slides were sealed with DPX mountant (NC9753710; Fischer, Pittsburgh, PA).
Flat mount retinas were floated onto uncoated slides for the duration of the immunohistochemistry, which was similar to the procedure for sections, except in the following details. Retinas were quenched for 1.5 h and blocking time was increased to 1 h. Incubation with the primary antibodies was extended to 5 days and incubation with the secondary antibodies to 2 days, all at 4°C, with 1% sodium azide included in both incubating solutions. Initial wash after primary antibody incubation was extended to 40 min, but all other wash times were consistent with the procedure for sections. Treated retinas were mounted on gelatin-coated slides, dehydrated in open air at room temperature, and taken though ethanol and xylene washes, before mounting in DPX.
Protein isolation
The procedure for protein isolation was adapted from that of Partida et al. (Reference Partida, Lee, Haft-Candell, Nichols and Ishida2004). A 5 × 5–mm square was cut from the ventral portion of an eyecup and the retina gently separated from the sclera in Hank’s solution (14170-112; Invitrogen), placed in a microcentrifuge tube, snap-frozen with liquid nitrogen, and stored at −80°C.
A single unthawed square of retina was Dounce homogenized on ice in 50 mM N-2-hydroxyethylpiperazine-N′-2-ethanesulfonic acid (H3375; Sigma), 140 mM NaCl, 50 Kallikrein inhibitor units/ml aprotinin (A6279; Sigma), 4 μg/ml leupeptin (1017101; Roche, Indianapolis, IN), 1 mM MnCl2, and 1 mM CaCl2 (Okano et al., Reference Okano, Fukada, Artamonov and Yoshizawa1989) and then centrifuged for 10 min at 1000 g at 4°C. The supernatant was collected and centrifuged for 1 h in an ultracentrifuge at 45,000 g at 4°C, and the resulting pellet resuspended in the homogenization solution. To create the sample buffer solution, NuPage LDS Sample buffer (NP0007) and NuPage Sample reducing agent (NP0004) were added to the suspension containing the sample protein. The solution was boiled for 5 min, and 25 μl of the sample buffer solution was loaded into a 4–12% Bis-Tris gradient gel (NP0321), along with the standard BenchMark Protein Ladder (10747-012), and electrophoresis was carried out at 200V for 1 h in MOPS running buffer (NP0001). All required supplies were obtained from Invitrogen, unless otherwise noted.
Western blotting
Subsequent to electrophoretic separation, the proteins were transferred from the Bis-Tris gel to a Polyvinylidene Difluoride membrane (162-0255; Bio-Rad Labs, Hercules, CA) in NuPage Transfer Buffer (NP0006; Invitrogen), and methanol in deionized water, for 1 h at 30V. The membrane was stained with Ponceau S (78376; Sigma) to confirm a successful protein transfer, rinsed in Tris-buffered saline with 0.1% (v/v) Tween-20 (TBST) pH 7.4, and left in TBST overnight at 4°C. The membrane was blocked in 5% nonfat dry milk (w/v) and 3% BSA (v/v) for 45 min, followed by 30 min of incubation with the primary antibody, CERN-901, diluted to a concentration of 1:4000 in TBST and 3% BSA. Three 5-min washes in TBST both preceded and followed 1 h incubation with goat anti-rabbit secondary antibody conjugated to horseradish peroxidase (NA934; Amersham) diluted to a concentration of 1:40,000 in TBST and 3% BSA. The resulting protein bands were visualized via ECL detection with ECL Western Blotting Detection Reagents (RPN 2106; Amersham, Piscataway, NJ). Western blots were replicated 9 times, each using a retinal piece from an individual bird.
Results
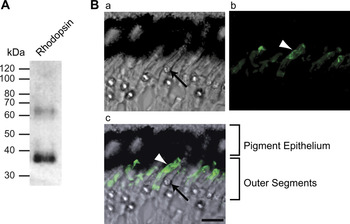
CERN-901 is an antibody raised against purified chicken rhodopsin and shown elsewhere to recognize rod photopigment but not cone opsin (Geusz et al., Reference Geusz, Foster, DeGrip and Block1997; Rothermel et al., Reference Rothermel, Willbold, deGrip and Layer1997; Jacob et al., Reference Jacob, Rothermel, Wolf and Layer2005). To confirm its specificity, we performed Western blots and immunohistochemistry. Rhodopsin can appear in a Western blot as a series of bands due to the fact that di-, tri-, and further oligomers may be detected with immunoblotting either when the sample is boiled prior to blotting or when there is an abundance of opsin present (Foster et al., Reference Foster, Garcia-Fernandez, Provencio and DeGrip1993). Our Western blots (Fig. 1A) displayed a clear band at roughly 39 kDa, which corresponds to the molecular mass of rhodopsin (Takao et al., Reference Takao, Yasui and Tokunaga1988), as well as a band at approximately 65–70 kDa, corresponding to the rhodopsin dimer. When an excess of sample was loaded onto the gel, a third band at roughly 100 kDa, corresponding to the trimer, could also be seen.
Specificity of CERN-901. (A) A Western blot of protein from chicken retinal membrane fraction probed with CERN-901. A band with the apparent molecular mass of 39 kDa represents rhodopsin and the fainter band at 65 kDa represents the rhodopsin dimer. (B) A retinal section stained with CERN-901. The DIC image (a) shows the photoreceptors and pigment epithelium. The highly refractile oil droplets of cones appear as bright spots just below an outer segment (arrow identifies one oil droplet). In the fluorescence image (b), CERN-901 is seen to recognize some outer segments (arrowhead). The merged images (c) show that the stained outer segments are not associated with oil droplets and are therefore rods. Scale bar is 10 μm.

Immunohistochemistry performed on retinal sections consistently showed CERN-901 selectively recognizing a subset of outer segments corresponding to rods. In the chicken retina, all cones, including double cones, have oil droplets in the inner segment, whereas these are absent in rods (Morris & Shorey, Reference Morris and Shorey1967). As shown in Fig. 1B, outer segments sclerad to oil droplets were unstained, but staining was seen in outer segments not associated with oil droplets. In parallel with each repetition of this experiment, we ran secondary-only controls that were visualized on the confocal microscope at the same settings as the experimentals. In all cases, the controls were uniformly black save for slight autofluorescence of the cone oil droplets.
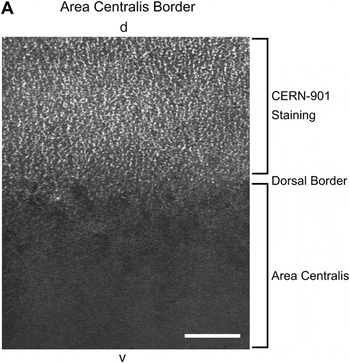
Identification of the area centralis
To locate the area centralis, we examined 10 flat mount retinas from 3-week-old chickens labeled with CERN-901. By focusing at the level of the outer segments, it was readily apparent in all retinas examined that a roughly circular area nasal to the pecten and optic nerve head was unstained. The demarcation between the unstained area centralis and the surrounding retina was sharp and unambiguous (Fig. 2A, D), having a transition zone that was approximately 200 μm wide. To map the full extent of the area centralis, approximately 20 images obtained with a 20× objective from each of two retinas, both from left eyes, were montaged together. At 3 weeks, chicken eyes are still growing, and developmental differences between individuals can produce variation in retinal dimensions. The vertical meridians of the two montaged retinas were 17.5 and 16.8 mm when measured after fixation. The horizontal and vertical extents of the area centralis in these two retinas was 3.05 mm dorsal to ventral and 3.07 mm nasal to temporal for one and 3.00 mm dorsal to ventral and 2.83 mm nasal to temporal for the other. Their centers were approximately 2.33 and 1.83 mm nasal of the dorsal end of the pecten, respectively.
The borders of the area centralis.
Confocal image of a flat mounted retina treated with CERN-901 and viewed at the level of the photoreceptor outer segments. In this image, the dorsal border of the area centralis is defined by the transition from a rod-free area to a region in which rod outer segments are brightly stained. d and v indicate dorsal and ventral in the retina, respectively. Scale bar is 100 μm.

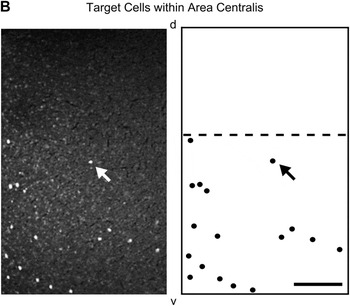
Confocal image of a flat mounted retina treated with anti-parvalbumin. This image is entirely within the area centralis at a plane of focus in the inner nuclear layer where the large cell bodies of target amacrine cells are readily discriminated as bright dots. In the right-hand panel, the position of these cells is shown diagrammatically along with a dashed line representing the dorsal limit of target cell distribution—roughly the horizontal meridian of the eye. An arrow denotes the location of a single target cell in both the diagram and the image. Scale bar is 100 μm.

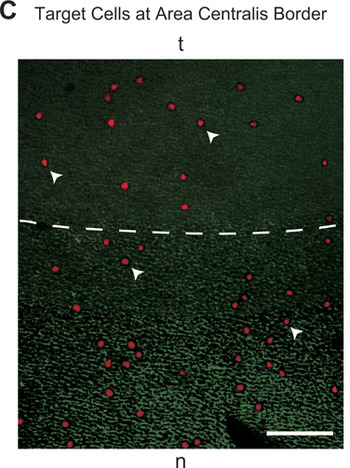
Confocal image of a flat mounted retina treated with anti-parvalbumin and CERN-901. At the level of the inner nuclear layer, the target cells, labeled with anti-parvalbumin, are clearly visible as large red cell bodies. Arrowheads indicate various target cells. At the level of the outer segments, the rod photoreceptors, labeled with CERN-901, are stained green in the region outside the area centralis. The dashed line represents the approximate border of the area centralis. As is apparent, the target cells continue past the border into the area centralis without any decrease in density. Scale bar is 50 μm.

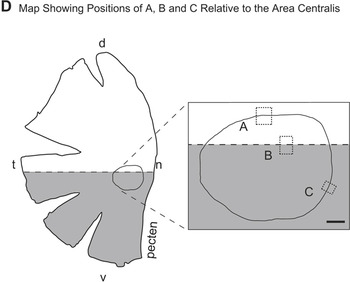
Relative positions of A, B, and C, and the area centralis shown on a flat mount piece of retina temporal to the pecten. In this diagram, the gray portion indicates the ventral retina occupied by target cells. The roughly circular line is the border of the area centralis, shown in enlargement to the right. Dashed boxes indicate the positions of the panels A, B, and C. d and v indicate dorsal and ventral, while n and t indicate nasal and temporal in the retina. Scale bar is 500 μm.

Mapping the position of target cells
At least three types of amacrine cells in the chicken retina show parvalbumin-like immunoreactivity (Sanna et al., Reference Sanna, Keyser, Deerink, Ellisman, Karten and Bloom1992; Fischer et al., Reference Fischer, Seltner, Poon and Stell1998; Fischer & Stell, Reference Fischer and Stell1999). Of these types, one, the target cell, possesses a distinctly larger, prolate cell body extending higher in the inner nuclear layer than the others (Fischer & Stell, Reference Fischer and Stell1999). Using the same antibody to parvalbumin as Fischer and Stell (Reference Fischer and Stell1999), and focusing in the middle of the inner nuclear layer, it was possible to identify these cell bodies unambiguously (Fig. 2B–D). As expected from previous reports (Catsicas et al., Reference Catsicas, Catsicas and Clarke1987a; Fischer & Stell, Reference Fischer and Stell1999; Cellerino et al., Reference Cellerino, Novelli and Galli-Resta2000), we found that the distribution of these was highly non-uniform, with the highest density lying just below the horizontal midline, and above this an absence of target cells in the dorsal retina. Of the seven retinas examined with double labeling for both rhodopsin and parvalbumin, it was clear in all that the horizontal midline cut through the area centralis so that its lower part contained target cells but the upper part did not.
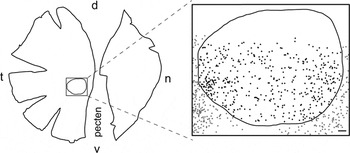
In the two montaged retinas, images were used to generate maps in which every target cell within the area centralis and its immediate surroundings was marked (Fig. 3). In these two retinas, the total number of target cells within the area centralis was 465 and 421, and in both, a small dorsal region of the area centralis, approximately 25% of the whole, was free of target cells (Fig. 3). At the margins of the area centralis, no abrupt change in target cell density was seen; the distribution of target cells apparently ignores the presence of the area centralis.
Distribution of target cells relative to the area centralis. Outline tracing of a typical flat mounted retina, from which the pecten has been excised, double stained with anti-parvalbumin and CERN-901. A region containing the area centralis is shown expanded on the right. The boundary of the area centralis (line), defined by the absence of rhodopsin, is shown relative to the position of every target cell (dots), identified as large parvalbumin-positive cell bodies in the middle of the inner nuclear layer. The boundary of the area centralis does not represent a discontinuity in the density of target cells, which are clearly present throughout most of it. A small dorsal region, however, roughly above the horizontal midline, is free of target cells. d and v indicate dorsal and ventral, while n and t indicate nasal and temporal in the retina. Scale bar is 200 μm.

Discussion
In this study, we have confirmed that a roughly circular rod-free region, the area centralis, lies approximately in the center of the chicken retina. A previous study drawing this conclusion was based on in situ hybridization of embryonic and newly hatched chicks (Bruhn & Cepko, Reference Bruhn and Cepko1996), whereas in this study, we have used an antibody to rod rhodopsin in 3-week-old chickens. Prior to the study of Bruhn and Cepko (Reference Bruhn and Cepko1996), there was some evidence for an area centralis in the chicken. Slonaker (Reference Slonaker1897) reported a slight thickening of the retina, and Ehrlich (Reference Ehrlich1981) found the highest density of ganglion cells in a region corresponding to the region we describe. This was confirmed in a later study (Straznicky & Chehade, Reference Straznicky and Chehade1987) examining the developmental mechanisms by which this region acquires its relatively higher ganglion cell density. Looking at newly hatched and embryonic chicks, Morris (Reference Morris1982) described a node, corresponding to the center of the area centralis, around which the cells in the inner nuclear layer are radially organized. This structure, which Morris termed an aster, can only be seen at the level of the inner nuclear layer and is probably the result of subtle differences in the orientation of bipolar cell axons and Muller cell processes. An advantage of defining the area centralis as an area of rod exclusion, as we have in this study, is that the region is sharply defined, whereas the retinal ganglion cell density, while clearly higher in the area centralis, shows no obvious discontinuity (Ehrlich, Reference Ehrlich1981; Straznicky & Chehade, Reference Straznicky and Chehade1987).
Our use of an antibody to parvalbumin confirms that target cells are confined to the ventral retina (Catsicas et al., Reference Catsicas, Catsicas and Clarke1987a; Cellerino et al., Reference Cellerino, Novelli and Galli-Resta2000) and is consistent with the similar distribution described for efferent fibers from the ION (Catsicas et al., Reference Catsicas, Thanos and Clarke1987b; Fritzsch et al., Reference Fritzsch, Crapon de Caprona and Clarke1990; Morgan et al., Reference Morgan, Miethke and Li1994) that provide the input to these cells. While a similar general pattern for the distribution of the efferent system is described for the pigeon retina (Hayes & Holden, Reference Hayes and Holden1983), our double staining with antibodies to both parvalbumin and rhodopsin reveals that the efferent system distribution relative to the area centralis in the chicken is different in two regards with respect to that of the pigeon. First, from the distribution shown by Hayes and Holden (Reference Hayes and Holden1983), it appears that the efferent terminals extend higher in the retina than is the case for chicken. In the pigeon, the area centralis is entirely surrounded by efferent terminals, whereas in chicken, the area centralis extends slightly into the dorsal region from which the efferent system is excluded.
The second and more important difference is that target cells are found within the area centralis of the chicken retina, while in the pigeon, efferent fibers are excluded from a 500-μm-diameter region centered on the area centralis (Hayes & Holden, Reference Hayes and Holden1983). Our results go further and show that the area centralis in chicken is in no way special regarding the density of target cells. No discontinuity of target cell density is found at the border of the area centralis, and the upper boundary of target cell distribution continues right through the area centralis, creating a small region of the area centralis from which target cells are absent. Since target cells are the postsynaptic partners of the efferent fibers originating in the ION, we conclude that the function of the efferent system is unrelated to high acuity vision, the function of the area centralis, but is not incompatible with it.
How can these different results be reconciled under the reasonable assumption that these otherwise very similar systems serve the same function in the two species? A possible explanation may lie in a difference in area centralis anatomy. The retina of the pigeon, like that of most birds (Slonaker, Reference Slonaker1897; Walls, Reference Walls1942), has within its area centralis an even more specialized region, a fovea, that occupies a significant fraction of the area centralis. The fovea is a pit characterized by thinning of the retina and very dense packing of cone photoreceptors (Slonaker, Reference Slonaker1897; Yazulla, Reference Yazulla1974; Clarke & Whitteridge, Reference Clarke and Whitteridge1976). Unusually, the chicken possesses no fovea within its area centralis (Morris, Reference Morris1982).
While Hayes and Holden (Reference Hayes and Holden1983) made no mention of the fovea and actually described the region of exclusion as “a circular area about 500 μm diameter centered on the area centralis,” we suggest that it is actually from the fovea that efferent input is excluded in the pigeon. This contention receives a measure of support from the fact that the pigeon fovea has an approximate diameter of 500 μm (Galifret, Reference Galifret1968; Binggeli & Paule, Reference Binggeli and Paule1969; Yazulla, Reference Yazulla1974). It is difficult to define the extent of the pigeon area centralis from published data, but based on the ganglion cell density maps of Binggeli and Paule (Reference Binggeli and Paule1969), we estimate that it is approximately twice the diameter of the fovea contained within it, in which case efferent fibers most likely do enter the pigeon area centralis.
We suggest that in granting priority to the packing of cone photoreceptors, the fovea, unlike the rest of the area centralis, necessarily and unavoidably excludes some other cell types, including target cells and efferent fibers. This does not imply that the function of the fovea and the function of the efferent system, whatever that might be, are incompatible, merely that their structures are not easily compatible.
Several disparate hypotheses have been advanced for the function of the efferent input to the bird retina from the ION. These range from stabilization of gaze (Woodson et al., Reference Woodson, Shimizu, Wild, Schimke, Cox and Karten1995) to those proposals in which regions of the visual field containing salient activity are emphasized (e.g., Catsicas et al., Reference Catsicas, Catsicas and Clarke1987a; Clarke et al., Reference Clarke, Gyger and Catsicas1996; Uchiyama et al., Reference Uchiyama, Nakamura and Imazono1998). The results we describe here for the chicken retina have some implications for function and organization of the efferent system. In particular, since the distribution of target cells is neither more nor less dense in the area centralis of the chicken than the surrounding region, we infer that the efferent system is not specifically associated with either rod or cone function and is compatible with the high acuity function of the area centralis.
Acknowledgment
This work was supported by grants from the National Eye Institute of the National Institutes of Health (EY04112 and EY12576).