I. INTRODUCTION
Wood-derived scaffold structures have received recent attention due to the advantageous thermal and structural properties that result from the retention of the naturally optimized open porous microstructure of the precursor wood.Reference Greil, Lifka and Kaindl1–Reference Kaul, Faber, Sepúlveda, de Arellano López and Martínez-Fernández3 While previous efforts have focused primarily on the development and characterization of biomorphic silicon carbide from wood,Reference Pappacena, Faber, Wang and Porter4–Reference Pappacena, Johnson, Wang, Porter and Faber10 biomorphic graphitic scaffolds are of particular interest due to the attractiveness of porous graphite for use in thermal management devices.Reference Klett, Hardy, Romine, Walls and Burchell11, Reference Gaies and Faber12 Graphitic scaffolds combine low density, low thermal expansion coefficient, and high thermal conductivity, making them ideal candidates for many thermal management applications.Reference Zweben13
A common graphite precursor used for the fabrication of commercial porous graphitic scaffolds is petroleum pitch, which, like several other petroleum-based carbons, is graphitizable upon heat treatment to temperatures ranging from 1700 to 3000 °C.Reference Klett, Hardy, Romine, Walls and Burchell11, Reference Franklin14 When wood carbon is exposed to a similar graphitization heat treatment, turbostratic carbon is produced.Reference Byrne and Nagle15, Reference Cheng, Endo, Okabe, Saito and Zheng16 Unlike graphite, where carbon layers have well defined stacking and a regular planar spacing (3.354 Å), turbostratic carbon is composed of misoriented carbon layers with a distribution of planar spacings greater than that of ideal graphite.Reference Oya and Marsh17 Due to the formation of turbostratic carbon under graphitization heat treatment conditions, wood and other cellulose-based materials are considered to be nongraphitizable or hard carbons.Reference Byrne and Nagle15–Reference Ishimaru, Hata, Bronsveld and Imamura18
To enhance ordering in nongraphitizable carbons, catalytic treatments have been developed that utilize transition metal elements such as iron,Reference Sinclair, Itoh and Chin19, Reference Sevilla, Sanchís, Valdés-Solís, Morallón and Fuertes20 cobalt,Reference Sinclair, Itoh and Chin19, Reference Derbyshire, Presland and Trimm21 nickel,Reference Sinclair, Itoh and Chin19–Reference Derbyshire, Presland and Trimm21 and copperReference Yokokawa, Hosokawa and Takegami22 to promote the formation of graphitic carbon at pyrolysis temperatures as low as 500 °C.Reference Sinclair, Itoh and Chin19 Using the excess free energy of disordered carbon as a driving force, a carbide phase formed from the catalyst species moves preferentially through the disordered carbon structure, consuming disordered carbon and precipitating graphite crystallites.Reference Fischbach and Walker23 While several of these catalyst methods have shown promise in affecting the formation of graphite in nongraphitizable carbons, they have only been evaluated for use on synthetic structures (e.g., thin films on the order of 100 nmReference Sinclair, Itoh and Chin19 and aerogels containing catalysts introduced during gel synthesisReference Maldonado-Hódar, Moreno-Castilla, Rivera-Utrilla, Hanzawa and Yamada24) and powdered cellulosic materials (e.g., sawdustReference Sevilla, Sanchís, Valdés-Solís, Morallón and Fuertes20). Due to the complex natural microstructure of wood precursors, and the inability to incorporate catalyst species during scaffold growth, new methods are necessary to obtain graphitic structures that retain the unique porous geometries of the natural precursor materials.
For this work, a nickel-based catalytic processing technique is applied to two wood precursors. The resulting carbons are evaluated to determine microstructural characteristics as well as the extent of graphitization. Wood species, catalyst exposure time, and pyrolysis temperature are evaluated to determine their effects on the graphitization of three-dimensional natural wood precursors.
II. EXPERIMENTAL METHODS
A. Processing of graphitic scaffolds
Wood-derived graphitic scaffolds were produced from two species: red oak (Quercus rubra) and beech (Fagus sylvatica). Samples were first cut into cubes measuring 2 cm per side, then allowed to dry thoroughly in an oven maintained at 100 °C. A 4.25 M catalyst solution was prepared using nickel (II) nitrate (Alfa Aesar, Ward Hill, MA) and deionized water. The solution was allowed to mix completely, and then the dried wood samples were added. Air was evacuated using a vacuum chamber to ensure infiltration of the wood pore space. Samples were allowed to soak in solution for a prescribed time, ranging from 4 to 120 h. Following the solution treatment, wood cubes were removed and dried, first for 24 h in air, followed by 7 days in a vacuum-assisted drying oven maintained at 100 °C. Weight change was monitored as a function of time by comparing pre-exposure and post-exposure weights for each specimen.
Nickel processed samples were graphitized in a pyrolysis heat treatment carried out in a nitrogen atmosphere. Cubes were loaded into alumina boats and packed with granular silica to promote even heating. Pyrolysis was carried out at 1000 °C or 1600 °C with a soak time of 6 h. A ramp rate of 3 °C/min was used for both heating and cooling, and nitrogen flow was maintained at ~1 sLpm. To demonstrate the removal of catalyst postpyrolysis, selected samples were stirred in a 37% HCl solution for 2 h to reform a soluble Ni salt that was then rinsed with deionized water overnight prior to analysis. Additional untreated samples of each species were pyrolyzed for comparison.
Analysis of nickel treated graphitized samples was compared against pyrolyzed wood samples that had not undergone a nickel pretreatment as well as a reference standard prepared from a commercially available pitch derived graphite (Poco Graphite, Inc., Decatur, TX). Specific processing parameters for the latter can be found elsewhereReference Klett28; in brief, after foaming with an inert gas and carbonization at 1050 °C, graphitization was carried out 2800 °C.
B. Characterization methods
Scanning electron microscopy (Hitachi S-3400-II SEM, Hitachi, Pleasanton, CA) was used for microstructural evaluation of pyrolyzed scaffolds. Sample porosity and density were determined post-pyrolysis using Archimedes’ buoyancy technique.25
Samples were evaluated to determine the dependence of catalyst exposure time, pyrolysis temperature, and wood species on the degree of graphitization. Unless otherwise stated, samples were sectioned and characterized along their midplane to assess the efficacy of the process away from the outer surface. X-ray diffraction (XRD) was used to determine the crystallinity of samples while Raman spectroscopy was used to evaluate the type and extent of structural disorder in the carbon product. XRD was performed using a Rigaku ATX-G diffractometer (Rigaku Americas, Woodlands, TX) operating at 50 kV and 240 mA using Cu Kα radiation (1.54 Å) in θ-2θ geometry. An internal silicon standard was used for normalization purposes; however, for clarity these diffraction peaks were subsequently removed. Raman spectra were collected using an Acton TriVista CRS Confocal Raman System (Princeton Instruments, Trenton, NJ) using a Stabilite 2018-RM argon/krypton ion laser (Spectra-Physics, Santa Clara, CA) of wavelength 514.5 nm. For each scaffold examined, five Raman spectra were collected from each of five sample regions, the average of which was then taken to be representative of the entire sample.
Transmission electron microscopy (TEM, JEOL JEM-2100 FasTEM, JEOL USA, Inc., Peabody, MA) was performed on a series of Ni-treated samples to determine the effect of graphitization temperature on the morphology of the resulting carbon grains. Samples were prepared by grinding pyrolyzed wood carbons with a mortar and pestle and passing the resulting powder through a 38 μm mesh sieve. The powdered carbon was then dispersed in ethanol and ultrasonicated for 3 h. Following sonication and a 15-min pause to allow larger particulates to settle, the ethanol and powdered carbon solution was deposited via pipette onto a silicon nitride TEM sample holder and allowed to dry. In addition to imaging, selected area electron diffraction (SAED) and electron energy loss spectroscopy (EELS) were used to evaluate the crystallinity and electronic structure of carbon grains.
X-ray photoelectron spectroscopy (XPS, Omicron ESCA Probe, Omicron NanoTechnology GmbH, Taunusstein, Germany) was used to determine sp 3/sp 2 concentration ratios for wood carbons produced under optimized conditions according to XRD and Raman results. After decomposing the C1s photoemission spectra into sp 3 and sp 2 contributions, the peak intensities are proportional to atomic densities and a ratio may be calculated.Reference Díaz, Paolicelli, Ferrer and Comin26, Reference Filik, May, Pearce, Wild and Hallam27 XPS was performed in a UHV chamber with an Al Kα source. Curve fitting was performed iteratively using the XPSpeak 4.1 software package and sp 2/sp 3 peak positions were determined by reference standards.
III. RESULTS AND DISCUSSION
A. Catalyst deposition and microstructural analysis
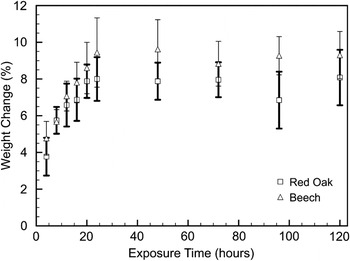
By comparing the mass of wood samples before and after catalyst treatment, the deposition of the nickel catalyst may be evaluated as a function of exposure time. Figure 1 depicts the findings for both red oak and beech woods. For approximately the first 24 h of exposure, a steady increase in weight is evident. Although the magnitude of this change varies slightly between species, the rates of change for both wood precursor types are similar at about 0.25 wt%/h. After the first 24 h, however, the change in weight remains nearly constant, implying that a maximum of catalyst deposition has been reached and that further exposure would not lead to further nickel deposition.
Sample weight change plotted as a function of exposure time for beech and red oak immersed in a 4.25 M nickel nitrate catalyst solution. Error bars represent 1 SD.

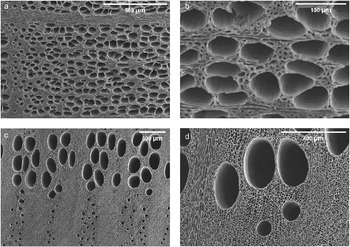
Shown in Fig. 2 are SEM micrographs of beech-derived [Figs. 2(a, b)] and red-oak-derived [Figs. 2(c, d)] carbon samples after nickel treatment and 1600 °C pyrolysis. In both cases, the pore structure of the parent wood type is retained through the pyrolysis process. Both large-diameter vessel cells, on the order of 100 μm, and smaller traechid cells, on the order of 10 μm, are visible.
Representative scanning electron micrographs of (a, b) beech-derived graphite and (c, d) red-oak-derived graphite, pyrolyzed to 1600 °C after 120 h of catalyst exposure.

Porosities, determined by Archimedes’ method for both wood types at each pyrolysis condition, are listed in Table I. Although both wood types produce carbons with similar porosities, as is evident from SEM micrographs, scaffolds produced from different species possess pores of varying size and distribution. Furthermore, porosity volume fractions appear to be independent of pyrolysis temperature. Previous studies using mercury intrusion porosimetry to evaluate porosity and pore size distribution indicate that the pyrolysis process is complete after heat treatment to ~700 °C and negligible additional changes to microstructure occur.Reference Pappacena, Gentry, Wilkes, Johnson, Xie, Davis and Faber29 This observation is in agreement with thermogravimetric analysis (TGA) performed on similar wood species, as reported elsewhere, which show complete decomposition after heating to ~600 °C.Reference Byrne and Nagle15
Porosities, in vol%, determined from the Archimedes method for beech and red oak samples, treated as specified. Ranges represent ± 1 SD.

B. XRD and Raman spectroscopy characterization
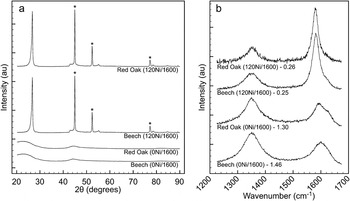
Using XRD and Raman spectroscopy, post-pyrolysis samples were evaluated to determine the nature of carbon crystallinity as well as the extent of remaining structural disorder. Shown in Fig. 3 are XRD profiles and Raman spectra for beech and red oak samples with either no catalyst exposure (0Ni) or 120 h (120Ni) of catalyst exposure, which have been pyrolyzed to 1600 °C. Both nickel-containing samples show graphitization upon heat treatment as evidenced by the strong (002) reflection at 2θ = 26.6° observed in the XRD pattern in Fig. 3(a). Here, in contrast to nickel-free samples which show an amorphous diffraction pattern, nickel-containing samples show characteristic graphitic diffraction peaks.
(a) X-ray diffraction and (b) Raman spectroscopy species comparison for beech and red oak woods after exposure to nickel catalyst for 0 h (0Ni) or 120 h (120Ni), pyrolyzed to 1600 °C. Nickel diffraction peaks are marked by (★) and Raman I D/I G area ratios are included for reference.

Figure 3(b) again shows a transition from highly disordered carbon in samples prepared without nickel catalyst to graphitic carbon with greater ordering in samples prepared with the catalyst species. Raman spectra of carbon materials are composed of four first-order Raman bands, each arising from different vibratory modes.Reference Tunistra and Koenig30 In a graphitic material, the most prominent band, the G-band, is located near 1580 cm−1 and represents lattice vibration in an ideal graphitic lattice. With increasing structural imperfection, disorder (D) bands appear. The D1 (1350 cm−1), D2 (1620 cm−1), and D3 (1500 cm−1) bands represent vibrations from graphene layer edges, surfaces, and amorphous regions, respectively.Reference Sadezky, Muckenhuber, Grothe, Niessner and Pöschl31 The band positions, full widths at half maximum, and peak intensity ratios of the prominent G and D1 bands are indicators of the degree of graphitic content.Reference Sevilla, Sanchís, Valdés-Solís, Morallón and Fuertes20 In Fig. 3(b), samples from both wood species pyrolyzed with nickel catalyst show well-defined graphitic Raman features with smaller disorder contributions when compared to noncatalyzed samples.
When XRD patterns and Raman spectra are compared for beech and red oak woods, similar graphitization behavior is observed in the presence of the nickel catalyst. This result is to be expected since all wood species are composed of the same three carbon-based components—cellulose, hemicellulose, and lignin.Reference Dinwoodie32 Based upon XRD and Raman data, the pyrolysis and graphitization behavior of these carbon-containing precursors in the presence of nickel catalyst is independent of wood species, affording the ability to tailor scaffold microstructure with wood precursor choice.
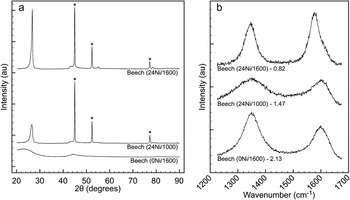
To determine graphitization temperature dependency, beech samples were exposed to the catalyst solution for 24 h then pyrolyzed to 1000 or 1600 °C. The resulting XRD and Raman spectra are summarized in Fig. 4. Although the sample pyrolyzed to 1000 °C shows the onset of graphitic crystallinity, increasing the heat treatment temperature to 1600 °C yields diffraction peaks with increased kurtosis, indicative of greater crystalline ordering. Raman data show a similar trend with graphitic (G) contributions increasing with respect to disordered (D1–D3) contributions.
(a) X-ray diffraction and (b) Raman spectroscopy pyrolysis temperature comparison of three beech samples exposed to nickel catalyst for 0 h (0Ni), or 24 h (24Ni) and pyrolyzed to either 1000 or 1600 °C. Nickel diffraction peaks are marked by (★) and Raman I D/I G area ratios are included for reference.

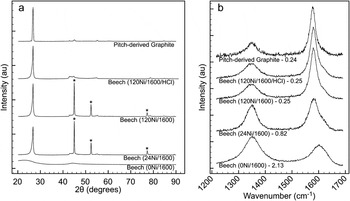
By comparison, Fig. 5 shows diffraction profiles and Raman spectra for three beech wood samples, each graphitized at 1600 °C for 5 h, but with different durations of nickel treatment. While both nickel-treated samples, 24 and 120 h, show graphitic crystallinity with XRD, differences are observed in Raman spectra. The 24-h sample shows a moderate G-band contribution; however, the D1 and D2 bands remain relatively strong. With additional exposure time, the 120-h sample shows a dominant G-band with smaller disorder contributions.
(a) X-ray diffraction and (b) Raman spectroscopy catalyst exposure time comparison of three beech samples, exposed to nickel catalyst for 0 h (0Ni), 24 h (24Ni), or 120 h prewash and postwash (120Ni and 120Ni/HCl) and pyrolyzed to 1600 °C. For comparison, a pitch-derived graphite is included. Nickel diffraction peaks are marked by (★) and Raman I D/I G area ratios are included for reference.

Although both nickel-containing samples heat-treated to 1600 °C show similar XRD results, differences in Raman data imply that the additional catalyst deposition time has produced a graphite with larger disorder-free regions and fewer surface and edge disruptions. Although weight change studies (Fig. 1) indicate that there is no significant difference in deposited catalyst quantity as a function of exposure time, Raman data reveal a difference in graphitization behavior. When taking into account sample microstructure, longer deposition time may allow catalyst infiltration into finer pore spaces that would improve graphitization while having minimal influence on observed weight change.
Also included in Fig. 5 are XRD and Raman data for the pitch-derived graphite standard and beech-derived graphite after nickel removal. According to XRD, the heat treatment graphitization of pitch yields a highly crystalline graphite with negligible turbostratic or amorphous components. However, Raman spectra reveal a small edge disorder contribution (D1, 1350 cm−1) resulting from the polycrystalline nature of the graphitized pitch. Overall, the disorder remaining in the structure of the graphitized pitch appears on par with that observed in the wood-derived graphite under optimized catalyst exposure and heat treatment conditions. Acid washing successfully removes residual nickel, revealing the graphite (101) diffraction peak, previously concealed by the nickel (111) diffraction peak. The comparison of Raman spectra pre- and post-acid-wash shows no change in graphitic disorder during nickel removal.
C. TEM and EELS analysis
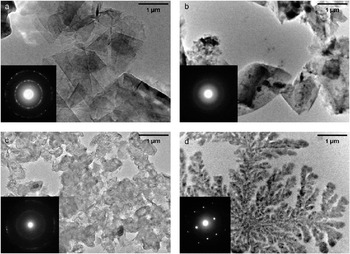
Shown in Fig. 6 are TEM images and corresponding SAED patterns for a graphite standard material [Fig. 6(a)] as well as three carbon samples prepared from beech wood—an untreated sample pyrolyzed to 1600 °C, and two nickel treated samples pyrolyzed to 1000 and 1600 °C [Figs. 6(b)–6(d), respectively]. Beginning with the standard material, a clear platelike grain structure with a polycrystalline diffraction pattern indicative of graphite is evident. By contrast, the untreated beech sample lacks platelike structure and shows an amorphous diffraction pattern, in agreement with previous amorphous XRD results. With nickel treatment and 1000 °C pyrolysis, the carbon grains remain nonuniform in shape; however, the onset of crystallization is evident from the emergence of discrete diffraction rings in the SAED pattern. With higher heat-treatment temperature, the resulting carbon takes on a dendritic appearance with relatively large crystal regions as indicated by the SAED pattern. The pyrolysis temperature for this sample, 1600 °C, is in excess of the melting point of nickel, 1455 °C.Reference Smith33 At this elevated pyrolysis temperature, precipitation of graphite from localized areas of liquid phase has allowed for the crystallization of dendrite-like regions, absent from observations of samples pyrolyzed at lower temperatures.
Transmission electron micrographs and selected area diffraction patterns (inset) of (a) polycrystalline graphite standard; (b) untreated beech wood, pyrolyzed to 1600 °C; (c) beech wood exposed to nickel catalyst for 120 h, pyrolyzed to 1000 °C; and (d) beech wood exposed to nickel catalyst for 120 h, pyrolyzed to 1600 °C.

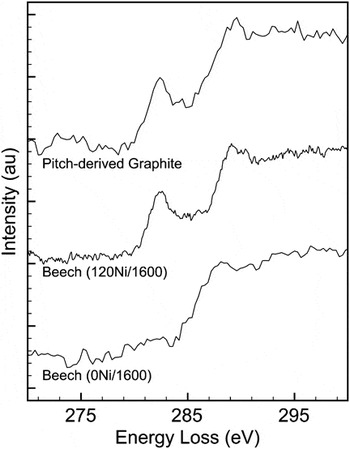
EELS spectra taken of the carbon edges of three materials—a commercial pitch-derived graphite, beech wood pyrolyzed to 1600 °C without catalyst exposure, and beech wood pyrolyzed to 1600 °C after 120 h of catalyst exposure—are shown in Fig. 7. After background correction, the fine edge structure of graphitic samples reveal a contribution from the carbon π* orbital near an energy loss of 284 eV. This feature, not visible in amorphous carbons, arises due to the excitation of carbon K-shell electrons to an anti-bonding π* orbital.Reference El-Barbary, Trasobares, Ewels, Stephan, Okotrub, Bulusheva, Fall and Heggie34 In Fig. 7, this π* contribution is evident in beech wood pyrolyzed with catalyst as well as the pitch-derived graphite but absent from the nongraphitic beech wood without nickel exposure.
Near-edge EELS spectra for a pitch-derived graphite standard, beech wood pyrolyzed to 1600 °C with 120 h of catalyst exposure (120Ni/1600), and beech wood pyrolyzed to 1600 °C with no catalyst exposure (0Ni/1600). Spectra are offset for a visual aid, and background signals have been subtracted, leaving only the carbon portion of the spectrum.

D. XPS analysis
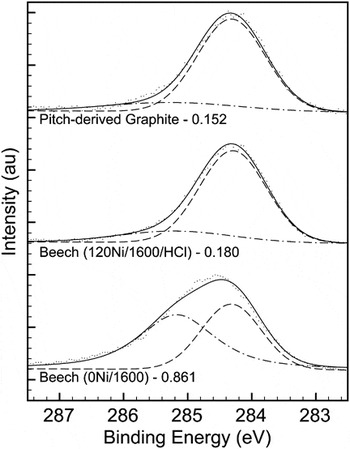
Shown in Fig. 8 are representative C1s XPS spectra and the resulting curves fit for sp 2 and sp 3 carbon for two beech wood samples, both pyrolyzed at 1600 °C, one with nickel treatment and wash and one without treatment, as well as the pitch-derived graphite standard. For fitting purposes, reference samples were used to determine the location of sp 2 (284.2 eV) and sp3 (285.1 eV) spectrum contributions.
Carbon 1s XPS spectra for a pitch-derived graphite standard, beech wood pyrolyzed to 1600 °C with 120 h of catalyst exposure (120Ni/1600), and beech wood pyrolyzed to 1600 °C with no catalyst exposure (0Ni/1600). Spectra are offset for a visual aid; hashed lines indicate sp 2 and sp 3 contributions with the combined fit shown as a solid line and sp 3/sp 2 ratios are included for reference.

As can be seen in the figure, the proportion of sp 3 to sp 2 carbon is similar in both the pitch-derived graphite and the beech processed with nickel. In both cases, an sp 3 contribution remains, likely resulting from the polycrystalline nature of both carbon materials and edge disorder similar to that observed in Raman spectroscopy results. In the beech sample pyrolyzed without nickel, sp 2 and sp 3 carbon are observed in similar proportions, as is expected for an amorphous material.
With an x-ray spot size approximately 1 mm in diameter, XPS effectively probes large sample regions, including both cell walls of both large and small porosity and neighboring solid regions. Comparing the sp 3/sp 2 ratios for each carbon shows a similar degree of graphitization in both the pitch-derived carbon and wood pyrolyzed with nickel catalyst.
By combining XPS with previously described XRD, Raman, and TEM results, the structure of catalytically graphitized wood carbon may be accurately determined. Using XRD alone, the effect of nickel catalysis appears solely dependent on the kinetics of heat treatment. However, Raman spectroscopy reveals a connection between the duration of catalyst exposure and the retention of structural disorder after graphitization, which is not directly evident from other evaluation techniques. EELS and XPS data provide further validation by directly comparing types of carbon bonding. And finally, only TEM imaging and selected area diffraction patterns indicate differences in the morphology of crystalline graphite grown from solid and liquid phases due to heat-treatment temperature.
IV. CONCLUSIONS
Graphitization using a transition metal catalysis technique has been adapted to work with a three-dimensional, anisotropically porous, natural wood scaffold. Using a liquid catalyst as a carrier to infiltrate wood porosity, graphitic ordering was observed in an otherwise nongraphitizable carbon upon pyrolysis heat treatment and the processing temperature window of graphitization was lowered to a more manageable 1000–1600 °C. X-ray diffraction, Raman spectroscopy, TEM, and XPS methods were used to evaluate the crystallinity and disorder present in resulting carbons as a function of wood precursor, catalyst deposition time, and heat treatment temperature. Although graphitization was determined to be independent of wood precursor, both longer catalyst exposure time and higher graphitization temperature produced a more ordered graphitic carbon. Wood-derived carbon produced after 120 h of catalyst exposure and 1600 °C heat treatment showed graphitic ordering comparable to that of the pitch-derived graphite reference.
ACKNOWLEDGMENTS
This work was funded by the National Science Foundation (DMR-0710630). The SEM, TEM, and Raman spectroscopy work was performed in the EPIC and Keck-II facilities of NUANCE Center at Northwestern University. NUANCE Center is supported by NSF-NSEC, NSF-MRSEC, the Keck Foundation, the State of Illinois, and Northwestern University. This work made use of the J.B. Cohen X-ray Diffraction Facility supported by the MRSEC program of the National Science Foundation (DMR-0520513) at the Materials Research Center of Northwestern University.