I. INTRODUCTION
Considerable research efforts have been focused on the investigation of zinc oxide (ZnO) as an alternative material to gallium nitride (GaN) in light-emitting devices because of its unique optoelectronic properties. These include tuneable emissions over a broad spectral range, high luminescence efficiency, large carrier mobility, and the largest exciton binding energy among II–VI compounds.Reference Ozgur, Alivov, Liu, Teke, Reshchikov, Dogan, Avrutin, Cho and Morkoc1, Reference Ton-That, Phillips, Foley, Moody and Stampfl2 Undoped ZnO typically exhibits n-type conductivity—a fact that, despite numerous theoretical and experimental studies, is still an issue of debate. Calculations based on density functional theory (DFT) by Van de Walle et al.Reference Janotti and Van de Walle3, Reference Van de Walle4 indicated that interstitial hydrogen (Hi) and hydrogen trapped at an oxygen vacancy (HO) can act as two shallow donors, which can be a cause of n-type conductivity in ZnO. These results have been supported by experiments, which showed that the n-type conductivity can be enhanced via the incorporation of H from a H2 ambient.Reference Cai, You, Zhang, Dong, Yang, Yin and Chen5, Reference Zhou, Kato, Komaki, Yoshino, Yukawa, Morinaga and Morita6 Further studies using Raman, infrared (IR) absorption and photoluminescence spectroscopy were able to identify two occupation sites: bond-centered and oxygen vacancy bound hydrogen with donor ionization energies of 53 and 47 meV, respectively.Reference Lavrov, Borrnert and Weber7–Reference Shi, Stavola, Pearton, Thieme, Lavrov and Weber9 As a reactive and common impurity, understanding the role of hydrogen in ZnO is not only of fundamental interest but also of technological importance.
It has been reported that the near-band-edge (NBE) luminescence efficiency in ZnO bulk and nanostructures can be significantly enhanced at the expense of deep-level (DL) emissions after hydrogen incorporation.Reference Sekiguchi, Ohashi and Terada10–Reference Dev, Niepelt, Richters, Ronning and Voss12 This enhancement of the NBE emission has been attributed to H shallow donors, which give rise to an additional recombination channel at the NBE and passivate competitive recombination pathways.Reference Dev, Niepelt, Richters, Ronning and Voss12 Although the origins of DL emissions in ZnO are still not thoroughly understood, the quenching of DL emissions suggests that hydrogen interacts with native defects in some way. There have been reports of a stable hydrogen-related complex formed by zinc vacancy (VZn) acceptor and two H atoms.Reference Lavrov, Weber, Borrnert, Van de Walle and Helbig13 In this paper, H is incorporated into ZnO crystals and the effects of electron irradiation are investigated using cathodoluminescence (CL) microanalysis and spectroscopy. A significant advantage of scanning electron microscopy (SEM)-based CL is the ability to probe both pre-existing and irradiation-induced local variations of luminescence properties with high spatial (lateral and depth) resolution and sensitivity. Characterization of irradiation sensitive H-doped ZnO is essential as many advanced technological applications operate in a high electron injection regime, allowing optimization of the design and operation of ZnO-based devices. To the best of our knowledge, this is the first study on the luminescence properties of H-doped ZnO under the influence of irradiation.
II. EXPERIMENTAL DETAILS
Two specimens from a hydrothermally grown c-plane ZnO crystal (MTI Corp., Richmond, CA) were used in this study. The crystal was polished with surface roughness <1 nm. One specimen was treated with hydrogen plasma (H-plasma), while the other was kept as a reference. Hydrogen incorporation was achieved by exposure to gentle radio frequency H-plasma (15 W power, 0.1 mbar hydrogen pressure). The specimen was kept at 200 °C during H-plasma treatment. X-ray diffraction revealed no significant difference in crystal structure following H-plasma. CL was performed using a FEI Quanta 200 SEM (FEI Corp., Hillsboro, OR) equipped with a liquid nitrogen cold stage and an Ocean Optics SD2000 Diode Array Spectrometer (Ocean Optics, Dunedin, FL). This spectrometer facilitates parallel spectra acquisition using a 2048-element linear silicon charge-coupled device array, enabling a full CL spectrum (200–1100 nm) to be acquired within 5 s. The electron beam current was measured using a Faraday cup. Spectra were collected in wave length, corrected for the spectral response of the spectrometer, and converted to energy as CL emission bands generally have a Gaussian profile.Reference Yacobi and Holt14
III. RESULTS AND DISCUSSION
A. Effects of hydrogen incorporation on the luminescent properties
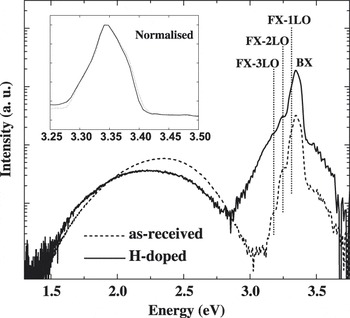
Figure 1 shows the CL spectra (15 kV, 0.8 nA) of ZnO at 80 K before and after exposure to 60-s H-plasma. The CL spectrum of as-received ZnO consists of a NBE emission at 3.35 eV, which is dominated by donor-bound excitons (BX).Reference Reynolds, Look, Jogai and Morkoc15 Free exciton (FX) emission is strongly suppressed due to the strong self-absorption of the line, but its longitudinal optical (LO) phonon replicas (FX—1LO, FX—2LO, and FX—3LO) are identifiable, with an energy separation of 72 meV, in accord with the previously measured value.Reference Maeda, Sato, Niikura and Fukuda16 The intensity of the NBE increases more than 5-fold after 60-s H-plasma treatment. Although BX lines are not resolvable for the MTI crystal, it is clear that the NBE spectral shape and features are unaffected by H incorporation (inset of Fig. 1).
CL spectra (15 keV, 0.8 nA) obtained at 80 K for the ZnO crystal before and after 60-s H-plasma. The spectrum consists of a NBE emission at 3.35 eV and a broad defect-related luminescence band. The NBE intensity increases more than 5-folds after hydrogen doping. Inset shows the NBE peaks that were normalized to the same peak height, revealing an identical line shape.

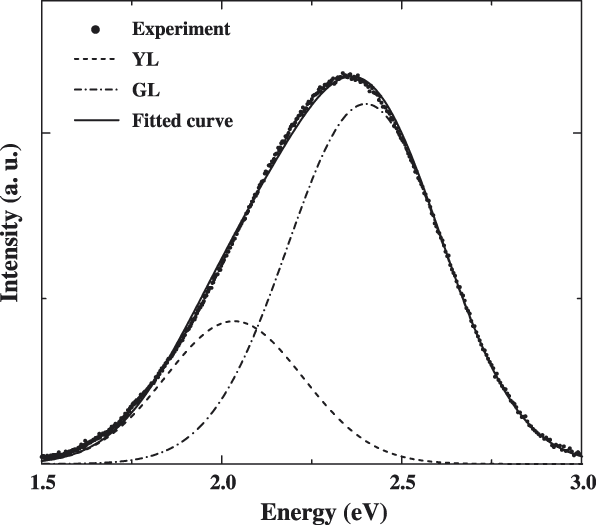
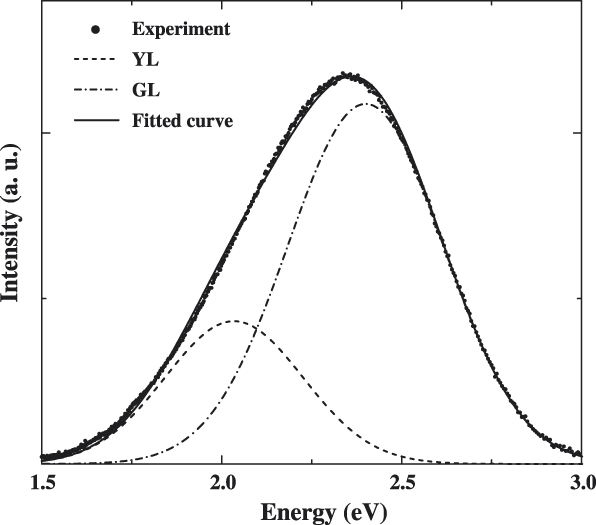
In addition to the NBE, the CL spectrum of as-received ZnO includes a broad unstructured DL band peaked at 2.35 eV. After H incorporation, this band decreases in intensity and redshifts. The DL band can be adequately fitted by two Gaussian functions using a nonlinear least-squares technique: green luminescence (GL) centered at 2.41 eV and yellow luminescence (YL) at 2.04 eV, with a full width at half maximum (FWHM) of 0.41 and 0.35 eV, respectively. An example of the fit is shown in Fig. 2. The fitted peak positions and FWHMs are in accord with previous reports on the GL and YL in ZnO.Reference Wang, Lau, Zhang, Lee, Yu, Tay and Hng17, Reference Hoffmann, Malguth, Meyer, Klingshirn, Meyer, Waag, Hoffmann and Geurts18 At 80 K, thermal broadening is dominant in influencing the peak width, the greater FWHM for the GL suggests a higher degree of coupling to lattice vibrations as their spectral widths are dominated by coupling to the longitudinal optical phonon.Reference Reynolds, Look, Jogai and Morkoc15 The fitting of two Gaussian components is adequate for the DL band in both as-received and H-doped ZnO crystals as assessed visually and statistically. Li is present in hydrothermally grown ZnO with the concentration ∼1018 cm−3 (Refs. Reference Maeda, Sato, Niikura and Fukuda16 and Reference Hoffmann, Malguth, Meyer, Klingshirn, Meyer, Waag, Hoffmann and Geurts18) and acts as a deep acceptor in donor–acceptor pair recombination as the mechanism responsible for the YL if Li occupies a Zn site.Reference Hoffmann, Malguth, Meyer, Klingshirn, Meyer, Waag, Hoffmann and Geurts18, Reference Rauch, Gehlhoff, Wagner, Malguth, Callsen, Kirste, Salameh, Hoffmann, Polarz, Aksu and Driess19
Typical fit of the defect-related band for as-received (undoped) crystal using two Gaussian components centered at 2.41 eV (green, GL) and 2.04 eV (yellow, YL).
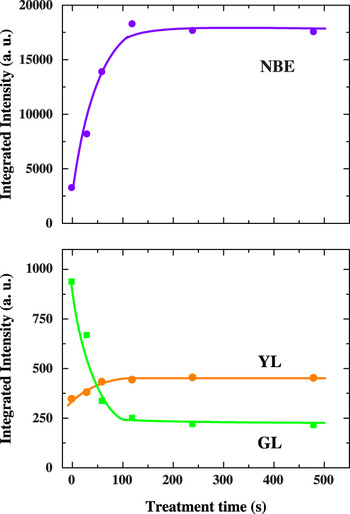
The integrated intensities of the NBE, GL, and YL emissions are presented in Fig. 3 as a function of H-plasma time. As the treatment time increases, the NBE emission becomes more intense, while the GL is sharply reduced. Within the first 120 s, the NBE peak intensity increases 6-fold before reaching a plateau. The crystal is n-type with a room temperature carrier concentration averaging 2.5 × 1014 cm−3 and increasing to 9.1 × 1014 cm−3 upon H incorporation. The GL dominates the DL band for as-received ZnO but is sharply quenched within the first 120 s, whereas the YL is virtually unaffected by H-plasma (the slight initial increase is due to the removal of competitive recombination channels). The quenching of the GL suggests that its underlying centers are passivated by hydrogen. With decreasing temperature to 10 K, the GL band remains structureless (not shown), indicating that this emission is not associated with Cu impurityReference Garces, Wang, Bai, Giles, Halliburton and Cantwell20 but originates from intrinsic point defects. The GL in Cu-free ZnO has been frequently assigned to zinc/oxygen vacancies (VZn/VO).Reference Dong, Tuomisto, Svensson, Kuznetsov and Brillson21 Positively charged H+ would interact favorably with VZn, known to exist as a double acceptor with a charge state 2−,Reference Lavrov, Weber, Borrnert, Van de Walle and Helbig13 rather than VO donor. First-principles calculations have predicted that hydrogen passivates VZn by formation of a thermodynamically stable VZnH2 complex.Reference Lavrov, Weber, Borrnert, Van de Walle and Helbig13 The fact that the YL remains fairly constant regardless of H-plasma time supports the assignment that this emission originates from a donor–acceptor pair recombination involving neutral Li,Reference Maeda, Sato, Niikura and Fukuda16, Reference Hoffmann, Malguth, Meyer, Klingshirn, Meyer, Waag, Hoffmann and Geurts18 which is consistent with the deep nature of LiZn.Reference Lopatiuk, Chernyak, Osinsky and Xie22 Previous experiments based on IR absorption suggested the existence of Li–OH complex when hydrogen is introduced into ZnO crystals by thermal annealing in a H2 atmosphere.Reference Shi, Stavola and Fowler23, Reference Johansen, Christensen, Monakhov, Kuznetsov and Svensson24 It is worth noting that the sample temperature during H-plasma doping in this study is much lower than in those studies and that the capturing efficiency of H by LiZn is highly sensitive to annealing conditions.Reference Johansen, Haug, Lund, Monakhov and Svensson25 The increase in the NBE following H incorporation might be attributed to the following mechanisms: (i) introduction of additional radiative recombination channels via neutral donor BX emission at H-related shallow donor states, known as the I4 line,Reference Meyer, Alves, Hofmann, Kriegseis, Forster, Bertram, Christen, Hoffmann, Strassburg, Dworzak, Haboeck and Rodina26 (ii) elimination of the competitive radiative recombination channel by the formation of H complexes with the GL center, and (iii) passivation of competitive nonradiative defects. The I4 line has recently attributed to HO donor with an ionization energy of 47 meV.Reference Lavrov, Herklotz and Weber8 However, the I4 line cannot be responsible for the enhancement of the NBE emission since the peak shape remains unchanged following H-plasma doping (inset of Fig. 1). In addition, the first mechanism cannot be dominant as we observed a negative thermal quenching behavior in H-doped ZnO in which the NBE intensity is gradually enhanced as temperature is raised from 150 to 300 K. The H-related shallow donors would become increasingly unavailable for radiative recombination with increasing temperature as a result of thermal ionization, thus they cannot account for the enhanced NBE. The passivation of defects provides the best explanation for the improvement of the NBE.
Integrated CL intensities of the NBE, GL, and YL emissions plotted as a function of H-plasma treatment time. The NBE emission increase 6-fold in intensity and approaches a plateau after 120-s treatment, while the GL is quenched by a factor of nearly four over the same period.

B. Electron irradiation-induced migration of hydrogen
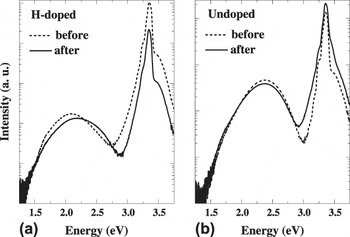
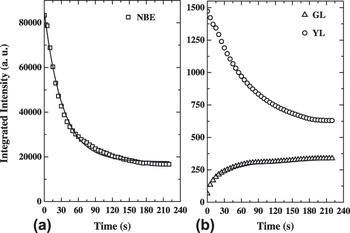
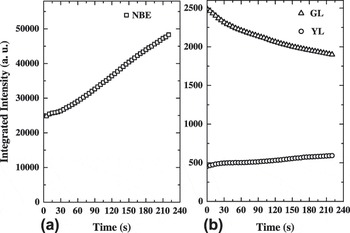
The stability of implanted H from the H-plasma treatment was investigated by CL kinetics under intense e-beam irradiation (15 kV, 360 nA). Figure 4 shows the spectra of as-received (undoped) and 120-s-treated ZnO crystals before and after e-beam irradiation for 220 s. The NBE emission of the H-doped ZnO decreases remarkably upon being irradiated by a stationary beam, with a 5-fold drop in intensity after 220-s irradiation, while the DL band shows a blue shift from 2.10 to 2.21 eV. In contrast, the NBE of undoped ZnO increases slightly in intensity upon irradiation, while the DL band is minimally affected. Figure 5 shows the CL kinetic curves of the NBE, GL, and YL of the H-doped ZnO. E-beam irradiation reverses the effects of hydrogen doping. The NBE decreases rapidly in the first 60 s of irradiation and approaches a plateau after 180 s. The time dependence of the NBE intensity is well described by a single exponential with a decay constant of 33 s, suggesting a diffusion-limited transport mechanism (discussed further below). The intensity of the GL increases with e-beam irradiation time reflecting the reactivation of the underlying luminescence centers, whereas the YL shows a strong reduction. To verify that these dramatic changes in the luminescence are related to implanted hydrogen, kinetic traces were also acquired on reference undoped ZnO under identical e-beam conditions (Fig. 6). In contrast to the H-doped ZnO, undoped specimen exhibits a small improvement of the NBE emission, while its GL shows a reduction over the irradiation period 0–220 s.
CL spectra (15 keV, 0.8 nA) obtained at 80 K for the H-doped (a) and reference undoped ZnO (b) before and after 220-s e-beam irradiation.

Integrated CL intensities of the NBE (a) and DL emissions (b) for 120-s-treated H-doped ZnO as a function of e-beam irradiation time (stationary beam 15 keV, 360 nA). The curve is the best fit to a single exponential with a decay constant of 33 s.

Integrated CL intensities of the NBE and DL emissions for reference undoped ZnO as a function of e-beam irradiation time (stationary beam 15 keV, 360 nA).

We attribute the rapid dramatic decrease in the H-doped ZnO NBE to electron beam-induced dissociation of VZnH2 complex and electromigration of H+ to the periphery of the electron interaction volume. DFT calculations have shown that the binding energy of H bound within a VZnH2 complex is 1.8 eV.Reference Lavrov, Weber, Borrnert, Van de Walle and Helbig13 The energy liberated by band edge electron hole recombination is sufficient to overcome the binding energy and dissociate this complex. Dissociation of the complex may not necessarily produce loss of hydrogen as it can be recaptured by defects or impurities.Reference Johansen, Haug, Lund, Monakhov and Svensson25 The time evolution of the NBE intensity is similar to that predicted by Cazaux for the charging and build-up of an electric field in insulators or wide-band gap semiconductors in a high injection regime.Reference Cazaux27 During e-beam irradiation, the beam induces a positively charged near-surface region (nanometer scale) at the impact point due to the emission of secondary electrons. Primary and beam-generated electrons are trapped at defect centers at the periphery of the electron interaction volume, generating a space charge layer within the specimen.Reference Cazaux27 H+ with a migration barrier of less than 0.5 eVReference Bang and Chang28, Reference Wardle, Goss and Briddon29 would be able to migrate from the near-surface region toward the deeper negatively charged region of the interaction volume.
The decrease in the NBE intensity can be attributed to two main mechanisms: (i) H is dissociated from the VZnH2 complex and possibly from nonradiative defects, reactivating recombination pathways that compete with the NBE emission, (ii) H+ migrates out of the near-surface region or combine to form “hidden” H2, which is electrically inactive in ZnO.Reference Lavrov, Herklotz and Weber30 The NBE emission decreases with irradiation because, unlike the DL emissions, the NBE is only detected close to the surface due to the effect of self-absorption. This results in the NBE emission profile overlapping more with the H-depleted near-surface region. Similar electromigration of mobile charged defects has been previously found in GaN.Reference Toth, Fleischer and Phillips31 The migration of hydrogen could not be judged by Hall effect measurements as the e-beam irradiation only affects a micron-size volume in the crystal. We observed no significant difference in carrier concentration before and after irradiation. The decrease in the intensity of the YL with e-beam irradiation is accounted for by the reactivation of competitive recombination channels. Additionally, under a high electron injection regime, the trapping of electrons may lead to a proportion of Li atoms to exist as Li−; the trapping of H+ in the vicinity of Li centers can be anticipated. IR absorption spectroscopy has previously detected the existence of Li–OH complex when ZnO was doped with hydrogen at 725 °C,Reference Shi, Stavola and Fowler23 which is in accord with the decrease in YL intensity under high intensity CL excitation. By the same token, the decrease in the GL intensity for undoped ZnO with irradiation time is likely due to the electromigration of VZn, which is known to exist in a stable doubly ionized charge state (VZn2−) with a migration barrier of 1.4 eV.Reference Janotti and Van de Walle32 Under the influence of a similar e-beam induced field in undoped ZnO, VZn2− can presumably migrate toward the positive near-surface region and be annihilated. The removal of the competitive defect would also account for the enhancement of the NBE and YL emissions.
IV. CONCLUSIONS
Hydrogen plasma treatment was found to drastically improve the NBE emission of ZnO. Hydrogen interacts strongly with GL centers, most likely, zinc vacancy defects, leading to a dramatic quenching of the emission with increasing hydrogen incorporation. The increase in the excitonic luminescence efficiency is attributed to the passivation of competitive defect centers. E-beam irradiation reduces the concentration of hydrogen within the electron interaction volume due to the dissociation of VZnH2 complex and subsequent electromigration of hydrogen to the periphery of the interaction volume under the influence of the trapped charge-induced electric field. The possibility that H atoms combine to form “hidden” H2 cannot be excluded. These results indicate that electron beam irradiation can be used to manipulate the distribution of hydrogen in ZnO and locally alter the luminescent properties.
ACKNOWLEDGMENTS
We thank Mr. Geoffrey McCredie for technical assistance with hydrogen plasma processing. Financial support from the Australian Research Council is gratefully acknowledged.