Introduction
Apathy, characterized by a reduction in goal-directed behavior or loss of motivation, is a frequent psychiatric syndrome observed in many neurological conditions (Le Heron, Holroyd, Salamone, & Husain, Reference Le Heron, Holroyd, Salamone and Husain2019). Previous studies have demonstrated that apathy is associated with an increased risk of dementia and poorer quality of life in various neurological diseases (Hollocks et al., Reference Hollocks, Lawrence, Brookes, Barrick, Morris, Husain and Markus2015; van Dalen et al., Reference van Dalen, van Wanrooij, Moll van Charante, Brayne, van Gool and Richard2018).
In Parkinson's disease (PD), apathy is also prevalent, affecting 17~70% patients (Le Heron et al., Reference Le Heron, Holroyd, Salamone and Husain2019) and is comorbid with depression (den Brok et al., Reference den Brok, van Dalen, van Gool, Moll van Charante, de Bie and Richard2015). It has been confirmed that apathy is associated with more impaired cognitive function and greater motor severity (den Brok et al., Reference den Brok, van Dalen, van Gool, Moll van Charante, de Bie and Richard2015), though conflicting findings exist (Nodel, Yakhno, Medvedeva, & Kulikov, Reference Nodel, Yakhno, Medvedeva and Kulikov2014). Among different cognitive functions, convergent evidence has shown that in PD, executive function and episodic memory are the two domains most implicated by apathy (Butterfield, Cimino, Oelke, Hauser, & Sanchez-Ramos, Reference Butterfield, Cimino, Oelke, Hauser and Sanchez-Ramos2010; D'Iorio, Maggi, Vitale, Trojano, & Santangelo, Reference D'Iorio, Maggi, Vitale, Trojano and Santangelo2018). A prior work revealed that apathy, but not depression, in PD was associated with inefficient utilization of cognitive resources (Varanese, Perfetti, Ghilardi, & Di Rocco, Reference Varanese, Perfetti, Ghilardi and Di Rocco2011), suggesting a closer relationship between apathy and cognition. Nevertheless, as depression and motor severity can also affect cognition in PD (Schrag, Siddiqui, Anastasiou, Weintraub, & Schott, Reference Schrag, Siddiqui, Anastasiou, Weintraub and Schott2017), it remains unclear whether apathy has a unique role in cognitive deficits, when compared with depression and motor severity and has differential impacts on different cognitive functions.
Understanding the underlying neural substrates of apathy is crucial for the development of effective treatment. The prefrontal-basal ganglia system was originally proposed to underlie apathy (Levy & Dubois, Reference Levy and Dubois2006) and supported by findings across different pathological conditions (Kos, van Tol, Marsman, Knegtering, & Aleman, Reference Kos, van Tol, Marsman, Knegtering and Aleman2016). Additionally, abnormalities within the parietal cortex and the temporal regions were also linked to apathy in neurodegenerative disorders (Kos et al., Reference Kos, van Tol, Marsman, Knegtering and Aleman2016; Raimo, Santangelo, D'Iorio, Trojano, & Grossi, Reference Raimo, Santangelo, D'Iorio, Trojano and Grossi2019). Of note, the variance in brain regions involving in apathy suggests the possibility of different routes towards apathy (Kos et al., Reference Kos, van Tol, Marsman, Knegtering and Aleman2016; Moretti & Signori, Reference Moretti and Signori2016; Raimo et al., Reference Raimo, Santangelo, D'Iorio, Trojano and Grossi2019). In PD, our recent review study showed that changes in the frontal and striatal regions have been consistently found in apathetic PD (aPD) patients (Wen, Chan, Tan, & Tan, Reference Wen, Chan, Tan and Tan2016). Most of the previous neuroimaging studies on PD-related apathy have employed nuclear imaging, functional magnetic resonance imaging (MRI), or T1-weighted MRI techniques and focused on few pre-selected brain regions to study the underlying functional and gray matter (GM) structural pathology of apathy. However, white matter (WM) changes, especially on the network level, remain understudied in PD-related apathy.
Existing studies using diffusion tensor imaging (DTI) to measure microstructural WM features have generated inconsistent findings. For instance, the work by Carriere and colleagues did not show any WM differences between aPD, non-apathetic PD (naPD), and healthy control (HC) groups (Carriere et al., Reference Carriere, Besson, Dujardin, Duhamel, Defebvre, Delmaire and Devos2014). Yet, apathy-related WM alterations in the anterior brain regions were found in another PD study (Lucas-Jimenez et al., Reference Lucas-Jimenez, Ojeda, Pena, Cabrera-Zubizarreta, Diez-Cirarda, Gomez-Esteban and Ibarretxe-Bilbao2018). Moreover, one of the technical limitations with DTI is that it assumes a single compartment and is unable to resolve multiple fiber orientations in complex biological compartments within a voxel (Wedeen et al., Reference Wedeen, Wang, Schmahmann, Benner, Tseng, Dai and de Crespigny2008). Another limitation of DTI is that the characteristic of millimeter resolution in MRI results in partial volume averaging, providing inaccurate descriptions of local fiber orientations. Thus, DTI cannot resolve fiber crossings either at WM tract intersections or in the intricate architecture of GM (Wedeen et al., Reference Wedeen, Wang, Schmahmann, Benner, Tseng, Dai and de Crespigny2008).
To improve the current understanding of the underlying WM changes of apathy in PD, we conducted a study using diffusion spectrum imaging (DSI) to map complex fiber architecture at the scale of single MRI voxels (Wedeen, Hagmann, Tseng, Reese, & Weisskoff, Reference Wedeen, Hagmann, Tseng, Reese and Weisskoff2005) for better quantifying WM microarchitecture. To elucidate the impact of apathy on cognition in the context of PD, we included detailed clinical measurements in the study. We hypothesized that first, decreased WM network efficiency and connectivity, especially within the frontal, temporal, parietal, and basal ganglia areas, would be found in aPD patients and second, in nondemented PD, apathy would impact on more cognitive functions, compared with motor severity and WM network features, and moderate the effects of depression on cognition.
Methods
Participants
A total of 91 non-demented participants, comprising 31 aPD patients, 28 naPD patients, and 32 demographically matched HCs, were enrolled in the study. All participants were screened for dementia using the Montreal Cognitive Assessment (MOCA) (Dalrymple-Alford et al., Reference Dalrymple-Alford, MacAskill, Nakas, Livingston, Graham, Crucian and Anderson2010) and received the Mini International Neuropsychiatric Interview (MINI), a structured psychiatric diagnostic interview based on the Diagnostic and Statistical Manual (DSM-IV) criteria for psychiatric disorders (Sheehan et al., Reference Sheehan, Lecrubier, Harnett Sheehan, Janavs, Weiller, Keskiner and CDunbar1997). Participants who had dementia or MRI contraindications were excluded from the study. The diagnosis of apathy was made by a member of the clinical team who was blinded to the scale scores and based on previously validated diagnostic criteria (Drijgers, Dujardin, Reijnders, Defebvre, & Leentjens, Reference Drijgers, Dujardin, Reijnders, Defebvre and Leentjens2010). Specifically, participants were diagnosed with apathy if (1) they had displayed disproportionate loss or diminished motivation in cognition, behavior, and/ or emotion most of the time for at least 1 month, compared with their previous levels of functioning and respective age and culture norms, and (2) these changes caused significant impairment in personal, social, occupational, and other important aspects of functioning, but could not be simply explained by physical disabilities, motor disabilities, diminished consciousness or the direct physiological effects of a substance. All HCs were free from any neurological and psychiatric disorders. All patients met the National Institute of Neurological Disorders and Stroke (NINDS) Diagnostic Criteria for PD and had Hoehn & Yahr (H & Y) staging score ⩽3. Disease duration was established based on the duration of PD symptoms documented in the medical records. This study was approved by the local institutional review board. All participants provided written informed consent prior to study entry.
Clinical measures
Cerebrovascular risk factors, including hypertension, diabetes mellitus, hyperlipidemia, and smoking, were assessed. Motor symptoms were assessed using the Movement Disorder Society (MDS) – Unified Parkinson's Disease Rating Scale – Part III (UPDRS-III) (Goetz et al., Reference Goetz, Fahn, Martinez-Martin, Poewe, Sampaio, Stebbins and LaPelle2007) and the H & Y scale. All patients retained anti-Parkinsonian medications during the study. Their medication doses were converted into levodopa equivalent daily dose (LEDD) using an established method (Tomlinson et al., Reference Tomlinson, Stowe, Patel, Rick, Gray and Clarke2010).
The Apathy Scale (AS) was used to evaluate the severity of apathy with scores ⩾14 being considered apathetic (Starkstein et al., Reference Starkstein, Mayberg, Preziosi, Andrezejewski, Leiguarda and Robinson1992). Given that apathy is highly comorbid with depression (den Brok et al., Reference den Brok, van Dalen, van Gool, Moll van Charante, de Bie and Richard2015), we also measured depression using the 15-item Geriatric Depression Scale (GDS) (Yesavage et al., Reference Yesavage, Brink, Rose, Lum, Huang, Adey and Leirer1983), which comprises three subscales, including general depressive affect, life satisfaction, and withdrawal (Mitchell, Mathews, & Yesavage, Reference Mitchell, Mathews and Yesavage1993; Zhao, He, Yi, & Yao, Reference Zhao, He, Yi and Yao2019). Participants were considered depressed if their GDS scores were ⩾5 (Marc, Raue, & Bruce, Reference Marc, Raue and Bruce2008).
Global cognition was evaluated with the MOCA. In addition, five cognitive domains as recommended by the MDS were assessed (Litvan et al., Reference Litvan, Goldman, Tröster, Schmand, Weintraub, Petersen and Emre, M.2012). For episodic memory, the Word Recall Test and the Word Recognition Test from the Alzheimer-Disease Assessment Scale-Cognitive Subscale (Mohs et al., Reference Mohs, Knopman, Petersen, Ferris, Ernesto, Grundman and Thal1997) were used to measure immediate recall and delayed recall, and recognition, respectively. Executive function was assessed with the Frontal Assessment Battery (Dubois, Slachevsky, Litvan, & Pillon, Reference Dubois, Slachevsky, Litvan and Pillon2000) and the Color Trail Test– Part A & B (D'Elia, Satz, Uchiyama, & White, Reference D'Elia, Satz, Uchiyama and White1996). Attention and working memory were tested with the Digit Span Test– Forward & Backward (Wechsler, Reference Wechsler1997) and the Symbol Span Test (Wechsler, Reference Wechsler2009). Language was measured with the Boston Naming Test (Cheung, Cheung, & Chan, Reference Cheung, Cheung and Chan2004) and the Word Comprehension Test (Goodglass & Kaplan, Reference Goodglass and Kaplan1993). Visuospatial ability was determined with the Block Design Test (Wechsler, Reference Wechsler1997) and the Clock Drawing Test (Sunderland et al., Reference Sunderland, Hill, Mellow, Lawlor, Gundersheimer, Newhouse and Grafman1989). Each cognitive domain score was obtained by averaging the standardized scores of the tests in the respective domain.
Image acquisition
All participants underwent MRI scan within 3 weeks after the completion of clinical assessment. MRI was performed on a 3 T scanner (Prisma, Siemens, Erlangen, Germany) with a 32-channel head coil. For each participant, a T1-weighted 3-dimensional magnetization prepared rapid gradient-echo sequence [voxel size: 1 × 1 × 1 m3, repetition time (TR): 1950 ms, echo time (TE): 3 ms, inversion time (TI): 900 ms, flip angle: 8°], and a fluid-attenuated inversion recovery (FLAIR) sequence (voxel size: 0.8 × 0.8 × 3 m3, TR: 9000 ms, TE: 82 ms, TI: 2500 ms, flip angle: 150°) were acquired to ensure the absence of significant atrophy and cerebrovascular lesions.
DSI was also acquired using a multiband pulsed-gradient twice-refocused spin-echo EPI sequence (slice thickness = 2.5 mm, TR: 4000 ms, TE: 103 ms, FOV: 200 × 200 mm2, acquisition matrix: 80 × 80, flip angle: 89°, acceleration factor = 3). A total of 102 diffusion-encoding directions were applied with different b values (b max = 4000 s/mm2) corresponding to the grid points filled within a sphere in the 3D diffusion-encoding space (q-space) (Wedeen et al., Reference Wedeen, Hagmann, Tseng, Reese and Weisskoff2005).
DSI preprocessing
All DSI data were first visually checked to ensure the absence of artifacts, followed by a motion and eddy current correction. Subsequently, all images were reconstructed using q-space diffeomorphic reconstruction (QSDR) in DSI Studio (http://dsi-studio.labsolver.org) (Yeh & Tseng, Reference Yeh and Tseng2011). DSI Studio first calculates the quantitative anisotropy (QA) mapping in the native space and then normalizes it to the MNI QA map using SPM normalization. Once in MNI space, spin density functions were again reconstructed with a mean diffusion distance of 1.25 mm using three fiber orientations per voxel.
Whole-brain fiber tracking was performed in DSI studio with an angular cutoff of 45°, step size of 1.0 mm, minimum length of 30 mm, maximum length of 450 mm, spin density function smoothing of 0.0, and a QA threshold of 0.02. Deterministic fiber tracking using a modified fiber assignment by continuous tracking algorithm was performed until 100 000 streamlines were reconstructed for each individual.
Network analysis
A brain network can be described as a graph, where the nodes are brain regions and the edges are the connections between nodes. Here, the nodes were defined using the IIT GM Destrieux atlas (Destrieux, Fischl, Dale, & Halgren, Reference Destrieux, Fischl, Dale and Halgren2010), which parcellates the brain into 168 regions. The connectivity matrices and graph theoretical analysis were conducted with the DSI Studio and Brain Connectivity Toolbox (Rubinov & Sporns, Reference Rubinov and Sporns2010) on the whole-brain level. Weighted, undirected graphs were constructed for each participant consisting of the pair-wise correlation between QA signals over all network nodes (see online Supplementary Fig. S1 for the visualization of the graph structures of a representative HC and aPD generated based on the aforementioned whole-brain tracking and connectivity matrix).
Four global network metrics, including global efficiency, characteristic path length, clustering coefficient, and local efficiency, were investigated. While both global efficiency and characteristic path length are measures of global connectedness and provide an estimate of how easily information can be integrated across the network (i.e. integration), global efficiency is less affected by nodes that are relatively isolated from the network (Rubinov & Sporns, Reference Rubinov and Sporns2010). By contrast, clustering coefficient measures the brain's tendency to segregate into relatively independent, local neighborhoods, and local efficiency measures how efficient the communication is between neighbors of a node when that node is removed (Latora & Marchiori, Reference Latora and Marchiori2003; Rubinov & Sporns, Reference Rubinov and Sporns2010). Both are measures of segregation.
For regional network analysis, the network-based statistics (NBS) (Zalesky, Fornito, & Bullmore, Reference Zalesky, Fornito and Bullmore2010) was used to further localize specific pairs of brain regions where WM structural connectivity was altered.
GM and total intracranial volumes
T1-weighted images were preprocessed using SPM 12 (http://www.fil.ion.ucl.ac.uk/spm/software/spm12). The images were first segmented into maps representing the probability of GM, WM, and cerebrospinal fluid (CSF) at each voxel. Estimates of GM volume and total intracranial volume (TIV) derived from summing the three tissue class volumes were computed in SPM 12 using the unified segmentation and spatial normalization procedure (Malone et al., Reference Malone, Leung, Clegg, Barnes, Whitwell, Ashburner and Ridgway2014).
Statistical analysis
Statistical analysis was performed in R 3.5 (r-project.org). For continuous variables, one-way analysis of variance (ANOVA) or Kruskal–Wallis tests where appropriate were used for three-group comparisons and independent t tests or Mann–Whitney U tests where appropriate were used for two-group comparisons. For three-group comparisons, results showing significant differences were followed by post-hoc analyses using false discovery rate (FDR) to correct for multiple comparisons. Pearson's chi-square or Fisher's exact tests were used for comparing categorical variables.
Brain network analysis
One-way analysis of covariance (ANCOVA) controlling for depression and motor severity was used to test group differences in global network features as measured with graph-theoretical metrics.
Regional network analysis controlling for depression and motor severity was performed to compare group differences. In PD, the association of depression with network connectivity, controlling for apathy and motor severity, was also examined to determine depression-related network alternations. These analyses were conducted in NBS. Data were permuted 5000 times to generate p values.
For global and regional network analyses, significance was set at p < 0.05 (FDR) corrected for multiple comparisons.
Correlation analysis
For cognitive functions showing significant group differences, bivariate correlations were performed to assess the relationships between these cognitive functions and other variables of interest, including apathy, depression, motor severity and global network integrity, in PD. We chose global efficiency as the indicator of network integration because of its strong relationship with cognition (Tuladhar et al., Reference Tuladhar, van Dijk, Zwiers, van Norden, de Laat, Shumskaya and de Leeuw2016).
Path analysis
Path analysis is an extension of multiple regression analysis and assesses the comparative strength of direct and indirect relationships among variables within a hypothesized causal system. As such, it requires an explicit specification of how the studied variables relate to one another (Lleras, Reference Lleras2005). In the current study, we used path analysis to simultaneously consider the direct, indirect, and total effects of predictors on outcomes. We modeled the effects of significant variables on cognitive functions where group differences were found for the entire PD group to determine predictors of PD-related cognitive impairment. Significant variables from the aforementioned correlation analysis (i.e. p < 0.05, FDR corrected for multiple comparisons) were carried forward to path analysis to concurrently examine the direct and indirect effects of predictors on the respective cognitive outcome measures.
Results
Demographic and clinical characteristics
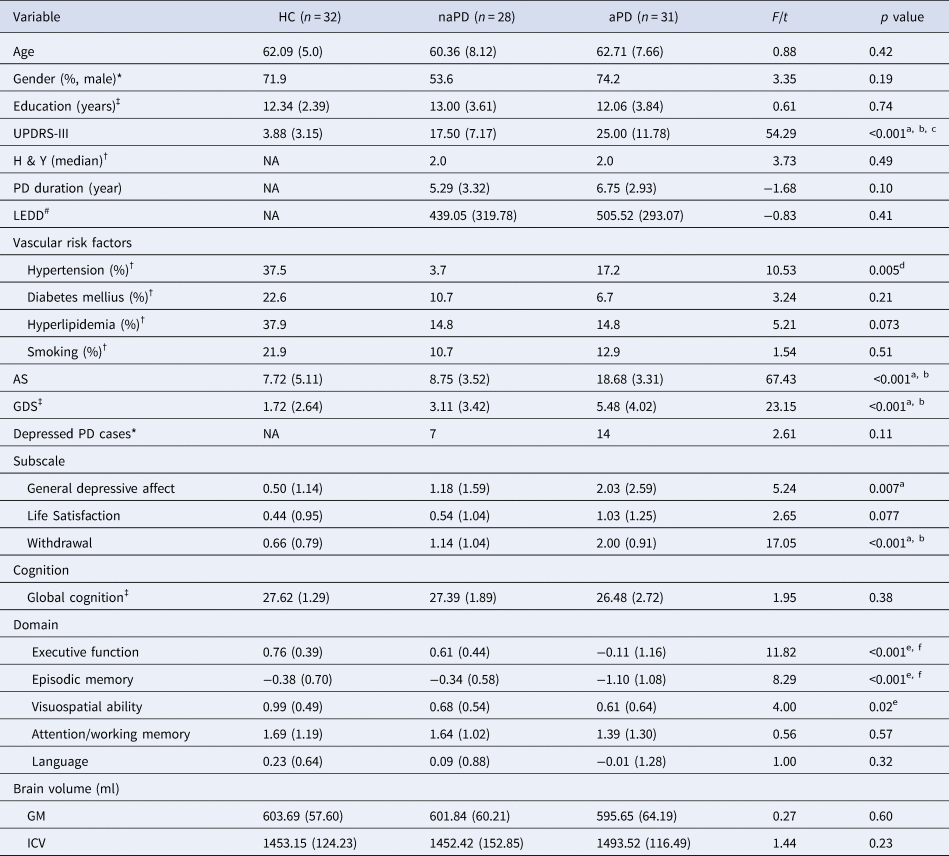
None of the participants took antidepressant or antipsychotic medications. There were no significant group differences in demographics and the presence of cerebrovascular risk factors, except for hypertension (χ2 = 10.53, p = 0.005). Post-hoc analysis indicated a higher hypertension rate in the HC group than in the naPD group. No significant differences were found in disease duration, H & Y staging, and LEDD between the two PD groups, either. However, a significant group difference was found in motor severity, such that aPD patients had the highest UPDRS-III scores, followed by naPD patients, and then HCs (p < 0.001).
As for cognition, no significant group difference was found in global cognition (p = 0.38). However, there were significant group differences in executive function (p < 0.001), episodic memory (p < 0.001), and visuospatial ability (p = 0.02). Post-hoc analyses indicated that aPD patients had worse executive function and episodic memory, compared with HCs and naPD patients, and worse visuospatial ability compared with HCs. Conversely, the naPD and HC groups did not differ in all of the five cognitive domains.
More severe apathy and depression were observed in aPD patients relative to HCs and naPD patients (ps < 0.001), whereas HCs and naPD patients shared similar severity of apathy and depression. Further analysis of the three GDS subscales revealed statistically significant group differences in general depressive affect (p < 0.01) and withdrawal (p < 0.001) but not in life satisfaction (p = 0.077). Post-hoc analyses showed that the aPD group had severer general depression, compared with HCs, and more withdrawal, compared with HCs and naPD patients. In PD, more depressed cases defined by GDS scores ⩾ 5 were found in the aPD group than in the naPD group; however, the group difference did not reach statistical significance (χ2 = 2.61, p = 0.11).
GM volume and TIV
There were no significant differences in GM volume and TIV between groups (p = 0.60 and 0.23, respectively).
The descriptive statistics of demographic, clinical, and brain volumetric variables were presented in Table 1.
Descriptive statistics of demographic and clinical variables for PD patients with and without apathy and healthy controls

HC, healthy control; naPD, PD patients without apathy; aPD, PD patients with apathy; UPDRS-III, the Movement Disorder Society; (MDS)-sponsored revision of the Unified Parkinson's Disease Rating Scale − Part III; H & Y, Hoehn & Yahr scale; NA, not available; LEDD, levodopa equivalent daily dose; AS, the Apathy Scale; GDS, the Geriatric Depression Scale.
Cognitive domain scores are presented as mean z scores. Descriptive statistics are presented as means (s.d.) unless otherwise noted; * = Chi-square test; † = Fisher's exact test. ‡: Kruskal–Wallis test; #: Mann–Whitney U test. a = HC < aPD; b = naPD < aPD, c = HC < naPD; d = HC > naPD; e = HC > aPD; f = naPD > aPD.
Global network analysis
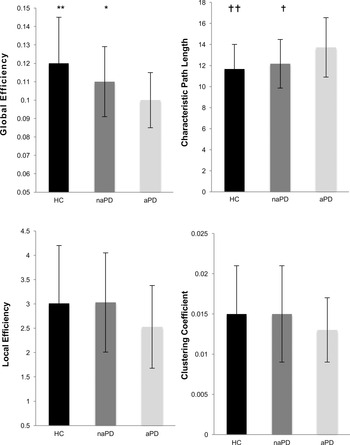
Analyses of graph theoretical features revealed significant group differences in global efficiency (F = 4.93, p = 0.009; mean/s.d. = HC: 1.17 × 10⁻¹/0.25 × 10−1, naPD: 1.12 × 10⁻¹ / 0.19 × 10⁻¹, aPD: 1.01 × 10⁻¹/ 0.15 × 10⁻¹) and characteristic path length (F = 3.36, p = 0.04; mean/s.d. = HC: 11.67/2.34, naPD: 12.17/2.31, aPD: 13.72/2.83). Compared with HCs and naPD patients, the aPD group had lower global efficiency (HC v. aPD: p = 0.009; naPD v. aPD: p = 0.032), but longer path length (HC v. aPD: p = 0.005; naPD v. aPD: p = 0.030). Conversely, HCs and naPD patients were similar in these two measures. No significant group differences were noted in clustering coefficient (F = 1.80, p = 0.17; mean/s.d. = HC: 1.50 × 10⁻²/0.60 × 10−2, naPD: 1.54 × 10⁻²/0.56 × 10−2, aPD: 1.28 × 10⁻²/0.40 × 10−2) and local efficiency (F = 1.55, p = 0.22; mean/s.d. = HC: 3.10/1.19, naPD: 3.03/1.02, aPD: 2.53/0.85). The descriptives and comparison results of the four global theoretical features are shown in Fig. 1.
Group comparisons of whole-brain graph-theoretical measures, controlling for motor severity and depression (**: HC > aPD, p < 0.01; *: naPD > aPD, p < 0.05; ††: HC < aPD, p < 0.01; † naPD < aPD, p < 0.05).

Regional network analysis
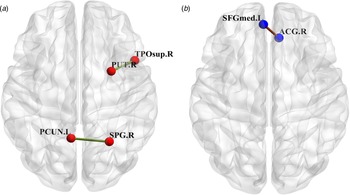
Regional WM network analysis revealed that compared with HCs, aPD patients showed disrupted connectivity in a single topologic cluster (Fig. 2a), with edges connecting the right superior parietal gyrus to the left precuneus (t = 4.08, p < 0.05) and connecting the right putamen to the right superior temporal pole (t = 3.41, p < 0.05). Conversely, aPD patients did not exhibit stronger connectivity between any brain regions, compared with HCs.
Clusters that differed between the HC and aPD groups (a) and between the HC and naPD groups (b), from group comparisons controlling for motor severity and depression. PUT .R = right putamen; TPOsup.R. = right superior temporal pole; PCUN. L = left precuneus; SPG. R = right superior parietal gyrus; SFG med. L. = left superior-medial frontal gyrus; ACG. R = right anterior cingulate gyrus.

A significant cluster with 1 edge was found when comparing HCs with naPD patients (Fig. 2b). Compared with HCs, naPD patients showed disrupted connectivity between the left superior to medial frontal gyrus and right anterior cingulate gyrus (t = 4.22, p < 0.05). In contrast, naPD patients did not show a stronger connection between brain regions, as opposed to HCs.
There was no significant difference in regional network connectivity between the aPD and naPD groups. Moreover, no significant neural networks were found to be associated with depression, after controlling for apathy and motor severity, in PD.
Correlation analysis
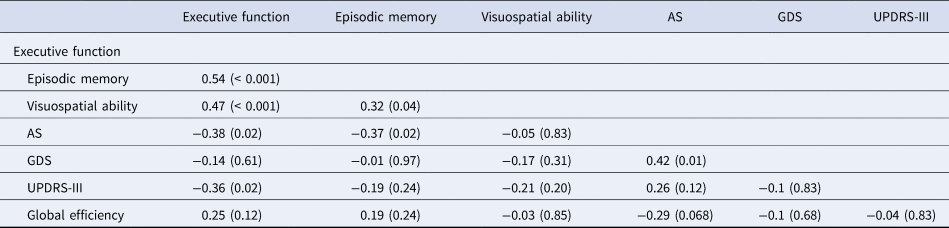
Correlation analysis revealed that while executive function, episodic memory and visuospatial ability were significantly correlated with each other (r = 0.32~0.54, p < 0.05~<0.001), executive function was associated with apathy and motor severity (r = −0.38, p = 0.015 and r = −0.36, p = 0.02, respectively) and episodic memory was associated with apathy (r = −0.37, p = 0.02). In contrast, visuospatial ability was not associated with apathy, depression, or motor severity (r = −0.05, −0.17, and −0.21, respectively, ps >0.05). Additionally, apathy was significantly correlated with depression (r = 0.42, p = 0.01) and marginally correlated with global efficiency (r = −0.29, p = 0.068), but did not correlate with motor severity (r = 0.26, p = 0.12). Table 2 presents the correlation analysis results.
Correlations between variables of interest in PD (p values were FDR corrected for multiple comparisons)

Values: correlation coefficient (p value). AS = Apathy Scale; GDS = Geriatric Depression Scale; UPDRS-III = the Movement Disorder Society (MDS)-sponsored revision of the Unified Parkinson's Disease Rating Scale − Part III.
Path analysis
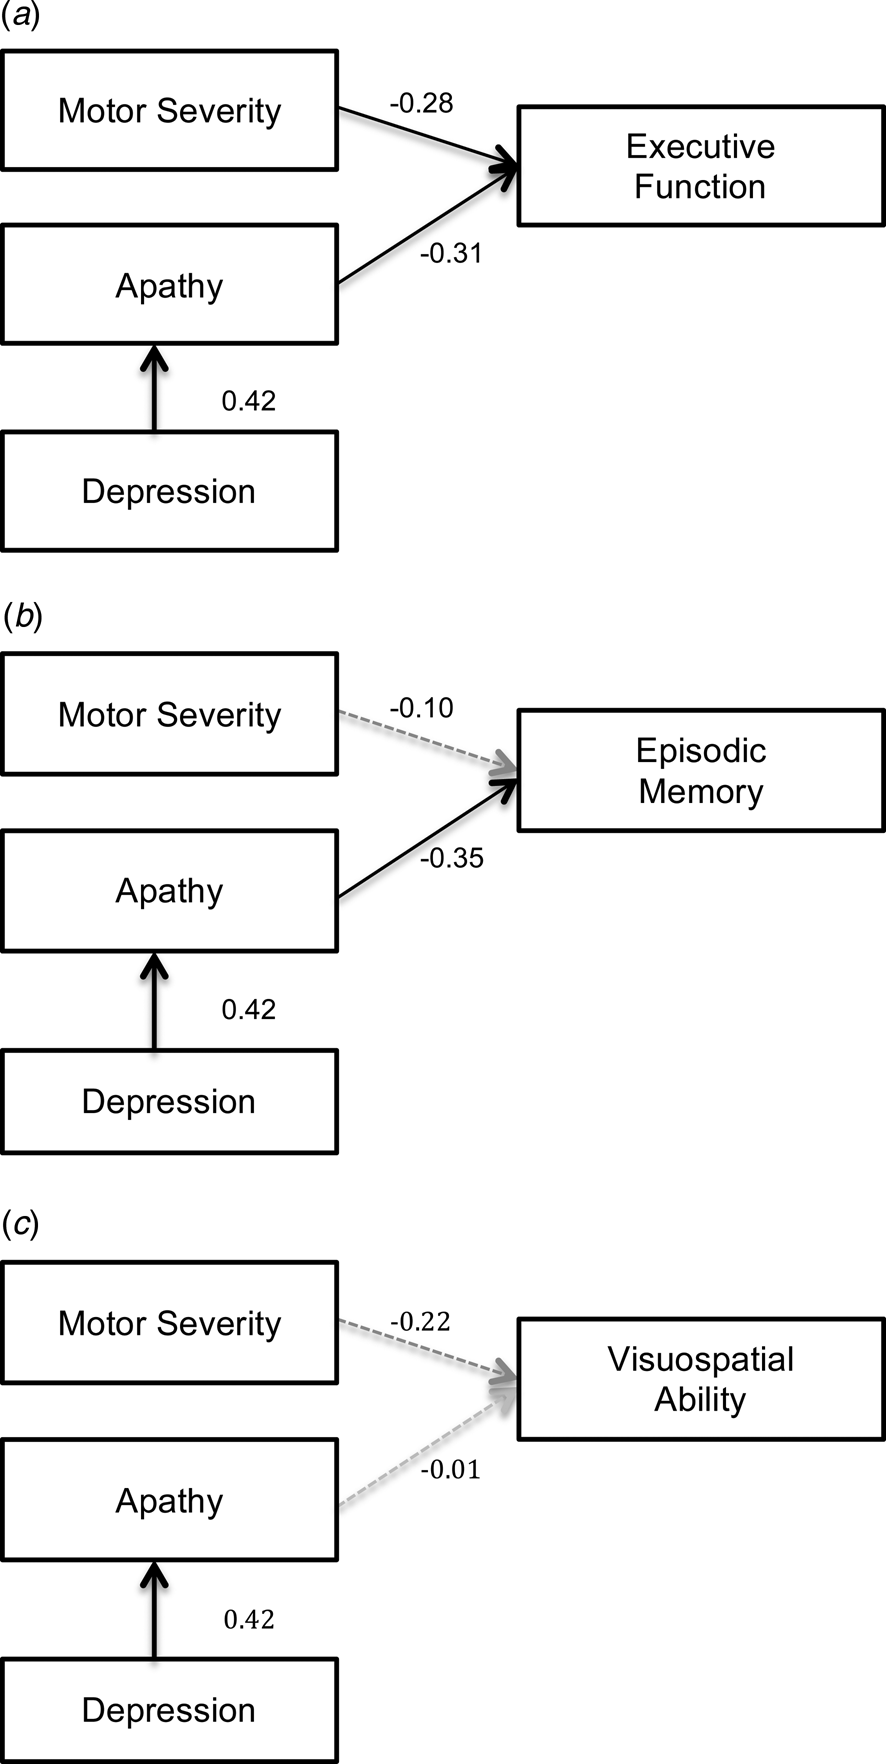
Path analysis model built on the correlation results revealed that both apathy and motor severity significantly contributed to poorer executive function (β = −0.31 and −0.28, respectively, p = 0.008 and 0.018, respectively) and depression significantly contributed to apathy (β = 0.42, p < 0.001). In addition, depression had a significant indirect effect on executive function via apathy (β = −0.13, p = 0.034).
To compare with executive function, the same path analysis model was implemented for episodic memory and visuospatial ability. We found that episodic memory was directly implicated by apathy (β = −0.35, p = 0.004), and indirectly influenced by depression via apathy (β = −0.14, p = 0.027), but was not associated with motor severity (β = −0.10, p = 0.40). On the contrary, none of the aforementioned variables showed a significant direct or indirect effect on visuospatial ability. The path analysis models are depicted in Fig. 3.
Path analysis for executive function (a), episodic memory (b), and visuospatial ability (c). In all of the three models, apathy and motor severity were entered as predictive variables of cognition and depression was entered as a predictor of apathy. The numbers on the paths represent standardized β coefficients. Dark solid lines and gray dashed lines represent significant and non-significant paths, respectively.

Discussion
Several main findings were yielded from the current study involving nondemented PD patients. First, the aPD group showed a decrease in global network integration in the brain, compared with the naPD and HC groups. Second, the aPD group had impaired executive function, episodic memory, and visuospatial ability as well as reduced regional connectivity. And, third, different cognitive impairments showed distinct relationships with apathy, depression, and motor severity in PD.
Applying graph theory to examining global network characteristics in the brain, we found compromised neural integration but relatively intact neural segregation in aPD patients. Neural integration allows a rapid combination of specialized information from distributed brain regions. Measures of integration such as global efficiency and characteristic path length used in our study quantify the ease with which brain regions communicate. By contrast, neural segregation refers to the ability to enable specialized processing within interconnected clusters of brain regions and can be indicated by clustering coefficient and local efficiency (Rubinov & Sporns, Reference Rubinov and Sporns2010). A previous study showed that the segregation and integration of distinct brain networks were related to simple and complex cognitive tasks, respectively (Cohen & D'Esposito, Reference Cohen and D'Esposito2016). As such, findings from our graph theoretical analysis suggest that apathy in PD may be more associated with integration difficulty in the brain and is likely to contribute to poorer performance in more complicated cognitive tasks.
Our results from group comparisons of cognitive functions support the aforementioned view. We found that although in general, poorer cognitive performance was found in aPD patients, more salient cognitive deficits were observed in executive function, episodic memory, and visuospatial ability. In line with previous reports (Butterfield et al., Reference Butterfield, Cimino, Oelke, Hauser and Sanchez-Ramos2010; D'Iorio et al., Reference D'Iorio, Maggi, Vitale, Trojano and Santangelo2018), executive function and episodic memory are the two domains in which PD patients tend to exhibit impairment due to dopaminergic deficiency and nondopaminergic influences, such as changes in the serotoninergic and cholinergic systems (Robbins & Cools, Reference Robbins and Cools2014). Performing any tasks that require these two domain functions would be more effortful and arguably be more complex. Reduced capacity for integration in the brain thus corresponded to poorer performance on tests requiring executive function and episodic memory in the aPD group.
In addition to global network alterations, our regional network analysis showed that aPD patients had reduced structural connectivity between the right superior parietal gyrus and the left precuneus and between the right putamen and superior temporal region, as opposed to HCs. Disrupted connections of these regions were also demonstrated in previous DTI studies involving apathetic patients with small vessel disease (Hollocks et al., Reference Hollocks, Lawrence, Brookes, Barrick, Morris, Husain and Markus2015; Tay et al., Reference Tay, Tuladhar, Hollocks, Brookes, Tozer, Barrick and Markus2019) and may represent the common neural substrates of apathy across varied neurological disorders (Kos et al., Reference Kos, van Tol, Marsman, Knegtering and Aleman2016; Moretti & Signori, Reference Moretti and Signori2016; Raimo et al., Reference Raimo, Santangelo, D'Iorio, Trojano and Grossi2019).
An unexpected finding of our study was that the naPD group also showed a disrupted connection between the left frontal and the right anterior cingulate regions despite having similar cognitive and global network characteristics to those of HCs. Although the two regions are purported to be apathy-related substrates (Le Heron et al., Reference Le Heron, Holroyd, Salamone and Husain2019; Wen et al., Reference Wen, Chan, Tan and Tan2016), they are also part of the frontostriatal pathway and have been shown to be related to motor response and inhibition in PD (Baglio et al., Reference Baglio, Blasi, Falini, Farina, Mantovani, Olivotto and Bozzali2011). As such, the disconnection between the two brain regions could result from PD-related motor pathology. Notably, since we did not find significant group differences in GM volume and TIV, disrupted regional networks and decreased global efficiency could not be ascribed to brain atrophy or reduced total brain volume. In addition, it is unlikely that vascular risk factors gave rise to the alterations of WM networks found in our aPD or naPD group as both groups had comparable vascular risk burdens and the naPD group had lower hypertension prevalence when compared with the HC group. Similarly, depression, despite being comorbid with apathy, may not be the primary cause of the observed neural alterations as it did not significantly associate with any network alterations, after controlling for apathy and motor severity, in PD.
Path analysis showed that executive function was impacted directly by both apathy and motor severity and indirectly by depression, and episodic memory was affected directly by apathy and indirectly by depression; conversely, visuospatial ability was not influenced by motor or mood factors in PD. These findings suggest that although different cognitive functions are associated with each other, there are distinct pathological mechanisms that underscore different cognitive deficits. The direct relationship between executive function and motor severity is suggestive that executive dysfunction is at least in part due to dopaminergic deficiency in PD. Notwithstanding the comorbidity, apathy and depression may have different effects on executive function and episodic memory. Findings from our study not only supported a previous observation that apathy was a better predictor of cognitive performance than depression (Varanese et al., Reference Varanese, Perfetti, Ghilardi and Di Rocco2011), but further demonstrated that depression exerted its impact on cognition via apathy, thereby functioning as a secondary determinant of cognitive symptoms in PD. In contrast to depression and motor severity, the presence of apathy resulted in a more devastating impact on cognition in PD and should warrant clinical attention.
While the aPD group demonstrated significant impairment in visuospatial function, apathy, motor severity and depression did not significantly account for the impairment. This could be that poorer visuospatial performance was only found in the comparison between aPDs and HCs. In fact, mixed results of the association between visuospatial dysfunction and apathy in PD have been previously observed (D'Iorio et al., Reference D'Iorio, Maggi, Vitale, Trojano and Santangelo2018). Thus, the relationship between apathy and this cognitive function is uncertain and necessitates future studies with larger cohorts for confirmation.
Although our correlation analysis did not reveal a significant relationship between global efficiency and any of the cognitive functions, this does not suggest that cognitive impairment in PD is unrelated to changes in the brain. As our study had excluded patients with significant cognitive deficits, such as dementia, from participating in the study, reduced global efficiency might not be in sync with cognitive dysfunction but was more related to apathy in our cohort. Studies including patients with more severe cognitive impairment would be useful to determine network changes in the brain that are associated with cognitive impairment.
The strengths of the current study included the employment of DSI, which provides the capacity to accurately image multiple fiber directions at each location (Wedeen et al., Reference Wedeen, Hagmann, Tseng, Reese and Weisskoff2005), and the confirmation of apathy using a structured clinical diagnostic interview and a clinical measure. That said, some limitations of the study should also be mentioned. First, we did not have sufficient patients with isolated apathy or depression to allow comparisons with patients with comorbid apathy and depression. This is unsurprising because clinically, apathy and depression often coexist (den Brok et al., Reference den Brok, van Dalen, van Gool, Moll van Charante, de Bie and Richard2015). Therefore, it would be difficult to recruit sufficient patients with only one of the syndromes. Nevertheless, our study showed the correlation between apathy and depression to be only moderate and no significant association between depression and neural network alterations. Also, we demonstrated the differential effects of apathy and depression on cognition in PD. These findings support the exclusive impacts of apathy on neural networks and cognition that cannot be attributed to depression. Another limitation was that the cross-sectional study design limited our exploration of the long-term impact of apathy on cognitive decline and neural networks. Thus, longitudinal follow-up studies would be needed. Finally, although the difference was statistically non-significant, the aPD group exhibited slightly longer disease duration, which could confound the results to some extent and hence was the limitation of the study.
In conclusion, apathy in PD is related to WM network disruptions. The impact of apathy is more evident in executive function and episodic memory. Compared with depression and motor severity, apathy holds a more devastating role in cognitive functions in PD.
Supplementary material
The supplementary material for this article can be found at https://doi.org/10.1017/S0033291720001907.
Acknowledgements
This study was supported by the National Medical Research Council Grant (Grant No.: NMRC/ CNIG/1160/2016) from the Ministry of Health, Singapore awarded to M-C.W. We thank all participants for their participation in the study.
Conflict of interest
None.