Implications
Measuring the optical properties of the fat online at the abattoir using a portable spectrophotometer has shown high potential for distinguishing pasture-fed from stall-fed lamb carcasses. Although the digestive and metabolic fate of carotenoid pigments, which are highly involved in this discrimination process, vary between breeds, the reliability of the discrimination between pasture-fed and stall-fed lambs was not significantly reduced when pooling all three breeds used together than when using a breed-specific database.
Introduction
A number of factors contribute to research interest in authentication of ruminant meat from grassland based production systems. First, the increasing consumer demand for assurance about mode of production because of several food crises; second, the evidence that pasture-feeding can impart beneficial effects on meat from a nutritional point of view (Aurousseau et al., Reference Aurousseau, Bauchart, Calichon, Micol and Priolo2004); third, the interest in production practices which are more environmentally friendly and more respectful towards animal welfare (Hocquette et al., Reference Fisher and de Boer2012); and finally, the interest for producers to obtain market recognition and premium and to avoid piracy of their brands (Prache, Reference Prache2007).
Visible reflectance spectroscopy has shown high potential for distinguishing pasture-fed (P) from stall concentrate-fed (S) lamb carcasses (Prache and Theriez, Reference Prache, Aurousseau, Thériez and Renerre1999; Dian et al., Reference Dian, Andueza, Barbosa, Amoureux, Jestin, Carvaho, Prado and Prache2007a; Huang et al., Reference Hocquette, Botreau, Picard, Jacquet, Pethick and Scollan2015a). Carotenoid pigments are highly involved in this discrimination process (Dian et al., Reference Dian, Andueza, Barbosa, Amoureux, Jestin, Carvaho, Prado and Prache2007a; Huang et al., Reference Hocquette, Botreau, Picard, Jacquet, Pethick and Scollan2015a and 2015b) and a recent study demonstrated a between-breed variability in the digestive and metabolic fate of these pigments (Macari et al., Reference Irie2017). Our hypothesis was that this between-breed variability may affect the reliability of diet authentication using visible spectroscopy over a range of breeds, making it necessary to use breed-specific database.
The present study uses a large database to evaluate: (i) the reliability of using visible spectroscopy for differentiating meat from pasture-fed and stall concentrate-fed lambs over three breeds, two of them being known to present differences in the ability to absorb, transfer into plasma and store carotenoids in body fat (Macari et al., Reference Irie2017) and (ii) to what extent a breed-specific database may be necessary for authentication purposes. Moreover, as pasture-based production systems are prone to variability in animal performances (Sheath et al., Reference Sheath, Coulon and Young2001), we took advantage of this large database to gauge how far animal’s and grazing period’s characteristics affected the intensity of light absorption by carotenoid pigments present in the fat. Previous studies actually suggested this intensity, used as a traceability index (Prache and Theriez, Reference Prache, Aurousseau, Thériez and Renerre1999), may vary with lamb’s live weight (LW) gain at pasture and the duration of the pasture-feeding period (de Oliveira et al., Reference Macari, Graulet, Andueza and Prache2012) and with lamb’s LW at turning out to pasture (Zawadzki et al., Reference Zawadzki, Prado and Prache2013).
Material and methods
The study was carried out over 6 years at three experimental farms: Unité Expérimentale des Monts d’Auvergne (UEMA, 1000 m a.s.l) and Unité Expérimentale des Ruminants de Theix (UERT, 850 m a.s.l) run by the Auvergne-Rhône-Alpes Institut National de la Recherche Agronomique (INRA) Centre in France and Unité Expérimentale de Physiologie Animale de l’Orfrasière (UEPAO, 160 m a.s.l.) run by the Tours INRA Centre in France. Working in these three experimental farms enabled us to increase the number of animals under study and to avoid potential complications linked to the onset of drought conditions at pasture, as one farm (UERT) was situated in semi-mountainous conditions and one farm (UEMA) was situated in the mountains. The animals were handled by specialized personnel who ensured their welfare in accordance with European Union Directive No. 609/1986.
Animals, feeding regimes and slaughter procedures
We used a total of 1054 (418 P and 636 S) male lambs. The breed-feed breakdown was 148 P and 258 S Romane (ROM), 102 P and 92 S Ile-de-France (OIF) and 168 P and 286 S Limousine (LIM) lambs. Ile-de-France S lambs were raised at UERT (years 1 to 4) or UEPAO (year 4). Limousine S lambs were raised at UEMA (years 1 to 4) or UERT (years 1 to 6). All ROM S lambs were raised at UERT (years 1 to 4). All LIM P lambs were raised at UEMA (years 1 to 5). All OIF P lambs were raised at UERT in years 1 to 4; in year 5, OIF P lambs were born at UEPAO farm until weaning and fattened at UEMA farm from weaning until slaughter. Regarding ROM P lambs, they were raised at UERT farm in years 1 to 4; in year 5, they were raised at UERT farm until weaning then at UEMA farm from weaning until slaughter.
Stall-fed lambs were fed indoors on an ad libitum diet of commercial concentrate containing no green vegetative matter and hay until slaughter. Pasture-fed lambs were born in spring and grazed pastures that were maintained at a leafy stage and offered ad libitum; they received no diet supplementation at pasture. The pasture-feeding period of P lambs was chosen to last for at least 44 days according to the results of de Oliveira et al. (Reference Macari, Graulet, Andueza and Prache2012) regarding the time of appearance of carotenoid pigments within the fat. In the first 4 years, ROM and OIF P lambs grazed together on the same paddocks, whereas LIM P lambs grazed their own paddocks. In the 5th year, LIM and ROM P lambs grazed their own paddocks.
Water and salt blocks were made constantly available to all lambs. The lambs were slaughtered when they had reached a target condition score of around 3 (on a scale of 0 to 5), which was manually assessed by a skilled technician according to the method described by Russel et al. (Reference Russel, Doney and Gunn1969). Animals were transported by truck to the abattoir located 500 m from the UERT farm and 25 km from the UEMA farm. Immediately after their arrival, animals were electrically stunned and slaughtered by throat cut at the INRA Auvergne-Rhône-Alpes Centre experimental abattoir, according to EU welfare guideline. The carcasses were placed in a refrigerated room at 4°C until 24 h postmortem, and they were always kept in the dark.
Measurements
Animal characteristics
Lambs were weighed at birth, at turning out to pasture for P lambs and just before slaughter, except for the OIF S lambs raised at UEPAO farm in year 4. Carcass weight was measured at 24 h postmortem. The perirenal fat and the kidneys were then removed from the cold carcass. The fat was separated from the kidneys and then weighed. Subcutaneous fat thickness was measured at 24 h postmortem (except for the OIF S lambs raised at UEPAO farm in year 4), by making two incisions through the fat along lines extending 4 cm ventro-laterally from the dorsal mid-line at the last rib and at the limit of that cut, extending 4 cm cranially. A flap of fat was raised and subcutaneous fat thickness was measured at the intersection of the incisions (Fisher and De Boer, Reference de Oliveira, Carvalho and Prache1994).
Plasma carotenoid concentration
Plasma carotenoid concentration was measured at slaughter (PCCS). Blood samples were taken from the jugular vein of each lamb and collected in lithium heparin (Consortium de Matériel pour Laboratoires, Nemours, France). Plasma was stored at – 20°C until assay. Carotenoid were extracted from the plasma within 3 months post-collection. Estimation of PCCS was carried out according to the method described by Dian et al. (Reference Dian, Chauveau-Duriot, Prado and Prache2007b).
Reflectance spectrum of perirenal fat
At 24-h postmortem, we measured the reflectance spectrum (RS) of perirenal adipose tissue at wavelengths in the range of 400 to 700 nm using a MINOLTA CM-2002 spectrophotometer (illuminant D65, observer angle 10°; Minolta France S.A., Carrières-sur-Seine, France). The instrument was fitted with protective glass. This apparatus measures the proportion of light reflected every 10 nm. Three measurements were made at three randomly selected locations, care being taken to avoid blood spots. The fat RS data were used at wavelengths between 450 and 510 nm, the range in which carotenoid pigments absorb light (Prache and Theriez, Reference Prache, Aurousseau, Thériez and Renerre1999). The fat RS data were translated (TRS) to give a reflectance value at 510 nm of 0. On the TRS, the integral value (I 450 to 510) was calculated as follows:
 $$\eqalignno{ &{I_{{450\,{\rm to}\,510}} \, {\equals}\, {[ {( {{\rm TRS}_{{450}} /2} ){\plus}{\rm TRS}_{{460}} {\plus}{\rm TRS}_{{470}} {\plus}{\rm TRS}_{{480}} {\plus}{\rm TRS}_{{490}}}}} \cr &\qquad \qquad { {\plus}{\rm TRS}_{{500}} {\plus}( {{\rm TRS}_{{510}} /2} )}]{\times}10$$
where TRS i is the reflectance value of the translated RS at i nm.
This integral value represents the area between the translated spectrum and the x-axis in the 450 to 510 nm band; it is therefore considered as an indicator of the carotenoid concentration in the adipose tissue (Prache et al., Reference Prache and Theriez2003). The integral value was averaged over the three measurements. The mean integral values were all negative; hereafter we use the absolute value of the mean integral of perirenal fat (AVMI 450 to 510).
Methods used to discriminate pasture-fed from stall concentrate-fed lamb carcasses
In method 1 (M1), a linear discriminant analysis was performed for each breed on AVMI 450 to 510, followed by a cross-validation procedure to classify the fat samples according to feeding treatment, using Minitab software v. 13 (Minitab Inc., Paris). A similar analysis was then performed after pooling all the data for the three breeds.
In method 2 (M2), the full reflectance data set at wavelengths between 400 and 700 nm was used to discriminate P and S lambs. The reflectance data (R) at wavelengths between 400 and 700 nm were averaged over the three replicates, then transformed (log (1/R)) and exported into Win ISI III version 1.6 software (Infrasoft International, Port Matilda, PA, USA) for multivariate analysis. For each breed and then for all breeds pooled together, the raw reflectance spectra of perirenal fat representing the two feeding treatments were submitted to discriminant analysis using a partial least squares discriminant analysis (PLS-DA). Partial least squares discriminant analysis consists of a PLS regression where the dependent variable is a set of categorical variables describing the different classes of observations. Each sample was assigned a dummy dependent variable according to the feeding treatment (one for P lambs, two for S lambs). A principal component analysis performed beforehand was used to rank the reflectance spectra from each feeding treatment according to the Mahalanobis distance (H) to the average RS, in order to detect sample outliers (H>3). No outliers were found. The models were tested via a cross-validation procedure, in which randomly chosen samples (a quarter of the samples) were temporally removed from the initial data set to be used for validation. The PLS-DA model was developed based on the other samples (calibration samples) and used to classify the validation samples. This procedure was repeated four times, that is until all data set samples had been used through the validation procedure. The cross-validation error of the models was calculated.
Statistical analysis
A first analysis was performed on all lambs. Variance in AVMI 450 to 510 was stabilized using a logarithmic transformation, and then subjected to analysis of variance using the R software to test the effects of breed, feeding treatment and their interaction, and Tukey’s test for pairwise comparisons.
A second analysis was performed on P lambs. Variance in PCCS was stabilized using a logarithmic transformation, and then subjected to analysis of variance using the R software to test the effect of breed. Absolute value of the mean integral of the fat (AVMI 450 to 510) of P lambs was subjected to variance–covariance analysis, using the R software, to examine the effects of breed, PCCS, and animal’s and grazing period’s characteristics (lamb’s LW at turning out to pasture, lamb’s LW gain at pasture and duration of the pasture-feeding period) and interactions terms.
For each method (M1 and M2), we compared the reliability of the discrimination between P and S lambs when pooling all lambs for the three breeds v. when using a breed-specific database, by comparing the frequency distribution of carcasses which were correctly or un-correctly classified (χ 2 test).
The proportion of correctly classified carcasses was analysed using the CATMOD procedure of the SAS (1999) software suite using a three-factor model (feeding treatment – P v. S; breed – ROM v. LIM v. OIF; and discrimination method used – M1 v. M2), with repeated measures on the last factor.
In all statistical analyses, the individual animal was considered as the statistical unit.
Results
Lamb and carcass characteristics
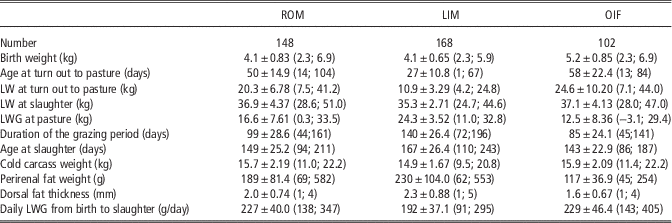
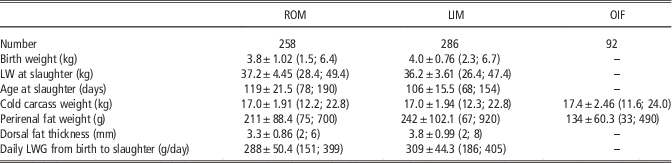
Lamb and carcass characteristics of P and S lambs are given in Tables 1 and 2. For P lambs, mean LW at turn out to pasture was in the order OIF>ROM>LIM, and mean duration of the grazing period and LW gain at pasture were in the order LIM>ROM>OIF.
Performance and carcass characteristics of pasture-fed lambsFootnote 1

ROM=Romane breed; LIM=Limousine breed; OIF=Ile-de-France breed; LW=live weight; LWG=live weight gain.
1 Mean±SD (min; max).
Performance and carcass characteristics of stall-fed lambsFootnote 1

ROM=Romane breed; LIM=Limousine breed; OIF=Ile-de-France breed; LW=live weight; LWG=live weight gain.
1 Mean±SD (min; max).
Reflectance spectrum of the fat at wavelengths between 450 and 510 nm (method 1)
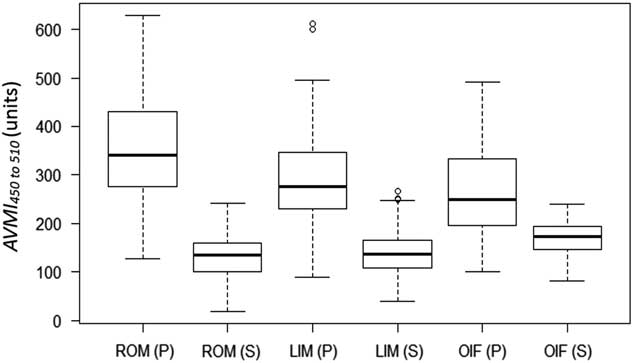
There was an interaction between breed and feeding treatment on AVMI 450 to 510 (P<0.001, Figure 1). In all breeds, AVMI 450 to 510 was higher in P lambs than S lambs (P<0.001). For a given feeding treatment, AVMI 450 to 510 differed between breeds for both P (P<0.001) and S lambs (P<0.001). In P lambs, all between-breed pairwise comparisons in AVMI 450 to 510 were significant, and AVMI 450 to 510 of P lambs was found to be in the order ROM>LIM>OIF. It averaged 355 units (range: 127 to 629 units), 290 units (range: 88 to 611 units) and 267 units (range: 100 to 491 units) in ROM, LIM and OIF P lambs, respectively. In S lambs, AVMI 450 to 510 was higher for OIF lambs than for ROM and LIM lambs (P<0.001) and it was not significantly different between ROM and LIM lambs (P=0.294). It averaged 169 units (range: 82 to 240), 137 units (range: 40 to 266 units) and 131 units (range: 19 to 242 units) in OIF, LIM and ROM S lambs, respectively.
Box plot representation of the traceability index (AVMI 450 to 510), considered as an indicator of carotenoid content in perirenal fat, in pasture-fed (P) and stall-fed (S) lambs from the Romane (ROM), Limousine (LIM) and Ile-de-France (OIF) breeds. The box represents the middle 50% of the data (between the 25th and the 75th percentile), the line in the box represents the median, the upper and lower lines represent the extreme values, and the circles outside the upper and lower lines represent the outliers.

In P lambs, PCCS differed between breeds (P<0.001). It averaged 95 µg/l (range: 36 to 258), 71 µg/l (range: 23 to 184) and 77 µg/l (range: 9 to 260) for ROM, LIM and OIF P lambs, respectively. It was significantly higher for ROM P lambs than for LIM P lambs (P<0.001) and OIF P lambs (P<0.001), but it was not different between LIM and OIF P lambs (P=0.912). In P lambs, AVMI 450 to 510 increased linearly with PCCS (P<0.001) with common slopes for all breeds (P=0.319) and no significant quadratic effect (P=0.220). However, the intercept of the regression varied between breeds (P<0.001), being higher for ROM P lambs than for LIM and OIF P lambs (P<0.001 for both), and not significantly different between LIM and OIF P lambs (P=0.065). The regression equation was:
 $$\eqalignno{ & {AVMI_{{450\,{\rm to}\,510} {}}\, \equals}\, \cr & { 232.3 \left( {\!\pm 10.40} \right){\plus}\left\{ {\matrix{ {\!\! 37.9 \left( {\pm 6.38} \right){\rm ROM }} \cr {{\!\!\!\!\!\!\minus}6.3\left( {\pm 6.07} \right){\rm LIM}} \cr {{\! \minus}31.6\left( {\pm 6.84} \right){\rm OIF}} \cr } } \right.{\plus} 0.895 \left( {\pm 0.1158} \right){\rm PCCS\ }$$
where r 2=0.23, residual standard deviation (RSD)=88.72, n=413 (five lambs are missing due to PCCS data missing).
The variables describing the animal’s and the grazing period’s characteristics (LWTP: lamb’s LW at turn out to pasture, kg; LWGP: lamb’s LW gain at pasture, kg; DP: duration of the pasture-feeding period, days) were significantly correlated (LWTP and LWGP: P<0.001, LWTP and DP: P<0.001, LWGP and DP: P<0.001). Among these variables, DP was the most strongly correlated with AVMI 450 to 510 in P lambs and inclusion of an additional term for DP in equation (1) resulted in significant improvement. In this second model, AVMI 450 to 510 of P lambs increased linearly with PCCS (P<0.001) and DP (P=0.021), with common slopes for all breeds and no quadratic effects for either PCCS or DP, neither interactions between these two variables. However, the intercept of the regression varied between breeds (P<0.001), being higher for ROM P lambs than for LIM and OIF P lambs (P<0.001 for both), and not significantly different for LIM and OIF P lambs (P=0.944).
The regression equation was:
 $$\eqalignno{ & {AVMI_{{450 {\rm to} 510}} \, {\equals}\, } \cr & {191.3 \left(\! { \pm 20.56} \right){\plus}\left\{ {\matrix{ {41.5 \left( { \pm 6.52} \right){\rm ROM} } \cr {{\minus}18.4 \left( { \pm 7.99} \right){\rm LIM}} \cr {{\minus}23.1\left( { \pm 7.75} \right){\rm OIF}} \cr } } \right.{\plus}0.893\left( { \! \pm 0.1151} \right){\rm PCCS}} \cr & \qquad \qquad \qquad {\plus}0.379\left( { \pm 0.1642} \right){\rm DP} $$
where r 2=0.24, RSD=88.26, n=413 (five lambs are missing due to PCCS data missing).
The threshold of the linear discriminant analysis performed on AVMI 450 to 510 was 245, 213 and 221 units in ROM, LIM and OIF lambs, respectively. The percentage of S lambs with an AVMI 450 to 510 greater than this threshold was 0%, 4.2% and 6.5% in ROM, LIM and OIF lambs, respectively, and the percentage of P lambs with an AVMI 450 to 510 lower than or equal to this threshold was 12.8%, 18.5% and 33.3% in ROM, LIM and OIF lambs, respectively. This threshold cut-off thus correctly classified 95.3%, 90.5% and 79.4% ROM, LIM and OIF lambs, respectively.
When pooling all the data for the three breeds, the threshold of the linear discriminant analysis was 224 units. The percentage of S lambs with an AVMI 450 to 510 greater than this threshold was 2.7%, whereas the percentage of P lambs with an AVMI 450 to 510 lower than or equal to this threshold was 20.6%. This threshold cut-off value thus enabled to correctly classify 90.2% of the 1054 lambs. The reliability of the discrimination was not significantly different when pooling all lambs for the three breeds or when using a breed-specific database.
Reflectance spectrum at wavelengths between 400 and 700 nm (method 2)
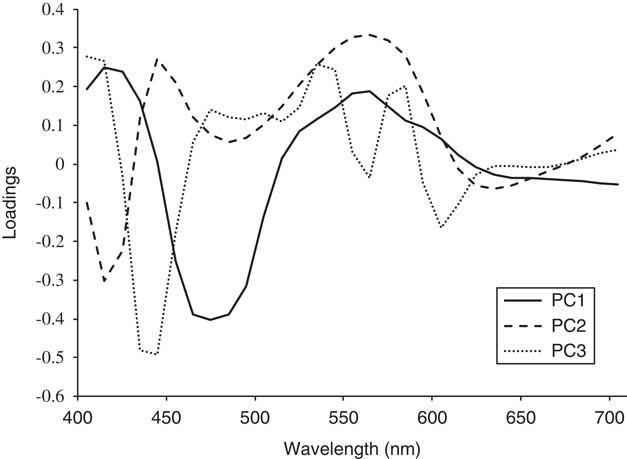
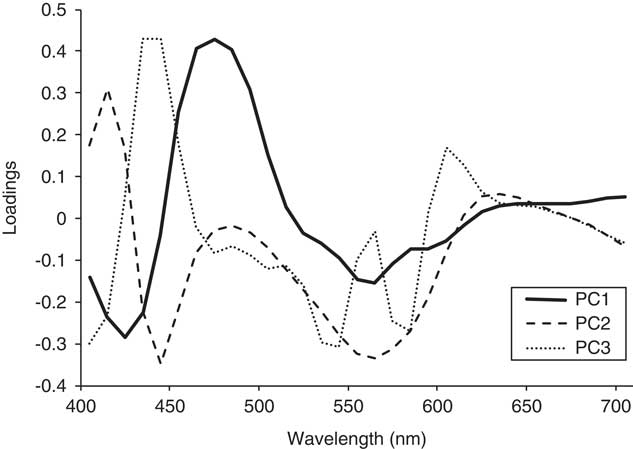
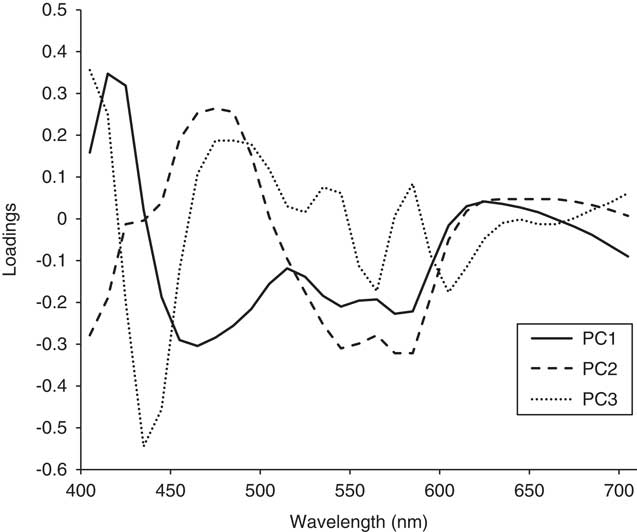
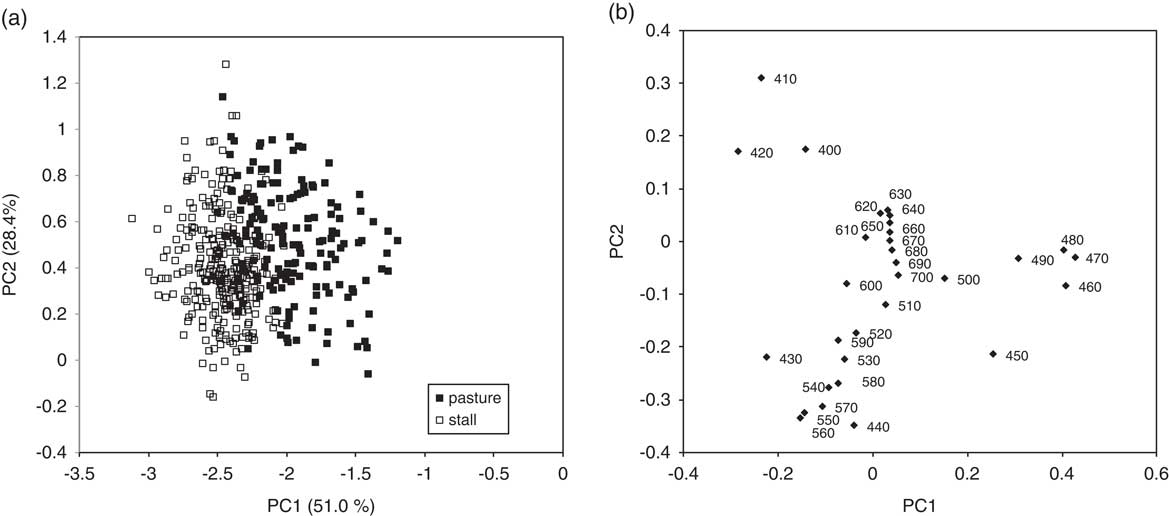
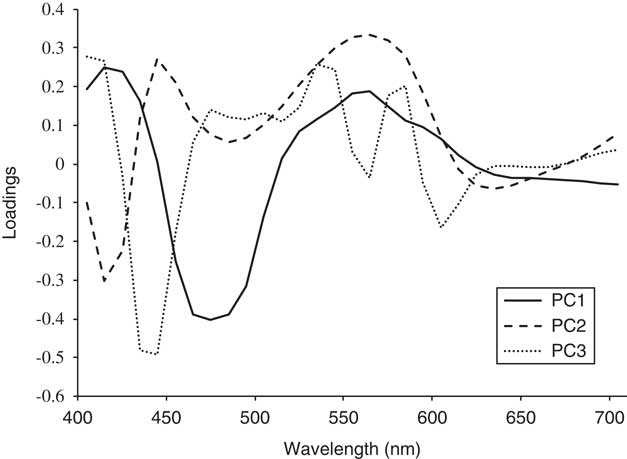
Principal component 1 (PC1), PC2 and PC3 axes explained 63.89%, 20.99% and 9.43% of variability for ROM, 51.03%, 28.42% and 11.82% of variability for LIM, 42.13%, 36.14% and 12.91% of variability for OIF lambs. The highest loadings were situated around 430 to 440 nm, 460 to 480 nm, 540 to 570 nm and 400 to 410 nm for ROM lambs (Figure 2); 430 to 440 nm, 460 to 480 nm, 550 to 570 nm and 400 to 410 nm for LIM lambs (Figure 3); 430 to 440 nm, 410 to 420 nm, 550 to 570 nm and 450 to 480 nm for OIF lambs (Figure 4). In LIM lambs, absorbance values at 450 to 490 nm were correlated to P lambs whereas absorbance values at 400 to 430 nm and 540 to 570 nm were correlated to S lambs (Figure 5). Similar results were found for ROM and OIF lambs (data not shown).
Loadings for the first three principal component axes (PC1, PC2 and PC3) for visible reflectance spectra of perirenal fat in Romane lambs.
Loadings for the first three principal component axes (PC1, PC2 and PC3) for visible reflectance spectra of perirenal fat in Limousine lambs.

Loadings for the first three principal component axes (PC1, PC2 and PC3) for visible reflectance spectra of perirenal fat in Ile-de-France lambs.

Score plot (a) and loading plot (b) of the two first principal component (PC) axes obtained from the visible reflectance spectra of perirenal fat of Limousine lambs, according to feeding treatment.

The PLS-DA analysis performed in M2 correctly classified 99.6% and 89.9% of the S and P ROM lambs (i.e. 96.1% on average), 99.6% and 85.7% of the S and P LIM lambs (i.e. 94.5% on average), and 97.9% and 92.2% of the S and P OIF lambs (i.e. 94.8% on average). When pooling all the data for the three breeds, the PLS-DA analysis was able to correctly classify 99.1% and 86.1% of the 636 S and 418 P lambs (i.e. 93.9% on average). The reliability of the discrimination was not significantly different when pooling all lambs for the three breeds or when using a breed-specific database (93.9% and 95.2%, respectively).
Comparison between both reflectance methods
There was a significant interaction (P<0.01) between breed, feeding treatment and method on the proportion of correctly classified carcasses. In ROM lambs, there were no significant differences between methods in the proportions of correctly classified P carcasses (87.2% v. 89.9% for M1 and M2, P=0.39) or S carcasses (100.0% and 99.6% for M1 and M2, respectively, P=0.31). In LIM lambs, there were no significant differences between methods in the proportion of correctly classified P carcasses (81.5% v. 85.7% for M1 and M2, P=0.25), whereas the proportion of correctly classified S carcasses was lower using M1 than M2 (95.8% v. 99.6% for M1 and M2, P<0.001). In OIF lambs, there were no significant differences between methods in the proportion of correctly classified S carcasses (93.5% v. 97.9% for M1 and M2, P=0.15), whereas the proportion of correctly classified P carcasses was much higher when using M2 than M1 (92.2% v. 66.7% for M2 and M1, P<0.001).
Discussion
The main objective of the present study was to investigate the between-breed variability in the reliability of the discrimination between pasture-fed and stall concentrate-fed lamb carcasses based on the perirenal fat RS, and to investigate whether a breed-specific database may be required for this purpose. In this study, the AVMI 450 to 510 was higher in P lambs than in S lambs, confirming the results obtained in previous experiments (Prache et al., Reference Prache and Theriez2003 in OIF lambs; Dian et al., Reference Dian, Andueza, Barbosa, Amoureux, Jestin, Carvaho, Prado and Prache2007a in LIM lambs; Huang et al., Reference Hocquette, Botreau, Picard, Jacquet, Pethick and Scollan2015a in ROM lambs). However, the reliability of method 1, which quantifies light absorption at wavelengths ranging from 450 to 510 nm, proved very variable across breeds, with a proportion of correctly classified lambs reaching 95.3%, 90.5% and 79.4% in ROM, LIM and OIF lambs, respectively, that is the discrimination may be considered as reliable for ROM, fairly reliable for LIM and insufficient for OIF. This between-breed variability in discriminatory ability of method 1 is likely to be due to between-breed variability in perirenal fat carotenoid content, as indicated by the mean AVMI 450 to 510 in P lambs which was found to be in the order ROM>LIM>OIF.
Differences between P OIF and P LIM lambs in AVMI 450 to 510 were possibly due to differences in the duration of the grazing period (85 v. 140 days on average for P OIF and P LIM lambs, respectively, that is a difference of 21 units in AVMI 450 to 510 when using equation (2)). Actually, PCCS was similar in OIF and LIM P lambs and the parameters of the regression of AVMI 450 to 510 on PCCS were not different between OIF and LIM P lambs.
Conversely, differences in AVMI 450 to 510 between P ROM lambs and P lambs from the other two breeds confirmed a between-breed variability in the digestive and/or metabolic fate of carotenoid pigments as recently demonstrated by Macari et al. (Reference Irie2017). Actually, PCCS was higher in ROM P lambs than in LIM and OIF P lambs, the values we observed being close to those obtained by Dian et al. (Reference Dian, Andueza, Barbosa, Amoureux, Jestin, Carvaho, Prado and Prache2007a) in LIM pasture-fed lambs (75 µg/l, range: 27 to 194) and by Dian et al. (Reference Dian, Chauveau-Duriot, Prado and Prache2007b) in ROM pasture-fed lambs (112 µg/l, range: 43 to 258). Moreover, the outcome of the variance–covariance analysis of AVMI 450 to 510 of P lambs further suggests that, beyond a higher ability to absorb and transfer carotenoid pigments into plasma, the ROM breed also has a higher ability than the LIM and the OIF breeds to store these pigments within the fat. Actually, for a given PCCS, AVMI 450 to 510 of perirenal fat was significantly higher for ROM P lambs than for LIM and OIF P lambs, the difference being of high biological amplitude. For a PCCS of 70 µg/l, for example, equation (1) predicts that AVMI 450 to 510 reaches 333, 289 and 263 units for ROM, LIM and OIF P lambs, respectively, i.e. AVMI 450 to 510 is 11% and 21% lower for LIM and OIF P lambs than for ROM P lambs.
The three variables we used to describe the animal’s and the grazing period’s characteristics (LWTP, LWGP, DP) were correlated. The respective cause-effect relationships therefore cannot be decided with certainty using the present database. Inclusion of an additional term for DP in equation (1), which was the variable most strongly correlated with AVMI 450 to 510, resulted in significant improvement, that is AVMI 450 to 510 increased linearly with an increase in DP. In this study, DP was chosen to last for at least 45 days according to the results of de Oliveira et al. (Reference Macari, Graulet, Andueza and Prache2012) who observed no significant change in AVMI 450 to 510 of perirenal fat from 45 days on a high dietary carotenoid level onwards. However, the effect of DP, although significant, was of low biological amplitude. Actually, the regression coefficient was 0.379, that is the AVMI 450-510 increased by 19 units for 50 additional days at pasture.
Despite between-breeds differences in the reliability of method 1, the threshold of the linear discriminant analysis performed on AVMI 450 to 510 was fairly similar between breeds, ranging from 213 in LIM to 245 in ROM lambs. When all the data for the three breeds were pooled, the threshold cut-off value became 224 units, which allowed to correctly classify 90.2% of the 1054 lambs. The discrimination may therefore be considered as fairly reliable when pooling all lambs for the 3 breeds.
The discriminatory ability of method 2, which used the full set of optical data at wavelengths between 400 and 700 nm, was fairly comparable across the three breeds, with a proportion of correctly classified lambs ranging from 94.5% for LIM lambs to 96.1% for ROM lambs. The improvement in discrimination reliability when taking all the reflectance spectral data into account proved therefore variable across breeds, the proportion of correctly classified lambs increasing from 95.3%, 90.5% and 79.4% when using method 1 to 96.1%, 94.5% and 94.8% when using method 2 for ROM, LIM and OIF lambs, respectively. The reliability of the discrimination was not significantly reduced when pooling all lambs for the three breeds than when using a breed-specific database (93.9% and 95.2%, respectively).
For all three breeds, the main wavelength area involved in the discrimination was that comprised between 450 and 480 nm, absorbance in this area being positively correlated to P lambs and negatively correlated to S lambs. This result confirms the importance of carotenoid pigments in discriminating between P and S lambs, in line with results obtained in previous studies (Prache et al., Reference Prache and Theriez2003; Dian et al., Reference Dian, Andueza, Barbosa, Amoureux, Jestin, Carvaho, Prado and Prache2007a; Huang et al., Reference Hocquette, Botreau, Picard, Jacquet, Pethick and Scollan2015a). The outcome of the present study indicates that other areas of the visible spectrum (400 to 430 nm and 540 to 570 nm) were involved in the discrimination between P and S lambs, as observed by Dian et al (Reference Dian, Andueza, Barbosa, Amoureux, Jestin, Carvaho, Prado and Prache2007a), absorbance in these areas being positively correlated to S lambs and negatively correlated to P lambs. Beyond carotenoid pigments, the visible region is also characteristic for the respiratory pigments, whose absorption bands in the fat RS (Soret band at wavelengths 415 to 435 nm, absorption bands at wavelengths 540 to 580 nm) are probably linked to residual haemoglobin after slaughter (Swatland, Reference Swatland1989; Prache et al., Reference Prache, Priolo and Grolier1990; Irie, Reference Huang, Andueza, Oliveira, Zawadzki and Prache2001).
Conclusions
This study showed that, beyond a higher ability to absorb and transfer carotenoid pigments into plasma, the Romane breed also has a higher ability than the Limousine and the Ile-de-France breeds to store these pigments within the fat. This between-breed variability in the routing of carotenoid pigments from fresh grass to adipose tissue led to between-breed variability in the reliability of the discrimination between pasture-fed and stall-fed lambs based on the quantification of light absorption by carotenoid pigments present in the fat (method 1). However, despite these between-breed differences, the threshold cut-off value of the discriminant analysis performed on the traceability index was fairly similar between breeds. The reliability of the discrimination was generally higher when using the full set of optical data at wavelengths between 400 and 700 nm (method 2), and it was fairly comparable across the three breeds, with a percentage of correctly classified lambs ranging from 94.5% to 96.1%. The reliability of the discrimination was not significantly reduced when pooling all lambs for the three breeds than when using a breed-specific database, 93.9% of the 1054 lambs being correctly classified. From an applied perspective, method 2 should be recommended for the Limousine and Ile-de-France breeds, whereas method 1 is already sufficient for the Romane breed.
Acknowledgements
The authors gratefully acknowledge the INRA VetAgro Sup Herbivore Mixed Research Unit for supporting this study. The authors thank J. Ballet, C. Deflisque and all staff of the INRA Unité Expérimentale des Monts d’Auvergne, P. Payard, L. Lavelle, C. Coustet and all staff of the INRA Unité Expérimentale des Ruminants de Theix, E. Guettier and all staff of the INRA Unité Expérimentale de Physiologie Animale de l’Orfrasière and J. Pourrat for their collaboration in this work.