





1. Introduction
A boundary layer will separate from its bounding surface when confronted with a sufficiently strong adverse pressure gradient (APG) or a sufficiently abrupt geometrical change. Boundary layer separation is therefore broadly categorized as either pressure-induced or geometry-induced. In the case of pressure-induced separation, the APG is generated either through local suction or by an incident shock (Sandham Reference Sandham2011). In either case, the separated shear layer can reattach to the wall to form a closed recirculating region known as a separation bubble. For incompressible flows, reattachment occurs naturally from the combined effect of the shedding of coherent structures from the shear layer and wall-normal momentum exchange accompanying turbulence (Marxen & Henningson Reference Marxen and Henningson2011; Simoni, Ubaldi & Zunino Reference Simoni, Ubaldi and Zunino2014). More broadly, reattachment can be encouraged by inducing a favourable pressure gradient (FPG) through blowing, geometrical features, shocks or compression waves.
Whether the separation bubble is pressure-, geometry- or shock-induced, the flow incompressible or compressible, and the upstream boundary layer laminar, transitional or turbulent, low frequency unsteady behaviour of the separation bubble has been observed. Among flow configurations, we observe low-frequency unsteadiness of separation bubbles involving backward-facing steps (BFSs) (cf. (A.1)), forward-facing steps (FFSs) (cf. (A.2)), forebody–splitter plate combinations (Cherry, Hillier & Latour Reference Cherry, Hillier and Latour1983; Castro & Haque Reference Castro and Haque1987; Hudy, Naguib & Humphreys Reference Hudy, Naguib and Humphreys2003), bumps (Passagia, Leweke & Ehrenstein Reference Passagia, Leweke and Ehrenstein2012), blunt plates (cf. (A.3)), flat plates (cf. (1.1)), airfoils (cf. (A.4)) and hydrofoils (Miozzi et al. Reference Miozzi, Capone, Costantini, Fratto, Klein and Di Felice2019). Yet, despite the ubiquity of low-frequency unsteadiness in the separation bubble literature, the physical mechanism by which it is produced remains unclear. Furthermore, it is unclear whether the low-frequency unsteadiness in all the aforementioned flow regimes and configurations arises from the same or similar physical mechanisms.
In the context of laminar separation bubbles (LSBs), the term ‘flapping’ is often used to describe a low-frequency-vertical motion or wavering of the shear layer and, coincidentally, to low-frequency excursions of the reattaching surface in the streamwise direction. In other words, the LSB exhibits phases of expansion and contraction largely in the aft portion. In the context of turbulent separation bubbles (TSBs), the term ‘breathing’ is instead used to describe a low-frequency growth and shrinkage of the separation bubble in length and height; therefore, both the separating and reattaching surfaces exhibit excursions upstream and downstream. Nevertheless, the terms ‘flapping’ and ‘breathing’ are often used interchangeably (Weiss et al. Reference Weiss, Little, Threadgill and Gross2021), particularly in lower Reynolds number flows. Indeed, a true distinction in terminology may do the scientific community a disservice at this stage as it insinuates that the two phenomena are unrelated while neither phenomenon is completely understood to date.
We conjecture that the flapping and breathing phenomena can be explained by similar driving physical mechanisms. We therefore opt to use the umbrella term ‘low-frequency unsteadiness’ throughout this work. Although we only consider incompressible laminar pressure-induced separation bubbles on flat plates with natural reattachment, making no assumption as to the origin of the low-frequency unsteadiness, we maintain that it is important to consider the literature for different flow regimes and configurations to develop a proper understanding of the mechanisms at play. We provide such an extended literature review in Appendix A. The body of literature on these topics is immense and often enough, but while the presence of low-frequency unsteadiness is evoked, it is not the primary focus of study. Our extended review is therefore by no means exhaustive, but serves to demonstrate the commonalities and provide direction in the study of our LSB. Below, we discuss the low-frequency unsteadiness observed strictly in the case of separation bubbles forming over flat plates.
1.1. Flat plates
In the case of TSBs forming over flat plates, there is evidence that the movement of the separation and reattachment surfaces results from the advection of coherent structures originating upstream of separation in the zero pressure gradient (ZPG) boundary layer. For example, Na & Moin (Reference Na and Moin1998) study a pressure-induced TSB forming over a flat plate using direct numerical simulation (DNS;  ${{Re}}_\theta = 300$, where
 ${{Re}}_\theta$ is the Reynolds number based on the inlet free stream velocity and momentum thickness
 $\theta$). They feed a modulated frozen turbulent velocity field at the inlet of the domain, preserving physically realistic structural features of the boundary layer. For ZPG turbulent boundary layers (TBLs), large-scale and very large-scale motions can develop (Hutchins & Marusic Reference Hutchins and Marusic2007; Lozano-Durán & Jiménez Reference Lozano-Durán and Jiménez2014; Hack & Schmidt Reference Hack and Schmidt2021) and they may therefore have an important effect on the separation bubble. Na & Moin (Reference Na and Moin1998) clearly observe the separation and reattachment surfaces to move upstream and downstream, the low frequency being more clearly observed at the reattachment end, suggesting an inherent amplification of this frequency regime. Similar observations were also made experimentally by Simpson, Chew & Shivaprasad (Reference Simpson, Chew and Shivaprasad1981a,Reference Simpson, Chew and Shivaprasadb) and Patrick (Reference Patrick1987). In particular, Na & Moin (Reference Na and Moin1998) demonstrate that an alternating pattern of high- and low-speed streaks originating from the upstream ZPG TBL create a spanwise undulation of the separation surface. No undulations are observed in the reattachment surface. Turbulent hairpin-like structures, likely accompanied by the streaks (Adrian Reference Adrian2007), amplify within the shear layer of the separation bubble, agglomerate and impinge on the wall at reattachment. They observe that their growth along the shear layer coincides with an expansion of the aft portion of the bubble, and their impingement on the wall a contraction.
If the passage of these large-scale motions is related to the low-frequency unsteadiness in flat plate TSBs, then there is interest in exploring similar structures as the underlying mechanism for flat plate LSBs. However, in the case of LSBs, the upstream flow is laminar and may possess only some level of free stream turbulence. For similar large-scale motions to be responsible for the low-frequency unsteadiness in LSBs, they must therefore be generated and/or sufficiently amplified by the separated flow before reattachment to produce a notable excursion of the reattachment surface and, consequently, an expansion/contraction of the bubble.
Simoni et al. (Reference Simoni, Ubaldi and Zunino2014) investigate an LSB forming over a flat plate experimentally with an inlet turbulence intensity of 1.5 %. They demonstrate the presence of a low-frequency band in the velocity spectra that is amplified up to and past separation. Likewise, they observe an amplification of the streamwise velocity fluctuations in the fore portion of the bubble (Simoni, Ubaldi & Zunino Reference Simoni, Ubaldi and Zunino2012), which suggests the presence and growth of streamwise streaky structures. Such structures have also been observed to form in the DNS by McAuliffe & Yaras (Reference McAuliffe and Yaras2010) and Lardeau, Leschziner & Zaki (Reference Lardeau, Leschziner and Zaki2012). Simoni et al. (Reference Simoni, Ubaldi and Zunino2014) propose that low-frequency disturbances in the free stream in the form of streamwise vortices induce the formation of alternating low- and high-speed streamwise streaky structures upstream of separation. These structures grow exponentially in the fore portion of the bubble and saturate prior to the formation of the spanwise rollers.
Hosseinverdi & Fasel (Reference Hosseinverdi and Fasel2019) explicitly investigate the role of free stream turbulence, with intensity 0.1 % to 3 %, in LSBs forming over a flat plate using DNS. They demonstrate that vortical free stream turbulent fluctuations induce the growth of low-frequency Klebanoff modes (spanwise alternating streamwise streaks) within the separation bubble. As the free stream turbulence intensity increases, the low-frequency Klebanoff mode is observed to be more pronounced and dominates the transition process. In the absence of external disturbances, the streaks are no longer observed and transition to turbulence occurs purely as a result of the Kelvin–Helmholtz instability. By contrast, the blunt plate simulations of Tafti & Vanka (Reference Tafti and Vanka1991b) described in § A.3 did not explicitly introduce any free stream disturbances and yet the low-frequency unsteadiness was observed. Likewise, Spalart & Strelets (Reference Spalart and Strelets2000) conduct a DNS of an LSB over a flat plate created through an applied suction. They still observe wavering or flapping of the shear layer in their simulations despite actively suppressing upstream disturbances down to  $O(10^{-4})$ using their fringe method. Vorticity begins to appear early within the separation bubble and this is accompanied by ‘peaks’ and ‘valleys’ of their scalar field (cf. figure 1 in their study) which can be seen close to the wall prior to and downstream of reattachment. This is consistent with the presence of streaky structures and the correlations of
 $(\pm u, \mp v)$ observed by Tafti & Vanka (Reference Tafti and Vanka1991b) in the case of a blunt plate (cf. (A.3)). The amplification of small upstream vortical perturbations may therefore be a sufficient but not a necessary condition for the formation of streaks and the observation of the low frequency in LSBs.
Disturbances in the case of LSBs in general may not only result from free stream turbulence, but may also arise naturally from absolute instability (Wee et al. Reference Wee, Yi, Annaswamy and Ghoniem2004). A local spatial region of absolute instability can act as a global oscillator, allowing disturbances to propagate and amplify both upstream and downstream in the absence of external sources (Huerre & Monkewitz Reference Huerre and Monkewitz1990). Several studies use the peak reversed flow as an indicator for absolute instability in LSBs forming over a flat plate (Pauley, Moin & Reynolds Reference Pauley, Moin and Reynolds1990; Hammond & Redekopp Reference Hammond and Redekopp1998; Rist & Maucher Reference Rist and Maucher2002; Embacher & Fasel Reference Embacher and Fasel2014). Absolute instability of LSBs towards a three-dimensional (3-D) state has been suggested to occur for peak reversed flows of at least 16 % of the free stream velocity (Alam & Sandham Reference Alam and Sandham2000; Rist & Maucher Reference Rist and Maucher2002; Embacher & Fasel Reference Embacher and Fasel2014). However, as noted by Rodríguez, Gennaro & Souza (Reference Rodríguez, Gennaro and Souza2021), some studies demonstrate a 3-D state of the LSB for peak reverse flows below 8 % in the absence of explicit external disturbances. They therefore examine the absolute instability of LSBs without external disturbances using DNS. They demonstrate that the primary instability gives rise to spanwise modulations of the nominally two-dimensional (2-D) separation bubble and the global oscillator becomes self-sustained for peak reverse flows above 8 %. In addition, they observe that absolute instability is consistent with the criterion proposed by Avanci, Rodríguez & Alves (Reference Avanci, Rodríguez and Alves2019), namely, when an inflection in the streamwise velocity occurs below the dividing streamline of the LSB.
1.2. Scope and objectives
It is rather widely observed that low-frequency unsteadiness is directly linked to the advection of large scale coherent structures in the flow. We conjecture the driving mechanism to be the same in LSBs and TSBs, and we must therefore observe similar coherent structures in both cases, regardless of their origin. In this work, we aim to demonstrate that the generation and passage of the commonly observed large-scale high- and low-speed streamwise streaky motions are responsible for the low frequency. In TSBs, they are influenced by the very large-scale motions (streaks) already present in structurally developed TBLs. In LSBs, these structures are generated via the amplification of disturbances present either in the free stream or generated through instability within the bubble. The LSB of Spalart & Strelets (Reference Spalart and Strelets2000) is reported to exhibit the flapping motion, which is associated with the low-frequency unsteadiness, in the absence of explicit external disturbances. Therefore, we consider the same LSB as Spalart & Strelets (Reference Spalart and Strelets2000) to further explore the low-frequency characteristics of the flow. The details of the numerical simulations are discussed in § 2.
In §§ 3.1 and 3.2, we respectively compare the mean and instantaneous flow behaviours of our LSB to the original results of Spalart & Strelets (Reference Spalart and Strelets2000) for validation. We clearly demonstrate the existence of the low frequency for the LSB in § 3.3. With our hypothesis that the low-frequency unsteadiness is driven by the advection of coherent structures, we reveal these structures using modal decomposition methods in § 3.4 and discuss their influence using reduced-order models. In § 4, we summarize the major results of this work and offer some concluding remarks.
2. Numerical simulations
We perform a DNS within a rectangular computational domain with physical size  $8h \times 1h \times 0.6h$, as shown in figure 1. This domain is adjusted to the computational domain used by Spalart & Strelets (Reference Spalart and Strelets2000) as a reference benchmark. Moreover, the objective here is also to identify whether a low-frequency phenomenon is present in these benchmarks, as the phenomenon is sometimes evoked, but rarely explored in detail, except in recent years where an increasing number of studies focus on it. The streamwise, wall-normal and spanwise directions are denoted by
 $x$,
 $y$ and
 $z$, respectively. The flow evolves in the streamwise direction. All parameters are non-dimensionalized with respect to the height of the domain
 $h$ and the free stream velocity
 $U_{\infty }$.
Schematic of the flow configuration used for the direct numerical simulation of an incompressible pressure-induced laminar separation bubble over a flat plate.

The boundary condition at the inlet plane is specified as a laminar Blasius velocity profile having free stream velocity  $U_{\infty }$ and boundary layer thickness
 $\delta _B = 0.0258$. A no-slip boundary condition is imposed at the bottom wall (
 $y = 0$). The boundary condition along the spanwise direction is taken as periodic due to the assumption of flow homogeneity in this direction. To generate an APG, a wall-normal suction velocity profile is imposed within a narrow streamwise region on the top wall (cf. figure 1). Flow separation therefore occurs as a result of the suction velocity which produces a sufficiently strong APG. The suction velocity distribution is defined using a Gaussian function, namely,
 \begin{equation} V_{top}(x)= V_{max} \exp{\left(-\frac{\left (x-x_c \right)^2}{\sigma^{2}}\right)}, \end{equation}
where  $V_{max}$ is the maximum suction velocity,
 $x_c$ is the centre of the imposed suction region and
 $\sigma$ is the characteristic width of the suction profile (Spalart & Strelets Reference Spalart and Strelets2000). The nominal deceleration parameter, introduced by Pauley et al. (Reference Pauley, Moin and Reynolds1990) and Spalart & Strelets (Reference Spalart and Strelets2000), integrates both
 $V_{max}$ and
 $\sigma$ into a single parameter
 $S$,
 \begin{equation} S = \frac{1}{hU_{\infty}}\int_{0}^{L_x}V(x)\,{{\rm d}\kern0.7pt x}. \end{equation}
Spalart & Strelets (Reference Spalart and Strelets2000) demonstrated that the flow can separate from the wall without requiring any incoming disturbances by defining the parameters of the suction velocity profile as  $\sigma =0.24h$ and
 $V_{max}=0.7U_{\infty }$, indicating
 $S=0.3$. The Reynolds number at the location of peak suction velocity in their work was determined at
 ${Re}_{x_c} = 10^5$ and the Reynolds number based on the height is
 ${Re}_{h} = {Re}_{x_c}/3$. The value of
 $S$ indicates that 30 % of the flow rate is extracted from the inflow. Here, we use the same parameters and choose
 $x_c=2.5h$.
Since an inviscid boundary condition is applied on the top wall, the other two velocity components are adjusted so that zero spanwise ( $\omega _z$) and streamwise (
 $\omega _x$) vorticity conditions are satisfied, namely,
 \begin{equation} \omega_z| _{x,h,z,t}= \left. \left(\frac{\partial v}{\partial x}-\frac{\partial u}{\partial y} \right) \right| _{x,h,z,t}=0, \quad \omega_x| _{x,h,z,t}= \left. \left(\frac{\partial w}{\partial y}-\frac{\partial v}{\partial z} \right) \right| _{x,h,z,t}=0, \end{equation}
and therefore
 \begin{equation} \left.\frac{\partial u}{\partial y} \right| _{x,h,z,t}= \frac{{\rm d}V_{top}(x)}{{\rm d}\kern0.7pt x}, \quad \left.\frac{\partial w}{\partial y} \right| _{x,h,z,t}= 0. \end{equation}
A convective boundary condition, proposed by Lowery & Reynolds (Reference Lowery and Reynolds1986), is applied at the outlet section for all velocity components  $u_i$:
 \begin{equation} \frac{\partial u_i}{\partial t}+ u_c \frac{\partial u_i}{\partial x}=0, \end{equation}
where  $u_c$ is the local streamwise velocity at the outlet section. This condition enables vortices to move out of the domain without considerable disturbances (Pauley, Moin & Reynolds Reference Pauley, Moin and Reynolds1988). The initial condition is set to zero without any perturbations.
The incompressible Navier–Stokes equations with the above boundary conditions are solved numerically using DNS calculations. The finite difference code Incompact3d is used to simulate the flow (Laizet & Lamballais Reference Laizet and Lamballais2009; Laizet & Li Reference Laizet and Li2011). A highly refined mesh with a sufficiently small time step is required in the DNS simulation to resolve all the spatial and temporal scales of turbulent motion. The domain is discretized on a Cartesian grid of  $851 \times 257 \times 128$ points, with a sixth-order finite-difference compact scheme in space, while the time integration is performed with a third-order Adams–Bashforth scheme with a time step
 $\Delta t=2.5\times 10^{-4}$ (non-dimensionalized by
 $h/U_\infty$). The grid is uniform in the streamwise and spanwise directions, whereas a stretched grid is used in the wall-normal direction. Based on the mean skin friction velocity after separation, the streamwise and spanwise spacings are respectively 8.3 and 4.1 wall units. In the wall-normal direction, the minimum grid spacing is
 $\Delta y^+ = 0.9$, which is made possible since the code Incompact3d uses a spatial scheme designed to introduce a small amount on numerical dissipation at wavenumbers close to the cutoff wavenumber (Lamballais, Fortuné & Laizet Reference Lamballais, Fortuné and Laizet2011). The maximum grid spacing is
 $\Delta y^+ = 8.3$ at the maximum height reached by turbulent fluctuations, which yields a grid spacing of approximately 5–10 times the Kolmogorov length scale after the vortex breakdown. To investigate the spectral content of the flow and, in particular, to observe whether low-frequency unsteadiness is present, the simulation time for the DNS surpasses
 $1650$, representing over
 $6.6\times 10^6$ iterations. To achieve this goal, computations are performed on 1200 computational cores on Niagara, a Digital Research Alliance of Canada compute cluster housed by the University of Toronto.
All spectral analyses are based on Welch's method by averaging Fourier transform of segments of the fluctuating quantity windowed with the Hamming window, and using an overlap of  $50\,\%$. To improve statistical convergence, averages also include spectra from each spanwise position.
3. Results and discussion
As outlined in § 2, in this study, we consider the same LSB as Spalart & Strelets (Reference Spalart and Strelets2000). In their study, they identify that the shear layer does indeed undergo a ‘flapping’ or ‘wavering’ motion; however, the mechanism behind this unsteadiness was not of primary interest and its frequency was not determined. In a similar fashion to Spalart & Strelets (Reference Spalart and Strelets2000), we first describe the mean flow behaviour in § 3.1 followed by the instantaneous flow in § 3.2. These two sections serve partly to validate our DNS against that of Spalart & Strelets (Reference Spalart and Strelets2000) and, more importantly, to demonstrate additional features of the LSB that we observe to be relevant to the low-frequency unsteadiness. We further characterize the low-frequency unsteadiness in § 3.3 and explore the coherent structures that play a role in the physical manifestation of the phenomenon in § 3.4.
3.1. Mean flow behaviour
Figure 2 permits the definition of a reference separation bubble using the time- and spanwise-averaged flow. We denote time- and spanwise-averaged quantities using a tilde (e.g.  $\tilde {U}$). The streamlines (solid black lines) clearly depict the recirculating region within the LSB. The core of the mean recirculating region occurs slightly downstream of the mean bubble height (
 $\tilde {h}_b = 0.15$ at
 $\tilde {x} = 3.19$). The mean separation and reattachment points occur at
 $\tilde {x}_s = 1.76$ and
 $\tilde {x}_r = 3.80$, respectively, which we can also visually identify in figure 2 with the help of the
 $\tilde {U} = 0$ isocontour (dashed white line) separating the forward and reverse flow regions. The mean bubble length is therefore
 $\tilde {L}_b = 2.04$. The mean bubble height, length and streamline pattern agree with those of Spalart & Strelets (Reference Spalart and Strelets2000) (cf. figure 9 in their study). Contours of averaged streamwise velocity show a significant proportion of reversed flow within the LSB relative to the portion of forward flow. In other words, the portion or area of the LSB below the
 $\tilde {U} = 0$ isocontour is larger than that between the
 $\tilde {U} = 0$ isocontour and the dividing streamline of the bubble. The curvature of the streamlines near the wall centred at approximately
 $\tilde {x} = 2.7$ suggests that a small secondary bubble has formed within the larger primary bubble. We note here that the presence of a secondary bubble in this study may very well play a role in the mechanism behind the low-frequency unsteadiness. Cherubini, Robinet & De Palma (Reference Cherubini, Robinet and De Palma2010) demonstrate that such a topological change in the base flow of a 2-D LSB can produce a low-frequency unsteadiness as a result of the superposition of convective non-normal modes. However, Pauley et al. (Reference Pauley, Moin and Reynolds1990) observe a quasi-periodic phenomenon in their 2-D LSB simulations where the secondary bubble grows and pinches off a portion of the larger bubble which is then advected downstream. We do not observe such a pinch-off phenomenon in our 3-D simulations. Nevertheless, as suggested by the work of Tafti & Vanka (Reference Tafti and Vanka1991b), low-frequency unsteadiness appears to require a 3-D study and it is likely not the case that a 2-D analysis can adequately capture the dynamics of the phenomenon.
Time- and spanwise-averaged streamwise velocity  $\tilde {U}$ of the laminar separation bubble. Streamlines are depicted using solid black lines and the
 $\tilde {U} = 0$ isocontour using a dashed white line.

In figure 3, we illustrate several critical curves to further characterize the time- and spanwise-averaged separation bubble. The dividing streamline (solid black line) is computed as the locus of points where the integral of the streamwise velocity is zero starting from the wall (i.e.  $\int _0^{y_{d}}\tilde {U}(x,y)\,\mathrm{d}y = 0$). The dividing streamline is skewed towards the aft portion of the bubble, in other words, the streamwise length from separation to peak (
 $\Delta \tilde {x} = 1.43$) is longer than that from peak to reattachment (
 $\Delta \tilde {x} = 0.61$). The skewed shape of the bubble is expected given the overall direction of the flow, causing a general streamwise elongation of the bubble, and the rapid transition to turbulence in the aft portion of the bubble, prompting rapid reattachment. Given the enlarged wall-normal scale in figure 3, we can observe the dividing streamline of the secondary bubble. The mean separation and reattachment points of the secondary bubble are located respectively at
 $\tilde {x}_{s_2} = 3.01$ and
 $\tilde {x}_{r_2} = 2.85$. Bear in mind that
 $\tilde {x}_{r_2} < \tilde {x}_{s_2}$ for the secondary bubble as it separates downstream and reattaches upstream due to the reverse flow induced by the primary bubble. The isocontour
 $\tilde {U} = 0$ (dashed red line) in figure 3 demonstrates more clearly the significant portion of reverse flow present in the separation bubble relative to the portion of forward flow contained between the dividing streamline and the
 $\tilde {U} = 0$ isocontour. The locus of points marking the locations of maximum reverse flow (dash-dotted blue line) demonstrates the asymmetry within the region of reversed flow (i.e. below
 $\tilde {U} = 0$). The maximum reversed flow
 $\tilde {u}_{rev} = 16.8\,\%$ occurs at
 $\tilde {x} = 3.32$ and
 $\tilde {y} = 0.0135$. The present LSB therefore possesses a maximum reverse flow within the range of absolute instability proposed by Alam & Sandham (Reference Alam and Sandham2000) and Rist & Maucher (Reference Rist and Maucher2002). The locations of peak reversed flow occur further away from the wall in the fore portion of the bubble than in the aft portion, this again being due to transition to turbulence in the aft portion. The location of peak reversed flow occurs furthest from the wall between the peak height and reattachment of the secondary bubble
 $(\tilde {x} = 2.90)$. The locus of the first inflection points of the streamwise velocity from the wall (solid green line) highlights the importance of the secondary bubble in the observed behaviour of the primary bubble. The inflection curve begins at
 $\tilde {x}_{i} = 2.60$. Avanci et al. (Reference Avanci, Rodríguez and Alves2019) propose that absolutely unstable Kelvin–Helmholtz waves for an LSB requires that the inflection point falls below the dividing streamline. For the present LSB, the formation of the secondary bubble is accompanied by a surrounding ‘bubble’ of inflection of the streamwise velocity profile lying within the dividing streamline of the larger primary bubble. The proposed condition of Avanci et al. (Reference Avanci, Rodríguez and Alves2019) is therefore satisfied, on average, in the present study. We therefore expect to observe upstream propagation of disturbances and unstable behaviour in the vicinity of
 $\tilde {x}_{i} = 2.60$. Cherubini et al. (Reference Cherubini, Robinet and De Palma2010) demonstrate that disturbances introduced in the first half of a (2-D) LSB are amplified to nearly the same extent as disturbances introduced entirely upstream of separation. If the low-frequency unsteadiness is a phenomenon that is excited by free stream disturbances, an absolute instability within the LSB combined with the observations of Cherubini et al. (Reference Cherubini, Robinet and De Palma2010) suggest that free stream disturbances may not be a necessary criterion for the onset of low-frequency unsteadiness in LSBs when a secondary bubble is formed.
Time- and spanwise-averaged dividing streamlines (solid black lines),  $\tilde {U} = 0$ isocontour (dashed red line), maximum reversed flow (dash-dotted blue line) and streamwise velocity inflection (solid green line).

Figure 4 shows the evolution of the wall pressure and friction coefficients in the streamwise direction computed from the time- and spanwise-averaged flow field. To compare with the results of Spalart & Strelets (Reference Spalart and Strelets2000) whose separation point occurs at  $\tilde {x}_s = 2.25$, we simply shift their data upstream such that their separation point coincides with that of the present study (
 $\tilde {x}_s = 1.76$). This shift is due to the treatment of their inflow and outflow with the fringe method that ends at
 $x \simeq 0.5$ from the domain virtual origin, thus imposing a ‘useful region’ smaller than the full computational domain. The wall pressure coefficient, shown in figure 4(a), is defined by
 $\tilde {C}_p = (\tilde {P} - P_{\infty })/(\frac {1}{2}\rho U_{\infty }^2)$, where
 $P_{\infty }$ is the pressure at the inlet section and
 $\tilde {P}$ is the time- and spanwise-averaged wall pressure. The wall pressure coefficient agrees very well with the DNS of Spalart & Strelets (Reference Spalart and Strelets2000). The presence of the suction profile (peak at
 $x = 2.50$) causes an APG to begin to develop upstream of separation, resulting in a gradual thickening of the boundary layer (cf. figure 5) and increase in
 $\tilde {C}_p$. A pressure plateau then arises from the displacement of the boundary layer accompanying the separated flow in the vicinity of peak suction. This is followed by a steep increase in pressure prior to and past reattachment
 $(\tilde {x}_r = 3.80)$ due to the transition to turbulence. The wall pressure coefficient eventually reaches a constant value towards the end of the flow domain (
 $x = 8$), which is different from the inlet value due to the portion of flow that is extracted and not reinjected.
(a) Time- and spanwise-averaged wall pressure coefficient  $\tilde {C}_p$. (b) Time- and spanwise-averaged skin friction coefficient
 $\tilde {C}_f$ (solid black line) and fluctuating skin friction coefficient
 $\tilde {C}'_f$ (dashed blue line). The results of Spalart & Strelets (Reference Spalart and Strelets2000) are represented by the circular markers.

(a) Time- and spanwise-averaged displacement thickness  $\tilde {\delta }^*$ and (b) momentum thickness
 $\tilde {\theta }$. Solid lines denote the results of the present study and the circular markers those of Spalart & Strelets (Reference Spalart and Strelets2000).

We present the skin friction coefficient  $\tilde {C}_f = \tilde {\tau }_w /(\frac {1}{2}\rho U_{\infty }^2)$ (solid black line) and its fluctuating counterpart
 $\tilde {C}'_f$ (dashed blue line) with streamwise position in figure 4(b), where
 $\tilde {\tau }_w$ is the time- and spanwise-averaged wall shear stress. The locations of the mean separation and reattachment points are defined as the points where
 $\tilde {C}_f$ is zero and where
 $\tilde {C}'_f$ has attained a local maximum. It is interesting to observe that
 $\tilde {C}'_f$ peaks at mean separation, implying that the separation surface does exhibit some small excursions in the streamwise direction. Past mean separation
 $(\tilde {x}_s = 1.76)$, the skin friction coefficient
 $\tilde {C}_f$ attains a local minimum followed by a weak increase in amplitude (positive slope). The skin friction does cross the abscissa and changes sign in the range
 $2.80 < \tilde {x} < 2.94$, which agrees with the location of the secondary bubble described earlier using its dividing streamline. We observe that the results of Spalart & Strelets (Reference Spalart and Strelets2000) indicate a minimum
 $\tilde {C}_f$ slightly larger in magnitude than that of the present study. Furthermore, the skin friction coefficient of Spalart & Strelets (Reference Spalart and Strelets2000) shows slight variations particularly past reattachment whereas our results show a smooth decay. The observed differences in the skin friction coefficient (as well as in the displacement and momentum thicknesses in figure 5) with those of Spalart & Strelets (Reference Spalart and Strelets2000) are likely due to the long time interval used for averaging in our study, namely,
 $5\,600$ snapshots spanning a total non-dimensional time of 1400 (
 $\Delta t = 0.25$). No significant differences are observed using a longer averaging time.
Following Spalart & Strelets (Reference Spalart and Strelets2000), we also present the time- and spanwise-averaged displacement  $\tilde {\delta }^*$ and momentum
 $\tilde {\theta }$ thicknesses in figure 5 and compare with their results for validation. Following their approach, the boundary layer thicknesses are computed based on the pseudo-free stream velocity defined as the integral of the spanwise vorticity along the wall-normal direction
 $\bar {U}(x,y)= -\int _{0}^{y}\omega _z (x,y')\,\mathrm {d}y'$. The displacement thickness
 $\tilde {\delta }^*$ (cf. figure 5a) increases slowly up to separation due to the upstream influence of the imposed APG. The displacement thickness then increases abruptly as the boundary layer separates from the wall and peaks near the maximum bubble height
 $(\tilde {x} = 3.19)$. Approaching reattachment, the bubble height is diminished and therefore accompanied by a decrease in displacement thickness which continues past reattachment until attaining a weakly increasing plateau in the TBL. The momentum thickness
 $\tilde {\theta }$ (cf. figure 5b), however, increases slowly up to the location of the secondary bubble and the onset of spanwise roller formation where a slight decrease is observed. This location occurs slightly before the maximum bubble height where breakdown of spanwise rollers appears to begin. The breakdown of spanwise rollers results in an important loss of momentum in the boundary layer and consequently a rapid increase in momentum thickness until also attaining a weakly increasing plateau in the developing TBL. Again, the observed differences in the boundary layer thicknesses with those of Spalart & Strelets (Reference Spalart and Strelets2000), particularly past reattachment, are likely due to averaging over a longer time interval in our study.
3.2. Instantaneous flow behaviour
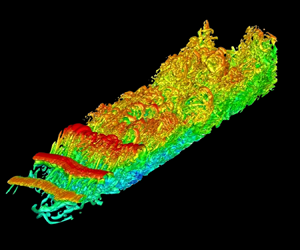
In figure 6, we visualize unsteady vortical structures using isosurfaces of  $\lambda _2$ (Jeong & Hussain Reference Jeong and Hussain1995) at a selected time instant (
 $t = 1146.5$), where the colour scale represents the local instantaneous streamwise velocity. Shedding of coherent spanwise rollers occurs near
 $x = 2.7$, which is situated close to the start of the mean inflection curve of the secondary bubble
 $(\tilde {x}_i = 2.60)$. The vortex shedding occurs at a frequency (equivalent to a Strouhal number, based on
 $U_\infty$ and
 $h$) of
 $St = 1.56$ based on the pre-multiplied power spectral density (PSD) of the velocity fluctuations
 $u'$ and
 $v'$ close to the mean position of maximum bubble height
 $(x,y,z) = (3,0.15,0)$; cf. figure 7. The rollers are shed from the shear layer with what appears to be immediate spanwise undulations having a spanwise wavelength of approximately twice that of the streamwise wavelength, as also observed by Michelis, Yarusevych & Kotsonis (Reference Michelis, Yarusevych and Kotsonis2018). Such spanwise undulations can arise as a result of unstable oblique disturbances present upstream of shear layer rollup (Michelis et al. Reference Michelis, Yarusevych and Kotsonis2018). Oblique disturbances may be present entirely upstream of separation as a result of upstream propagation of numerical error (Spalart & Strelets Reference Spalart and Strelets2000). Nevertheless, we also observe near-wall vortical structures in figure 6 as early as
 $x = 2.6$, in particular, the lifting-up and reversal of a
 $\varLambda$-like vortex initially propagating upstream due to the reversed flow near the wall. The formation of the near-wall structures occurs necessarily at the expense of streamwise momentum, retarding the flow in its vicinity. This may be a cause of the observed undulation in the spanwise rollers. However, at this stage, we may also conjecture the reverse and suggest that the spanwise undulation of the rollers, due to some underlying instability, induces a secondary or tertiary instability near the wall. Following the formation of the spanwise rollers, their breakdown begins near the mean location of maximum bubble height
 $(\tilde {x} = 3.19)$, as also observed by Simoni et al. (Reference Simoni, Ubaldi and Zunino2014). Breakdown of the rollers is a result of several factors including secondary instabilities of and between the vortex cores (Marxen, Lang & Rist Reference Marxen, Lang and Rist2013) and, as we observe, their interaction with the structures forming at the wall. The transition to turbulence occurs abruptly prior to reattachment, within only 2–3 streamwise wavelengths.
Instantaneous isosurfaces of  $\lambda _2=-5$, coloured by streamwise velocity, in perspective and top views at
 $t = 1146.5$.

Pre-multiplied power spectral density of instantaneous velocity at  $x = 3$,
 $y = 0.15$ and
 $z = 0$ for (a)
 $u'$ and (b)
 $v'$.

We further dissect the 3-D behaviour in figure 8 using contours of vorticity magnitude at the same instant within the wall plane, a spanwise boundary and within the  $x = 2.6$,
 $3.0$,
 $3.9$ and
 $4.5$ planes. In the wall plane, vorticity magnitude appears as far upstream as
 $x \sim 2.4$, demonstrating that the small-scale near-wall structures observed in figure 6 emerge and develop prior to shear layer rollup and even before the mean streamwise velocity inflection caused by the secondary bubble. The transverse planes at
 $x = 2.6$ and
 $3.0$ show a considerable increase in vorticity magnitude generated within the bubble (i.e. below the clearly visible shear layer). By
 $x = 3.9$, just past reattachment, the vorticity magnitude already suggests a rather turbulent flow and we begin to see the ‘peaks’ and ‘valleys’ observed by Spalart & Strelets (Reference Spalart and Strelets2000). Packets of vorticity are being ejected away from the wall (the ‘peaks’), while other portions are drawn towards the wall (the ‘valleys’). These peaks and valleys persist downstream and possess the same spanwise wavelength as the undulations we observe in the spanwise rollers. At
 $x = 4.5$, the peaks and valleys of vorticity are more apparent and appear in reverse order from those at
 $x = 3.9$. From the vorticity plotted in the spanwise boundary, we observe that the structures at
 $x = 4.5$ are part of a disconnected packet of vorticity from those at
 $x = 3.9$.
Contours of vorticity at the bottom wall, the  $z = -0.3$ plane and at selected
 $yz$ planes at
 $x = 2.6$,
 $3.0$,
 $3.9$ and
 $4.5$.

In figure 9, we show isosurfaces of  $u' = -0.12$ (blue) and
 $u' = 0.12$ (red) at the same time instant of figures 6 and 8. We observe that the ‘peak’ observed in the
 $x = 4.5$ plane coincides with a region of negative
 $u'$ and the ‘valley’ with a region of positive
 $u'$. The portions of fluid ejected from the wall are therefore deficient in streamwise momentum relative to the mean. The regions of positive and negative
 $u'$ occur on a rather large scale displaying a spanwise wavelength of the order of the domain width (
 $\lambda _z \sim 0.6$) and an elongation in the streamwise direction (
 $\lambda _x > 1$), similar to the large-scale ejection and sweep motions observed in TBLs in the form of streaks (Adrian Reference Adrian2007). Spalart & Strelets (Reference Spalart and Strelets2000) identify streaks further downstream, yet in figure 9, we can observe the streaks extending well within the LSB (
 $\tilde {x}_r = 3.80$). Hosseinverdi & Fasel (Reference Hosseinverdi and Fasel2019) recently demonstrated the importance of the occurrence and amplification of streaks in LSBs as they play an important role in the transition process for moderate (
 $0.5$ to
 $1$ %) to high (
 $2$ to
 $3$ %) free stream turbulence intensity. In our study, free stream turbulence is due only to numerical error and is
 $O(10^{-5})$ to
 $O(10^{-4})$. The Klebanoff (or K) mode is therefore not expected to be a dominant mechanism in the transition to turbulence of the present LSB in view of the work of Hosseinverdi & Fasel (Reference Hosseinverdi and Fasel2019).
Instantaneous isosurfaces of  $| u'| = 0.12$, represented by blue (negative
 $u'$) and red (positive
 $u'$).

Figure 10 shows the probability density function with respect to the variables  $u'$ and
 $v'$ within the 3-D domain at two time instants, one at which the LSB appears smaller than the mean (
 $t = 1370.75$) and the other at which it appears larger than the mean (
 $t = 1146.5$). When the LSB appears smaller (
 $t = 1370.75$), the probability density function shows predominant fluctuations in the fourth quadrant
 $(Q4)$, namely, fluctuations having positive
 $u'$ and negative
 $v'$. When the LSB appears larger (
 $t = 1146.5$), the probability density function shows predominant fluctuations in the second quadrant
 $(Q2)$, namely, fluctuations having negative
 $u'$ and positive
 $v'$. A predominance of sweep-like structures
 $(Q4)$ is therefore linked to shrinkage of the bubble relative to the mean and of ejection-like structures
 $(Q2)$ to growth of the bubble. While we certainly do not have a fully developed TBL, it is interesting to observe that the quadrant analysis is converging towards what is expected in TBLs (Adrian Reference Adrian2007).
Normalized probability density function of  $u'$ and
 $v'$ within the 3-D domain (a) when the LSB is smaller than the mean size (
 $t = 1370.75$) and (b) when the LSB is larger than the mean size (
 $t = 1146.5$). The colour scale represents the probability from white (zero) to black (one).

Marxen & Rist (Reference Marxen and Rist2010) demonstrate the role of so-called mean flow deformation in LSBs, where the amplification of disturbances causes a reduction in the mean size of the bubble. From the perspective offered by the quadrant analysis, the addition of the mean flow will ‘shift’ events from the second quadrant of the  $(u', v')$ plane into the first quadrant of the
 $(u, v)$ plane, while events in the fourth quadrant will largely remain within the fourth quadrant. The presence or development of disturbances in the present LSB therefore bias the flow towards the fourth quadrant in the
 $(u, v)$ plane (sweep-like motions) such that a simple ensemble mean will forcibly produce events in the second quadrant, whether these events are physical or not. In other words, in the case of an LSB, it may be more beneficial to our understanding if we adopt the perspective of a base flow with perturbations rather than the classical turbulence approach of an ensemble mean with fluctuations. The reduction in the size of the bubble associated with a receding reattaching surface can then be seen as the passage of a group of sweep-like perturbations with varying spanwise intensity emerging either from within the LSB or from free stream turbulence upstream of the LSB. Conversely, the growth of the bubble associated with the downstream excursion of the reattaching surface corresponds to a return to an ‘unforced’ state when these perturbations pass. This perspective is not only consistent with the observed mean flow deformation in LSBs (Marxen & Rist Reference Marxen and Rist2010), but provides a link between the ‘flapping’ dynamics and the observation of spanwise alternating patterns of streak-like motions in the fluctuating flow field.
3.3. Low-frequency unsteadiness
In figure 11, we show the variation of the spanwise-averaged wall pressure with time in the aft portion of the LSB. The location of the mean reattachment point is marked by a dashed white line. The spectral content of the spanwise-averaged wall pressure is clearly rich in frequencies, similar to experimental (Mohammed-Taifour & Weiss Reference Mohammed-Taifour and Weiss2016) and numerical (Wu, Meneveau & Mittal Reference Wu, Meneveau and Mittal2020) observations from TSBs. We observe several intermittent events acting over many different time scales, from frequencies in the range of the vortex shedding  $(St \sim 1)$ to very low frequencies
 $(St \sim 0.001)$. Excursions on a time scale of
 $t \sim 100$ are also apparent and, upon closer inspection, we observe excursions on a time scale of
 $t \sim 10$. These lower frequency excursions of the wall pressure occur most clearly prior to reattachment (i.e. between
 $x \sim 3.4$ and
 $3.7$). The continuous wavelet transform of the wall-pressure fluctuations at
 $x = 3.0$ (figure 12a) shows the dominance of the high-frequency regime at
 $St \sim 1.5$, where vortex shedding occurs. Low-frequency signatures are also observed. Closer to reattachment, at
 $x = 3.47$ (figure 12b), the low-frequency regime with
 $St \sim 0.1$ is predominant. Signatures at even lower frequencies are also clearly observed, as low as
 $St \sim 0.01$. However, such events are characterized by a strong intermittency which may not be clearly detected by more classical spectral analysis.
Evolution of spanwise-averaged wall pressure with time.

Wavelet analysis of spanwise-averaged wall pressure at (a)  $x = 3.0$ and (b)
 $x = 3.47$.

To further examine the frequency content of the wall pressure, figure 13 shows the power spectra taken at various streamwise locations. Far upstream  $(x \sim 0)$, no dominant frequencies appear. As we approach mean separation
 $(\tilde {x}_s = 1.76)$, we observe an overall amplification of low frequencies and, in particular, the emergence of a peak centred at
 $St \sim 0.08$ which continues to grow up to mean reattachment
 $(\tilde {x}_r = 3.80)$. This amplification of low-amplitude, low-frequency spectral content suggests that low-frequency upstream disturbances, however small, exist ahead of separation and are selectively amplified by the deceleration imposed by the APG and later by the separation bubble itself (Cherubini et al. Reference Cherubini, Robinet and De Palma2010). The amplification is significant in the case of LSBs, with Rist & Maucher (Reference Rist and Maucher2002) suggesting that upstream disturbances even of order
 $10^{-4}$ can be considered high. In figure 13, the low frequency centred at
 $St \sim 0.08$ persists long past mean reattachment, including some of its harmonics. The persistence of the low frequency downstream of reattachment suggests that it is associated with the advection of spatiotemporally coherent structures downstream. Normalizing the dominant low-frequency unsteadiness with the mean length of the separation bubble yields
 $St_{b} = 0.163$ which falls within the range 0.08–0.2 of flapping frequencies previously reported by Hudy et al. (Reference Hudy, Naguib and Humphreys2003) in geometry-induced separation bubbles. Michelis, Yarusevych & Kotsonis (Reference Michelis, Yarusevych and Kotsonis2017) and Jaroslawski et al. (Reference Jaroslawski, Forte, Vermeersch, Moschetta and Gowree2023) used the displacement thickness
 $\delta ^*$ at the separation point to normalize frequencies, and both studies found that the low-frequency Strouhal number is below
 $St_{\delta ^*}=0.005$, although without clearly identifying an emerging spectral peak, but this is consistent with our low frequency of
 $St_{\delta ^*}=0.002$. Within the LSB, from
 $x \sim 2.60$, a higher frequency peak centred at
 $St \sim 1.52$ begins to emerge and amplify which corresponds to the vortex shedding. Normalized with the momentum thickness and the local free stream velocity at separation, the Strouhal number for vortex-shedding is
 $St_\theta = 0.0067$, which is slightly lower than the references presented by Rodríguez et al. (Reference Rodríguez, Gennaro and Souza2021) (see their table 1), but is very close to the value of 0.0068 reported by Pauley et al. (Reference Pauley, Moin and Reynolds1990) and of 0.0062 obtained by Jaroslawski et al. (Reference Jaroslawski, Forte, Vermeersch, Moschetta and Gowree2023). However, care must be taken concerning such comparisons. In the case of Jaroslawski et al. (Reference Jaroslawski, Forte, Vermeersch, Moschetta and Gowree2023), separation is studied on an aerofoil, where reference quantities used for scaling might not have a clear definition. More importantly, Pauley et al. (Reference Pauley, Moin and Reynolds1990) conducted a 2-D simulation, while in the 3-D case performed by the same first author (Pauley Reference Pauley1994), the Strouhal number is approximately twice that of the 2-D case. In the present study, imposing non-natural periodic conditions in the spanwise direction should better match the 2-D case (cf. Alizard, Cherubini & Robinet (Reference Alizard, Cherubini and Robinet2009), who obtained the same Strouhal numbers by investigating the linear convective instability mechanism), as in experiments, these conditions cannot be imposed. With
 $x = 2.60$ corresponding to the earliest location of inflection in the streamwise velocity profile, by the criterion of Avanci et al. (Reference Avanci, Rodríguez and Alves2019), the high-frequency shedding may be triggered by an absolute instability of the bubble. From mean reattachment
 $(\tilde {x}_r = 3.80)$ onwards, this high-frequency peak decays rapidly unlike the low-frequency peak. As observed in the instantaneous flow fields in figures 6 and 8, the spanwise rollers rapidly breakdown even prior to reattachment.
Power spectral density of wall-pressure fluctuations.

In figure 14(a), we isolate the amplification of the low  $(St \sim 0.08)$ and high
 $(St \sim 1.52)$ frequencies observed in the power spectra of the spanwise-averaged wall pressure with streamwise location. The low frequency shows exponential growth ahead of separation likely due to the effects of the APG from the imposed suction extending upstream. At separation, the amplification of the low frequency slows as the higher frequency begins to grow exponentially. The high frequency peaks at
 $x \sim 3.2$, at the maximum bubble height, and subsequently decays coinciding with the undulation and breakdown of the shed vortices in figure 6. The low frequency exhibits a second stage of rapid growth coinciding with the initial location of velocity profile inflection caused by the presence of the secondary bubble
 $(x \sim 2.6)$. This is followed by a third stage coinciding with the peak of the high-frequency amplification. The third stage of growth of the low frequency occurs regardless of the breakdown of the shed vortices. The low frequency attains its peak at
 $x \sim 3.5$, after which it weakly decays until remaining rather constant and yet significantly more dominant than the shedding frequency.
(a) Power spectral density of the two selected dominant frequencies of pressure at the wall. (b) Maximum root-mean-square of velocity fluctuations within the boundary layer.

The amplification patterns of the high- and low-frequency signatures respectively resemble those of the spectral disturbance kinetic energies of the 2-D Kelvin–Helmholtz modes (fundamental frequency) and the 3-D Klebanoff modes (low frequency) observed by Hosseinverdi & Fasel (Reference Hosseinverdi and Fasel2019). They show that the higher the level of free stream turbulence, the earlier and more significant the amplification of the low-frequency Klebanoff streaks. While we cannot eliminate upstream disturbances caused by numerical propagation in our study, we maintain that the velocity fluctuations upstream are initially fairly weak  $O(10^{-5})$; cf. figure 14(b). However, prior to separation, all fluctuations have exhibited significant amplification, as suggested by Rist & Maucher (Reference Rist and Maucher2002) and Cherubini et al. (Reference Cherubini, Robinet and De Palma2010). By comparing figure 14(a) with the results in figure 18 of Hosseinverdi & Fasel (Reference Hosseinverdi and Fasel2019), we observe that the low frequency attains its peak amplification later than the high frequency in the present LSB, whereas the reverse is true in the study by Hosseinverdi & Fasel (Reference Hosseinverdi and Fasel2019). Given that we do not explicitly introduce such disturbances in our study, the delay in the low-frequency peak indicates that other factors (e.g. the secondary bubble) can still result in a dominant low-frequency unsteadiness in the case of low free stream turbulence. Furthermore, we infer from figures 6, 8 and 9 that the disturbances generated within the LSB itself may be a sufficient trigger to low-frequency unsteadiness in the absence of free stream turbulence altogether. In view of the results of Spalart & Strelets (Reference Spalart and Strelets2000), the velocity fluctuations in the inlet region are one order of magnitude higher than those observed in figure 14(b). This discrepancy can be attributed to differences in the initial conditions, as their study used 3-D random perturbations, whereas our present study does not include any perturbations. Moreover, they found that velocity fluctuations (
 $u'$ and
 $w'$) within the boundary layer exist and grow upstream of separation until attaining maxima near reattachment, after which the largest fluctuations roughly stabilize or weakly decay. We show this behaviour in figure 14(b) for all three velocity fluctuations. The three velocity fluctuations follow a similar amplification behaviour as the low frequency up to their peak at
 $x \sim 3.5$, with the growth of
 $u'$ being the most significant. This suggests that the low frequency is correlated with a significant source of
 $u'$ in the flow. The growth of
 $w'$ is very steep at separation, whereas that of
 $u'$ is slowed and
 $v'$ slowed to a lesser extent. While this indeed demonstrates that the 3-D characteristics are amplified soon after separation, it is also suggestive of a realignment of spanwise vorticity into streamwise or wall-normal vorticity, both of which can produce regions of low and high streamwise momentum.
In TSBs, the low frequency is attributed to a so-called breathing motion, where the bubble grows and shrinks in size. In LSBs, flapping refers to the wavering of the shear layer and therefore to excursions of the reattachment surface upstream and downstream. In a sense, flapping of an LSB has the low-frequency signature of a ‘half-breathing’ of a TSB. To analyse the unsteadiness in the shape and size of the LSB, we therefore follow Pearson, Goulart & Ganapathisubramani (Reference Pearson, Goulart and Ganapathisubramani2013) and Mohammed-Taifour & Weiss (Reference Mohammed-Taifour and Weiss2016), and compute conditional averages based on the reverse flow area. As a measure of reverse flow area, we simply compute the fraction of nodes possessing a negative streamwise velocity. Figure 15(a) shows the temporal evolution of the fraction of reverse flow computed within the midspan plane (blue) and over the whole 3-D domain (black). The mean fraction of reverse flow is approximately  $0.06$ for both the 2-D and 3-D computations. The temporal oscillations of the fraction of reverse flow reveal a quasi-periodic expansion (larger fraction) and contraction (smaller fraction) of the bubble. We show the power spectrum of the fraction of reverse flow in figure 15(b). We observe a dominant low-frequency peak at
 $St = 0.06$. This frequency is close to that reported earlier in figure 13
 $(St = 0.08)$, the difference largely arising from the pollution of the fraction of reverse flow signal by considering the whole domain, whereas the pressure is averaged only at the wall.
(a) Fraction of reverse flow area (fRFA) over the whole 3-D domain (solid black line) and within the midspan plane (dashed blue line). (b) Power spectral density of the fraction of reverse flow area computed from the 3-D domain.

To capture the flapping motion of the LSB and therefore its expansion and contraction, we now perform conditional averages based on the fraction of reverse flow. Figure 16 shows the dividing streamlines of the LSB in its minimum, mean and maximum states within the midspan plane using conditional averages. The minimum and maximum bubble sizes are based on those instants with a fraction of reverse flow lying respectively below and above  $1.5$ standard deviations from the mean, which essentially captures the minima and maxima at the low frequency. While there is a noticeable streamwise excursion of the reattaching surface of length
 $\Delta x_r = 0.4$, there is only a slight variation at separation (of the order of
 $2\Delta x$), as confirmed by the fluctuating skin friction coefficient
 $\tilde {C}'_f$ in figure 4(b). The expansion and contraction of the bubble in the wall-normal direction is also clearly observed, corresponding to the so-called ‘flapping’ or ‘wavering’ motion of the shear layer.
Conditionally averaged dividing streamlines using the fraction of reverse flow area. The minimum (dash-dotted green line), mean (solid white line) and maximum (dashed black line) states are shown. Contours represent the time- and spanwise-averaged streamwise velocity for reference.

3.4. Modal decomposition
Up to this point, we have shown that the present LSB may be subject to an absolute instability, as proposed by Avanci et al. (Reference Avanci, Rodríguez and Alves2019), arising from the formation of a secondary bubble within the larger primary LSB. This instability is supported by the presence of an inflection of the streamwise velocity falling below the dividing streamline of the primary LSB within the range  $2.60 < \tilde {x} < 3.14$ as well as the onset of spanwise roller formation near
 $x = 2.60$, namely the start of the inflection curve. Accompanying the supposed instability is the propagation of near-wall disturbances upstream. Indeed, we do also observe spots of near-wall vortical structures forming from
 $x \geqslant 2.40$ in the instantaneous flow field. The consequence of these structures is to retard the flow in the streamwise direction, causing a rapid spanwise undulation in the rollers of wavelength
 ${\sim }6$ times that of the diameter of the rollers, or approximately twice the streamwise wavelength of the rollers. Despite spanwise roller breakdown beginning at maximum bubble height
 $(\tilde {x} \sim 3.19)$, the peaks and valleys observed further downstream in the instantaneous flow fields appear to preserve this spanwise wavelength (up to at least
 $x \sim 8$).
We observe a particular low-frequency signature with  $St \sim 0.08$. By comparison with the fraction of reverse flow, we are able to show that expansion (more reverse flow) and contraction (less reverse flow) occur for the LSB at a similar frequency, similar to the breathing motion observed in the context of TSBs. In the case of an LSB, this motion occurs largely on the reattachment side where wavering of the shear layer causes the reattachment surface to migrate upstream and downstream. Furthermore, the low frequency was observed to exhibit three stages in its amplification: (1) early amplification by the APG; (2) slowed growth coinciding with the excitation of spanwise rollers; (3) renewed amplification coinciding with the formation and rapid breakdown of the spanwise rollers. The low frequency subsequently decays to a plateau further downstream. The growth of all three velocity fluctuations within the boundary layer follows a similar tendency, the peak instead occurring at the location of roller breakdown. The low frequency is therefore strongly linked to the amplification of velocity fluctuations and their persistence downstream.
The third stage of amplification of the low frequency coincides with the formation of the near-wall structures  $(\tilde {x} = 2.60)$ observed in figures 6 and 8. Given that the velocity fluctuations within the boundary layer are only amplified up to spanwise roller breakdown, this suggests that they too are associated with the dynamics caused by the near-wall structures, namely the local deceleration of the flow, the undulation of the spanwise rollers and the persistence of this wavelength downstream in the form of large streamwise packets of vortical structures which cause the peaks and valleys observed in the instantaneous flow field. As a consequence, it appears that the low-frequency behaviour is linked to the effects and propagation of flow that is deficient in streamwise momentum (more negative
 $u'$) and flow that is not (more positive
 $u'$), bearing some resemblance to the low- and high-speed streaks in TBLs. Proper elucidation of these structures and whether they truly are tied to the low-frequency unsteadiness requires an extraction and analysis of the coherent structures of the flow. In what follows, we use modal decomposition methods to elucidate these structures and analy-e their behaviour in the context of the low frequency unsteadiness.
3.4.1. Proper orthogonal decomposition
Proper orthogonal decomposition (POD) is a commonly used technique to decompose a turbulent flow into spatially coherent modes ranked by their turbulent kinetic energy. In this section, we apply space-only POD using the method of snapshots (Sirovich Reference Sirovich1987) rather than spectral POD which is concerned with spatiotemporal coherence (Towne, Schmidt & Colonius Reference Towne, Schmidt and Colonius2018).
Briefly, we define the snapshot matrix  $\boldsymbol {X}$ as the collection of all snapshots (i.e. discrete time instants
 $k$) of the fluctuating velocity field as follows:
 \begin{equation} \boldsymbol{X} = \begin{bmatrix} \mid & & \mid & & \mid\\ \boldsymbol{x}_1 & \cdots & \boldsymbol{x}_k & \cdots & \boldsymbol{x}_n\\ \mid & & \mid & & \mid \end{bmatrix} \quad\text{where}\ \boldsymbol{x}_k = \begin{bmatrix} \boldsymbol{u}'_k\\ \boldsymbol{v}'_k\\ \boldsymbol{w}'_k \end{bmatrix}. \end{equation}
In space-only POD, the flow is represented by a linear combination of spatially orthogonal modes, each with their own time dynamics, which can be expressed succinctly as
 \begin{equation} \boldsymbol{X} = \boldsymbol{\varPhi}\boldsymbol{A}, \end{equation}
where the columns  $\boldsymbol {\phi }_k$ of
 $\boldsymbol {\varPhi }$ denote the proper orthogonal modes and the rows
 $\boldsymbol {a}_k$ of
 $\boldsymbol {A}$ denote their respective time dynamics. The proper orthogonal modes and their time dynamics are computed from
 \begin{equation} \boldsymbol{\varPhi} = \boldsymbol{X}\tilde{\boldsymbol{\varPhi}}\boldsymbol{\varLambda}^{{-}1/2} \quad \text{and} \quad \boldsymbol{A} = \boldsymbol{\varPhi}^\mathrm{T}\boldsymbol{X}, \end{equation}
where  $\boldsymbol {\varLambda }$ and
 $\tilde {\boldsymbol {\varPhi }}$ represent the eigenvalues and eigenvectors, sorted in decreasing order of
 $\boldsymbol {\lambda }_k$, of the following eigenvalue problem:
 \begin{equation} \boldsymbol{C}\tilde{\boldsymbol{\varPhi}} = \tilde{\boldsymbol{\varPhi}}\boldsymbol{\varLambda} \end{equation}
with correlation matrix  $\boldsymbol {C} = \boldsymbol {X}^\mathrm {T}\boldsymbol {X}$.
We perform space-only POD using  $3000$ snapshots of the 3-D flow field extracted in increments of
 $\Delta t = 0.05$. The total time considered is therefore
 $150$, which we found to be sufficient; no significant differences were observed using as few as
 $1000$ snapshots. The spatial domain spans the entire spanwise width
 $z \in [0,0.6]$ and is limited to
 $x \in [1.5,4.7]$ in the streamwise direction and
 $y \in [0,0.5]$ in the wall-normal direction, encompassing key features of the separated and reattached flow. Given the large volume of data, we compute the POD in a streaming fashion, where the symmetric correlation matrix
 $\boldsymbol {C}$ is constructed one snapshot at a time, after which the eigenvalue problem (3.4) is computationally manageable and any POD mode
 $\boldsymbol {\phi }_m$, as given by the columns of
 $\boldsymbol {\varPhi }$ in (3.3a,b), can then be computed through a running sum one snapshot at a time,
 \begin{equation} \boldsymbol{\phi}_m = \frac{1}{\sqrt{\lambda_m}}\boldsymbol{X}\tilde{\boldsymbol{\phi}}_m = \frac{1}{\sqrt{\lambda_m}}\sum_{k=1}^{n}\boldsymbol{x}_k\tilde{\boldsymbol{\phi}}_{km}, \end{equation}
where  $\boldsymbol {x}_k$ is the
 $k$th snapshot vector as in (3.1),
 $\tilde {\boldsymbol {\phi }}_m$ represents the
 $m$th column vector of
 $\tilde {\boldsymbol {\varPhi }}$ and
 $\tilde {\phi }_{km}$ represents the
 $k$th component (or row) of
 $\tilde {\boldsymbol {\phi }}_m$.
We present the distribution of turbulent kinetic energy among the first  $20$ proper orthogonal modes in figure 17. The first three proper orthogonal modes carry a larger portion of the turbulent kinetic energy (
 $2.85$ %,
 $1.86$ %,
 $1.60$ %). The distribution of turbulent kinetic energy then decays in a staircase-like fashion, which is a common indication of advective structures captured by the modes, in this case, the shedding and advection of the spanwise rollers. Proper orthogonal modes of advective coherent structures come in pairs carrying similar turbulent kinetic energy along with a spatiotemporal shift.
Turbulent kinetic energy distribution among the first  $20$ modes.

The time dynamics of (space-only) proper orthogonal modes generally consist of the full spectrum of available frequencies. However, specific frequencies are often still found to dominate the dynamics of certain modes. We present the power spectra of the time dynamics of the first five modes in figure 18. The first three modes (figure 18a) all display peaks at  $St = 0.06$, which is identical to the low frequency detected from the fraction of reverse flow. Unlike the first and second modes, the third mode reveals additional peaks at
 $St = 0.03$,
 $0.11$ and
 $0.14$. The first is a subharmonic of the principal low frequency and the latter two frequency peaks agree with those additional peaks observed in the fraction of reverse flow (figure 15b). The fourth and fifth modes display a dominant frequency peak at
 $St = 1.57$, corresponding to the shedding frequency of the spanwise rollers identified earlier. Several additional frequency peaks are present in the time dynamics of modes
 $4$ and
 $5$, though these are likely associated with the breakdown of the spanwise rollers as we will demonstrate shortly. We observe in figure 18 that by simply decoupling spatial modes based on their turbulent kinetic energy content, space-only POD has also successfully decoupled the low-frequency unsteadiness from the high-frequency vortex shedding. No high-frequency peak is observed in modes
 $1$–
 $3$ and only relatively weak low-frequency peaks are observed in modes
 $4$ and
 $5$.
Power spectral density of the time dynamics of (a) the first, second and third proper orthogonal modes and (b) the fourth and fifth modes.

In the case of TSBs forming over flat plates (Mohammed-Taifour & Weiss Reference Mohammed-Taifour and Weiss2016), full steps (Fang & Tachie Reference Fang and Tachie2019) and Ahmed bodies (Thacker et al. Reference Thacker, Aubrun, Leroy and Devinant2013), a strong correlation is observed between the time dynamics of the first POD mode ( $\boldsymbol {a}_1$) and a measure of separation bubble size. The correlation suggests that the coherent structures associated with the first proper orthogonal mode are responsible or strongly linked to the low-frequency breathing of TSBs. The application of POD in these studies is however limited to a 2-D cross-section. We therefore also explore the correlation between the time dynamics of the first mode
 $(\boldsymbol {a}_1)$ and the fraction of reverse flow (a measure of bubble size) in figure 19. Figure 19(a) shows their variation in time and already suggests a visibly clear correlation between the two signals. We demonstrate this correlation further by computing the cross-correlation of the two signals in figure 19(b), where we observe a peak correlation of
 $0.85$ at zero lag. In contrast to TSB studies, we also observe modest cross-correlations of the time dynamics of the second and third modes with the fraction of reverse flow. However, the correlation of modes
 $2$ and
 $3$ with the fraction of reverse flow demonstrate that they also fluctuate on a subharmonic frequency
 $(St \sim 0.015)$, coming in and out of phase in a cyclic fashion. The remaining modes correlate rather poorly and, increasingly, the low frequency becomes less relevant to the lower energy, higher frequency modes. The coherent structures captured by the first three proper orthogonal modes therefore play an important role in the low-frequency unsteadiness of the LSB.
(a) Fraction of reverse flow (solid black line) and time dynamics of the first POD mode  $\boldsymbol {a}_1$ (dashed blue line). The fraction of reverse flow from a reduced-order model consisting of the leading three proper orthogonal modes is also shown (dash-dotted red line). (b) Correlation between the fraction of reverse flow and either the time dynamics of the first POD mode (solid black line) or the leading three-mode reduced-order model (dashed blue line).

To further demonstrate the importance of the coherent structures observed in the first three modes to the low-frequency unsteadiness of the LSB, we construct a reduced-order model of the flow using these very three modes (i.e.  $\boldsymbol {\varPhi }_r = \boldsymbol {U} + \boldsymbol {a}_1\boldsymbol {\phi }_1 + \boldsymbol {a}_2\boldsymbol {\phi }_2 + \boldsymbol {a}_3\boldsymbol {\phi }_3$). Figure 19(a) also compares the reverse flow area of the leading three-mode model with its corresponding correlation in figure 19(b). Figure 20 shows the minimum, mean and maximum bubble sizes of the reduced-order model computed in the same way as described for figure 16.
Conditionally averaged dividing streamlines using the fraction of reverse flow area of the leading three-mode reconstruction. Minimum (dash-dotted green line), mean (solid white lines) and maximum (dashed black line) states are shown. Contours represent the time- and spanwise-averaged streamwise velocity for reference.

Few studies explore the characteristics of the full 3-D low-frequency structures observed in the proper orthogonal modes of separation bubbles. In figure 21, we therefore depict the spatial structures of the first five proper orthogonal modes using two sets of isosurfaces of the  $u$ component of the modes (
 $+0.0003$ in red,
 $-0.0003$ in blue). The first mode in panel
 $(a)$ possesses streak-like structures with a spanwise wavelength of
 $\lambda _z \sim L_z/2$ linked to the shear layer, as also observed by Statnikov et al. (Reference Statnikov, Bolgar, Scharnowski, Meinke, Kähler and Schröder2016) in the case of low-frequency unsteadiness behind a BFS. In view of figure 19, the mode is indeed modulated in amplitude at the low frequency of the LSB. However, an overall tendency to shift from negative to positive amplitude in time is observed as though a much lower frequency of the order of
 $10^{-3}$ may emerge. In the regions where a negative isosurface is present in figure 21(a), a decrease in amplitude of the coefficient
 $\boldsymbol {a}_1$ corresponds to local retraction of the bubble, while an increase corresponds to expansion. The second (panel
 $b$) and third (panel
 $c$) modes, however, show clear streamwise streaks alternating in sign in the spanwise direction, also with a spanwise wavelength of
 $\lambda _z \sim L_z/2$. Interestingly, as we show in panel
 $(d)$, the positive isosurfaces of modes
 $2$ and
 $3$ fit into the pockets of mode
 $1$, while the negative isosurfaces coincide or extend the negative isosurfaces of mode
 $1$. The three modes are intimately related. The linear combination of the three modes will result in periods of uniform expansion/contraction of the LSB when the coefficient of the first mode is out-of-phase with modes
 $2$ and
 $3$. This expansion/contraction occurs primarily in the streamwise direction and less so in the wall-normal direction. When the three modes are in-phase, a strong spanwise undulation is induced. The streaks in figures 21(a)–21(c) appear prior to the location of maximum bubble height
 $(x \sim 3)$ and persist past reattachment up to the end of the domain used for the POD
 $(x \sim 4.7)$. The fourth (panel
 $d$) and fifth (panel
 $e$) modes describe a pair of convective modes and capture the coherent spanwise rollers with little to no spanwise undulation. Downstream, these modes show larger structures and alternating streamwise velocity fluctuations, accompanying the general process of undulation and breakdown of the rollers. Several subsequent modes capture convective motions associated with the breakdown of the spanwise rollers which results in structures or packets of varying streamwise length scales (such a packet is observed in figure 8 for example).
Streamwise component of the leading five POD modes. Isosurfaces of  $|u'|=0.0003$ are shown, positive values in red and negative values in blue. (a) First, (b) second and (c) third modes, (d) superposition of the first three modes, (e) fourth and ( f) fifth modes.

Figure 22 shows the  $v$ component of the second mode within six different cross-stream planes, namely,
 $x = 2.2$–
 $4.2$ in increments of
 $0.4$. We begin to observe the development of these streamwise streaks as far upstream as
 $x = 2.2$, which demonstrates that the streaks do indeed begin to form prior to the formation of the spanwise rollers and prior to the mean location of the secondary bubble. By
 $x = 2.6$, an alternating pattern of streaks has already formed near the wall with spanwise wavelength
 $\lambda _z \sim L_z/20$. As we observe for the amplification of the velocity fluctuations in figure 14(b), the amplification of the streaks within the LSB occurs rapidly up to
 $x = 3.5$, growing in spanwise wavelength up to approximately
 $L_z/2$. When normalized with the momentum thickness at separation
 $\theta$, we obtain
 $\lambda _z \simeq 64\theta$, falling in the range provided by Rodríguez et al. (Reference Rodríguez, Gennaro and Souza2021), who compare measurements of the spanwise wavelength of coherent structures developing in LSBs studied in the literature (it was also found that the results of a simulation with twice the domain size in the spanwise direction did not change this wavelength). By reattachment
 $(x = 3.8)$, the streaks have reached their maximum size. The streaks then persist downstream and slowly decay, as we demonstrate by the smaller structures at
 $x = 4.2$ compared with those at
 $x = 3.8$. We note that regions of positive
 $v$ component coincide with regions of negative
 $u$ component and vice versa (e.g. at
 $x = 3.8$). The streaks therefore exhibit the features of the ejection
 $(-u',+v')$ and sweep
 $(+u',-v')$ motions described earlier; e.g. compare with figure 21(b). The first and third modes show similar behaviour and are therefore not shown, the main difference being that the overall sizes of the structures decrease from the first mode down to the third. Notably, similar large-scale
 $u'$ motions in transverse planes have been shown in the APG and separated regions by Abe (Reference Abe2019). Their study confirmed that these structures are associated with periodic sweep and ejection events caused by the flapping motions of the separation bubble.
Transverse ( $yz$) planes of the
 $v$ component of the second POD mode at (
 $a$)
 $x = 2.2$, (
 $b$)
 $x = 2.6$, (
 $c$)
 $x = 3.0$, (
 $d$)
 $x = 3.4$, (
 $e$)
 $x = 3.8$ and (
 $\,f$)
 $x = 4.2$.

The formation of streaks in TBLs are generally accompanied by counter-rotating near-wall streamwise vortices (Cossu & Hwang Reference Cossu and Hwang2017). To illustrate this vortical motion, we show the  $w$ component of the leading three modes in figure 23. We observe spanwise-alternating patterns of streamwise-elongated
 $w'$ for all three modes. By comparing the positions of the
 $w'$ patterns for the second mode in figure 23(b) with those of the
 $v'$ patterns in figure 22, we observe that the streaks (regions of
 $\pm v'$) are positioned precisely between the alternating streamwise-elongated patterns of
 $w'$. Regions of positive
 $v'$ therefore lie between two counter-rotating streamwise vortices creating a lift-up effect, while regions of negative
 $v'$ lie between two counter-rotating streamwise vortices creating a pull-down. The leading three POD modes therefore describe all the characteristics of the lift-up effect in transitional and turbulent shear flows (Brandt Reference Brandt2014).
Spanwise component of the first, second and third modes at the bottom wall. Mean separation and reattachment lines are respectively denoted by dotted and dashed lines.

The streamwise wall-normal ( $xy$) plane is often the plane of choice in separation bubble studies for depicting the POD modes. We can now link the modes observed in the streamwise wall-normal plane with their corresponding 3-D modes in the present LSB (cf. figure 21). In figure 24, we show the
 $u$ component of modes
 $1$–
 $3$ within the mid-span planes. The first mode shows a large portion of
 $u'$ in the aft portion of the bubble extending on both sides of the mean dividing streamline. The second and third modes show what appear to be large alternating structures advected in the streamwise direction. Similar structures have been observed as the leading modes in several TSB studies (Mohammed-Taifour & Weiss Reference Mohammed-Taifour and Weiss2016; Elyasi & Ghaemi Reference Elyasi and Ghaemi2019; Le Floc'h et al. Reference Le Floc'h, Weiss, Mohammed-Taifour and Dufresne2020) and APG TBLs (Sanmiguel Vila et al. Reference Sanmiguel Vila, Örlü, Vinuesa, Schlatter, Ianiro and Discetti2017). In particular, for TSBs, the structure in the first mode extends even upstream of separation, causing both the separation and reattachment points to move. Given that for the present LSB, these structures correspond to large-scale streamwise streak-like motions, the same structures may represent the leading POD modes of TSBs. To support this view, we refer to Wu et al. (Reference Wu, Meneveau and Mittal2020) who show streak-like modes associated with low-frequency unsteadiness for their TSB using dynamic mode decomposition (DMD). The separation point in their TSB remains rather stationary (like the present LSB) and does not exhibit the large excursions typically observed in TSB breathing (Na & Moin Reference Na and Moin1998; Mohammed-Taifour & Weiss Reference Mohammed-Taifour and Weiss2016; Le Floc'h et al. Reference Le Floc'h, Weiss, Mohammed-Taifour and Dufresne2020). The modal structure of their low-frequency mode (cf. figures
 $22$ and
 $23$ in their work) bears a striking resemblance to that of POD modes
 $2$ and
 $3$ in figures 21–24 in this work. Subsequent modes describe the vortex shedding and breakdown rather clearly in the
 $xy$ plane. In figure 25, we show modes
 $4$ and
 $5$, together representing the advection of spanwise rollers and their growth downstream as they breakdown. Due to the spatiotemporal complexity of the breakdown process, many more modes are required to capture the dynamics; for example, we observe similar patterns for modes
 $4$–
 $12$ (cf. figure 25 for mode
 $8$).
Streamwise component of the first, second and third modes in the mid-span plane. The solid black lines represent the dividing streamline of the time- and spanwise-averaged flow for reference.

Streamwise component of the fourth, fifth and eighth modes in the mid-span plane. The solid black lines represent the dividing streamline of the time- and spanwise-averaged flow for reference.

3.4.2. Dynamic mode decomposition
Since POD does not generally distinguish modes based on their frequency, it is of value to compare with another method such as dynamic mode decomposition (Schmid Reference Schmid2010; Tu et al. Reference Tu, Rowley, Luchtenburg, Brunton and Kutz2014). DMD can decompose a turbulent flow into spatially coherent modes each with a unique frequency. In this section, we will compare the spatial structures of low- and high-frequency dynamic modes with those obtained from POD to further validate the frequency-structure associations of the proper orthogonal modes.
We use the exact DMD method of Tu et al. (Reference Tu, Rowley, Luchtenburg, Brunton and Kutz2014) for the same snapshots and spatial domain as for the POD. Given a snapshot matrix  $\boldsymbol {X}$, containing snapshots
 $1$ to
 $n-1$, and
 $\boldsymbol {Y}$, containing snapshots
 $2$ to
 $n$, the exact DMD modes are obtained from
 \begin{equation} \boldsymbol{\varPsi} = \boldsymbol{Y}\boldsymbol{V}\boldsymbol{\varSigma}^{{-}1}\boldsymbol{W}\boldsymbol{\varLambda}^{{-}1} \end{equation}
after computing the singular value decomposition  $\boldsymbol {X} = \boldsymbol {U}\boldsymbol {\varSigma }\boldsymbol {V}^*$ and the solution to the eigenvalue problem
 $\tilde {\boldsymbol {A}}\boldsymbol {W} = \boldsymbol {W}\boldsymbol {\varLambda }$, where
 $\tilde {\boldsymbol {A}} = \boldsymbol {U}^*\boldsymbol {Y}\boldsymbol {V}\boldsymbol {\varSigma }^{-1}$. In particular, given the large volume of data, the direct streaming approach of Hemati, Williams & Rowley (Reference Hemati, Williams and Rowley2014) was used (i.e. without POD compression).
The discrete-time eigenvalues ( $\lambda _k$) are plotted in the complex plane in figure 26(a); the eigenvalues are symmetric about the real axis. All the eigenvalues are located on the unit circle which implies that the time dynamics of the modes exhibit no growth or decay, they exhibit stable oscillations at unique frequencies. The frequency spectrum of the dynamic modes is shown in figure 26(b). The amplitudes in the spectrum are computed from
 $\boldsymbol {b} =\boldsymbol {\varLambda }^{-1}\boldsymbol {\varPsi }^+\boldsymbol {x}_2$, where the superscript
 $^+$ denotes the pseudo-inverse. The spectrum shows a significant low-frequency peak at
 $St = 0.073$ (dotted vertical line), similar to our reverse flow area and POD analyses. Additional low-frequency peaks appear in close proximity, indicating that the low-frequency unsteadiness spans a range of low frequencies and cannot be precisely associated to any single unique frequency. The higher frequency is less apparent since turbulence also produces frequencies in this range. Nonetheless, we do observe a bump in the range corresponding to the vortex shedding and we will consider a frequency of
 $St = 1.51$ (dashed vertical line) in what follows.
(a) Eigenvalues of DMD modes and (b) spectrum of DMD modes. The vertical dotted blue and dashed red lines represent the dominant frequencies of  $St_l = 0.073$ and
 $St_h = 1.51$.

Figure 27 shows the  $u$ component of the spatial structures (real part) of a low- (
 $St = 0.073$) and high- (
 $St = 1.51$) frequency mode. The low-frequency mode (figure 27a), as we observe for the POD, shows streak-like motions. The side and top views of the low frequency, presented in figure 28(a), indicate that streaky structures emerge as early as
 $x \sim 2.6$ and further develop downstream. Other low-frequency peaks show similar structures and are therefore not shown. The high-frequency mode (figure 27b) depicts the vortex shedding and other modes in this frequency range show similar structures. The side view of these structures, as shown in figure 28(b), demonstrates a high degree of coherence along the spanwise direction. Moreover, the top view clearly displays the undulations of spanwise rollers. The comparison between the structures associated with the low-frequency mode and high-frequency modes reveals that the appearance of streaky structures occurs upstream of the location where spanwise rollers emerge.
Isosurfaces of the real part of the dynamic modes corresponding to (a) the low frequency and (b) the high frequency.

Isosurfaces of the real part of the dynamic modes in the  $xy$ and
 $xz$ planes corresponding to (a) the low frequency and (b) the high frequency.

4. Further discussion and conclusions
We have investigated the low-frequency unsteadiness of a pressure-induced incompressible LSB formed over a flat plate using DNS. The LSB is the same as that of Spalart & Strelets (Reference Spalart and Strelets2000), selected due to the reported presence of wall-normal excursions (wavering) of the shear layer, a common feature associated with the low-frequency unsteadiness of LSBs.
Through spectral analysis of the spanwise-averaged wall pressure, we observe two dominant frequency regimes in the studied flow configuration. The high-frequency regime  $(St \sim 1.52)$ corresponds to the shedding of spanwise rollers while the low-frequency regime
 $(St \sim 0.08)$ corresponds to the unsteadiness commonly referred to as flapping. The physical relationship between the high frequency and the shed spanwise rollers is easily observed from instantaneous streamwise and wall-normal velocity spectra taken at points falling within the passage of the shed spanwise rollers. The physical manifestation of the low frequency is less evident, but can be observed from the fraction of reverse flow in the 3-D domain. The spectrum of the fraction of reverse flow exhibits a clear coherent low-frequency oscillation, where a lower fraction suggests a smaller recirculation region and a higher fraction a larger recirculation region. Conditional averages of the flow field based on high and low fractions of reverse flow clearly reveal that the physical manifestation of the low frequency corresponds to the expansion/contraction of the LSB, largely in the aft portion, as well as a wavering of the shear layer (i.e. wall-normal excursions). Unlike the high frequency, the low frequency exhibits exponential growth beginning far upstream of separation. At separation, the exponential growth of the low frequency is considerably reduced up to the location of presumed absolute instability where the inflection of the streamwise velocity profile within the LSB begins. This is followed by a third stage of rapid exponential growth peaking just prior to mean reattachment. The growth of the maximum velocity fluctuations follows a similar pattern as the low-frequency amplification, suggesting that the mechanism behind the unsteadiness is structural and advective in nature.
From the instantaneous flow fields, as reported by Spalart & Strelets (Reference Spalart and Strelets2000), we observe peaks and valleys in the 3-D vorticity fields. An instantaneous visualization of the streamwise velocity fluctuation reveals low- and high-speed streamwise streak-like motions extending from within the LSB to past reattachment. Using a quadrant analysis, we demonstrate that at instants of high fraction of reverse flow, a predominance of ejection ( $Q2$) events are present while at instants of low fraction of reverse flow, a predominance of sweep (
 $Q4$) events are present. In other words, the formation of streaky structures within the LSB and their advection downstream are strongly related to the low-frequency unsteadiness. Elongated streamwise streaks are well known to form in TBLs and they have been correlated with the modulation of the bubble size in TSBs (Pearson et al. Reference Pearson, Goulart and Ganapathisubramani2013; Fang & Tachie Reference Fang and Tachie2019). Using proper orthogonal and dynamic mode decomposition, we are able to show that a spanwise-alternating pattern of low- and high-speed streamwise elongated streaky structures appear as dominant (high energy) modes at the low frequency. Modal decomposition permits the observation of the growth of these streak-like motions within the LSB from separation to reattachment accompanied by streamwise vortices near the wall. In the case of POD, a flow reconstruction using the three leading proper orthogonal modes is required to adequately reproduce the 3-D dynamics of the low-frequency unsteadiness. This leaves us with two questions: (
 $1$) How can a spanwise-alternating pattern of low- and high-speed streamwise streak-like motions be physically responsible for expansion/contraction of the LSB? (
 $2$) How do the streaks form in the LSB in the first place?
In this work, we propose an answer to the first of the two questions. An array of spanwise-alternating streaks modulates the size of the bubble. The passage of an ensemble of streaks through the reattachment region reduces the overall bubble size. In the absence of streaks, the bubble is permitted to grow. The low frequency then corresponds to the time it takes for streaks to form, amplify and advect past the LSB from separation to reattachment. This mechanism emphasizes the importance of mean flow deformation as described by Marxen & Rist (Reference Marxen and Rist2010) and Jaroslawski et al. (Reference Jaroslawski, Forte, Vermeersch, Moschetta and Gowree2023), where ‘forcing’ is seen to reduce the mean bubble size. In other words, the advection of streaks (forcing) causes low-frequency bubble contractions such that the mean bubble size is reduced. In the context of the quadrant analysis, these streaks appear in the  $Q2$ and
 $Q4$ quadrants of the
 $(u',v')$ plane, just as ejections and sweeps do in TBLs. With the addition of the mean flow, events in the second quadrant of the
 $(u',v')$ plane are shifted to the first quadrant of the
 $(u,v)$ plane, while events in the fourth quadrant are pushed further into the fourth quadrant. The flow is biased towards positive streamwise velocity such that a spanwise array of alternating low- and high-speed streaks behaves globally as a perturbation in the form of an array of high-speed streaks. In brief, analysis of the low-frequency unsteadiness is better suited to analysis as a base flow (larger bubble) with perturbations, rather than as a mean flow (smaller bubble) with fluctuations.
The physical mechanism behind the generation of the streaks remains unanswered by this work. Nevertheless, the mechanism by which they produce the low-frequency unsteadiness of a separation bubble is the same. In the case of LSBs, streaks may be generated by four mechanisms: selective amplification of low-frequency free stream disturbances (Simoni et al. Reference Simoni, Ubaldi and Zunino2014), a Görtler-type instability due to the convex curvature of the separating material surface (Wu et al. Reference Wu, Meneveau and Mittal2020), elliptical instability (spanwise undulation) of the shed vortices (Marxen et al. Reference Marxen, Lang and Rist2013), or primary and secondary instability mechanisms of the separation bubble itself (Rodríguez et al. Reference Rodríguez, Gennaro and Souza2021). In the former case, streaks develop as a non-modal instability and they are subsequently amplified by the shear layer of the LSB, causing an earlier transition to turbulence (e.g. bypass or Klebanoff-type transition). In our study, we did not impose free stream turbulence, though by separation, the amplitude of the streamwise velocity fluctuations have nearly attained  $10^{-2}$, which is rather high for an LSB (Rist & Maucher Reference Rist and Maucher2002). We conjecture that an LSB can nonetheless exhibit low-frequency unsteadiness in the complete absence of free stream disturbances. In the present work, we have demonstrated that a secondary bubble exists (on average) within the primary LSB, suggesting the flow to be absolutely unstable by the geometric criterion of Avanci et al. (Reference Avanci, Rodríguez and Alves2019). In the presence of absolute instability, the self-excited unsteadiness within the bubble propagates upstream within the recirculation region itself. As demonstrated by Cherubini et al. (Reference Cherubini, Robinet and De Palma2010), disturbances occurring within the fore portion of an LSB can exhibit amplification to a similar extent as upstream disturbances.
In the case of sufficiently developed TBLs, the presence of large- and very large-scale motions in the form of high- and low-speed streaks is well known (Hack & Schmidt Reference Hack and Schmidt2021). It is therefore reasonable to assume that these streaks will result in the motion of both the separation and reattachment surfaces of TSBs in the same way they cause motion of the reattachment surface for LSBs. In other words, a large-scale low-speed motion will locally cause the separation surface to move upstream and the reattachment surface to move downstream (expansion), and vice versa for large-scale high-speed motions (contraction) (Le Floc'h Reference Le Floc'h2021; Le Floc'h, Di Labbio & Dufresne Reference Le Floc'h, Di Labbio and Dufresne2023). In this sense, the ‘flapping’ of LSBs corresponds to only half of the ‘breathing’ of TSBs since streaks either do not exist or are not sufficiently developed upstream of separation for LSBs, therefore having little to no effect on the motion of the separation surface. Likewise, TSBs that do not have sufficiently developed upstream boundary layers may not have sufficiently developed streaks, causing little to no motion of the separation surface and behaving for all intents and purposes like LSBs with excessive free stream turbulence. This may be the case in such studies as those by Abe (Reference Abe2017) and Wu et al. (Reference Wu, Meneveau and Mittal2020). Some indication of the relationship between large-scale motions and the low-frequency unsteadiness of TSBs has also been provided by Pearson et al. (Reference Pearson, Goulart and Ganapathisubramani2013) and Fang & Tachie (Reference Fang and Tachie2019). This could imply that the low frequency might be driven by the characteristic length and time scales of the upstream streaks, which is directly related to how well developed the upstream TBL is. The application of recycling/rescaling methods is an example where large streaks do not have enough length/time to fully develop. This could also explain why in some numerical simulations, the low frequency is not clearly observed. We note, however, that restriction of a modal decomposition analysis to the  $xy$ plane, as is commonly the case in such studies, is misleading. The leading POD mode gives the impression of a large low- or high-speed motion that is advected past the bubble and alternates in sign in the streamwise direction. Subsequent modes are simply thought to relate to shedding or to an intermediate frequency. These observations are made by Mohammed-Taifour & Weiss (Reference Mohammed-Taifour and Weiss2016), Fang & Tachie (Reference Fang and Tachie2019) and Richardson, Zhang & Cattafesta (Reference Richardson, Zhang and Cattafesta2023) for example. In our study, we observe the same signature in the mid-span plane; however, we demonstrate that in three dimensions, there is no such uniform structure, there are only low- and high-speed streamwise streaks alternating in the spanwise direction. Furthermore, the first three modes correspond to the low frequency and are required in the low-order model to capture the low-frequency dynamics.
Funding
F.M. gratefully acknowledges financial support from the Simulation-based Engineering Science program funded through the CREATE program of the Natural Sciences and Engineering Research Council of Canada (NSERC). G.D.L. would like to acknowledge support from the postdoctoral fellowships of the Fonds de recherche du Québec – Nature et technologies (FRQNT) and NSERC. This research was enabled in part by support provided by Calcul Québec (www.calculquebec.ca) and the Digital Research Alliance of Canada (alliancecan.ca). The simulations were performed on the Niagara supercomputer at the SciNet HPC Consortium. SciNet is funded by Innovation, Science and Economic Development Canada, the Digital Research Alliance of Canada, the Ontario Research Fund: Research Excellence, and the University of Toronto.
Declaration of interests
The authors report no conflict of interest.
Appendix A. Low-frequency unsteadiness in other flow configurations
A.1. Backward-facing steps
Eaton & Johnston (Reference Eaton and Johnston1982) are among the first to describe the low-frequency unsteadiness of separation bubbles in more detail. They study the flow forming behind a BFS experimentally with oncoming laminar and turbulent boundary layers having  ${{Re}}_\theta = 240$ and
 $950$, respectively, where
 ${{Re}}_\theta$ is the Reynolds number based on the inlet free stream velocity and the momentum thickness
 $\theta$ at separation. In both cases, the mean reattachment point is identified as that moving downstream
 $50$ % of the time (forward flow fraction,
 $\gamma = 0.5$). For the TBL, near reattachment, they observe bursts of turbulent activity at the wall propagating downstream. This is interpreted as the passage of large-scale motions with
 $10$–
 $20$ times the period of the largest observed eddies, namely, the spanwise vortices shed from the shear layer. The same low-frequency range is found to be associated with a significant portion of energy in streamwise velocity spectra near reattachment and can be observed in their moving short-time average estimate of the reattachment length. The nature of these large-scale motions was, however, not investigated further. Nevertheless, Eaton & Johnston (Reference Eaton and Johnston1982) discuss several possible mechanisms and ultimately propose that the low-frequency behaviour is due to momentary imbalances between mass carried away from the bubble by the shear layer and mass reinjected at reattachment.
Subsequent experimental works observe phenomena that are conjectured to explain this low-frequency unsteadiness. For example, Troutt, Scheelke & Norman (Reference Troutt, Scheelke and Norman1984) demonstrate the presence of larger-than-normal spanwise vortices arising from vortex pairing interactions in their turbulent BFS flow ( ${{Re}}_\theta = 920$). They attribute the low-frequency unsteadiness to the passage of these large-scale motions through the reattachment region. Likewise, Driver, Seegmiller & Marvin (Reference Driver, Seegmiller and Marvin1987) and Lee & Sung (Reference Lee and Sung2001) also associate the low-frequency unsteadiness to these vortices (
 ${{Re}}_\theta = 5000$ and
 $1300$, respectively), with Driver et al. speculating that they are responsible by occasionally carrying away excess mass and momentum. Spazzini et al. (Reference Spazzini, Iuso, Onorato, Zurlo and Di Cicca2001) observe yet another phenomenon linked to the low-frequency unsteadiness, namely that the secondary inner bubble, often called the Moffatt vortex, exhibits cycles of growth and bursting that coincide with the low-frequency unsteadiness of the larger primary bubble. Although this behaviour is not widely observed, it does suggest that if an advective mechanism is responsible, it must begin early in the fore portion of the bubble to result in expansion/contraction of the secondary bubble as well.
An advective mechanism behind the low-frequency unsteadiness ultimately requires the development and advection of large-scale coherent structures and an effect or instability by which the structures are created or amplified in the first place. Wee et al. (Reference Wee, Yi, Annaswamy and Ghoniem2004) conduct a linear stability analysis on 2-D BFS flows to further investigate the origin of the low-frequency motion. They observe that the frequency is largely dependent on the shear layer thickness and the growth rate on the magnitude of the reversed flow. They therefore hypothesize that the oscillations responsible for the low frequency arise in the middle of the recirculation region, where maximum reverse flow occurs. The turbulent BFS experiments of Ma & Schröder (Reference Ma and Schröder2017), having  ${{Re}}_\theta \sim 1300$, further demonstrate that the flapping motion does indeed begin at the streamwise location of maximum reverse flow, roughly located in the middle of the bubble. Furthermore, using POD in a streamwise-vertical plane, they show that flapping is associated with high turbulent kinetic energy due to large-scale sweep- and ejection-like motions that contribute significantly to the Reynolds shear stress in the aft portion of the bubble.
Ma, Tang & Jiang (Reference Ma, Tang and Jiang2022a,Reference Ma, Tang and Jiangb) later explore the 3-D structure of these modes experimentally, though at a lower momentum thickness Reynolds number ( ${{Re}}_\theta \sim 80$). They demonstrate the presence of coherent structures in the form of high- and low-speed streak-like motions alternating in span and occurring at the low frequency, similar to those observed in TBLs (Hack & Schmidt Reference Hack and Schmidt2021). The streak-like motions are suggested to develop as a result of spanwise undulations of the shear layer. High-momentum sweep-like motions are carried downwards into the separation bubble whereas low-momentum ejection-like motions are carried upwards into the shear layer. Likewise, Wilkins, Hosseinali & Hall (Reference Wilkins, Hosseinali and Hall2020) also demonstrate the presence of these streak-like motions at the low frequency in their large eddy simulation of a BFS (
 ${{Re}}_h = 5100$, based on the step height
 $h$). The near-wall recirculating flow is observed to generate wall-normal vorticity as it propagates towards the step and is forced to exhibit a spanwise motion. This generates large counter-rotating wall-normal vortical motions that are accompanied by a spanwise array of low- and high-speed streamwise momentum. This observation has the benefit of offering a physical explanation for the formation of the large-scale streamwise motions. The presence of spanwise-alternating regions of high and low streamwise momentum is also observed in transonic BFS flows, such as in the experimental and numerical study of Statnikov et al. (Reference Statnikov, Bolgar, Scharnowski, Meinke, Kähler and Schröder2016), where the Mach number is
 ${{Ma}} = 0.8$ and
 ${{Re}}_h = 180\,000$. They demonstrate the presence of streamwise streaky structures having a spanwise wavelength of two step heights. Using DMD on their numerical simulation, they show that these streaky structures appear as dominant modes associated with the same low frequencies observed in their pressure spectra. They however distinguish between two low-frequency modes, the first a ‘cross-pumping’ motion (excursion of the reattaching surface, alternating in span) and the second a ‘cross-flapping’ motion (pure wavering of the shear layer, alternating in span).
A.2. Forward-facing steps
The formation of large streak-like motions has also been observed in LSBs forming ahead of and over FFSs. Using 3-D particle tracking velocimetry, Stüer, Gyr & Kinzelbach (Reference Stüer, Gyr and Kinzelbach1999) demonstrate that hydrogen bubbles initially inside the separation bubble are released by spiralling out over the step in longitudinal vortices spread out quasi-periodically along the span by approximately three step heights. They hypothesize that the longitudinal vortices arise due to a Görtler-type instability as a consequence of the convex curvature of the dividing streamline. Wilhelm, Hrtel & Kleiser (Reference Wilhelm, Hrtel and Kleiser2003) confirm the presence of counter-rotating longitudinal vortices accompanied by streak-like motions in their DNS of an FFS flow. They demonstrate further that this three-dimensionality is a result of the high sensitivity of the flow to upstream disturbances. Through spatial and space–time correlations between pressure and velocity fluctuations, Largeau & Moriniere (Reference Largeau and Moriniere2007) and Camussi et al. (Reference Camussi, Felli, Pereira, Aloisio and Di Marco2008) deduce the passage of large-scale motions over the separation bubble at the low frequency.
Pearson et al. (Reference Pearson, Goulart and Ganapathisubramani2013) study a TSB forming ahead of an FFS experimentally. They observe that the passage of large-scale low-velocity motions past the separation bubble (over the step) results in an overall growth of the bubble. Conversely, periods of shrinkage of the bubble coincide with a global increase in velocity. They propose that these upstream large-scale motions are connected to the low-frequency unsteadiness. Fang & Tachie (Reference Fang and Tachie2019) further support this observation in their experimental work on TSBs forming over a forward-backward-facing step. Like Pearson et al. (Reference Pearson, Goulart and Ganapathisubramani2013), they identify a strong correlation between the oncoming low- and high-speed motions from the TBL and the low-frequency unsteadiness. Furthermore, they show that the low-frequency motion of the TSB forming behind the step possesses the same frequency with a phase delay from that forming above the step, suggesting the underlying mechanism as resulting purely from the advection of these large-scale motions. Fang & Tachie (Reference Fang and Tachie2020) later study an FFS submerged in a thick TBL experimentally. They observe again that the passage of low-velocity large-scale motions correlate with low-frequency growth of the separation bubble. The low frequency is observed to be lower than those reported by Pearson et al. (Reference Pearson, Goulart and Ganapathisubramani2013) and Graziani et al. (Reference Graziani, Kherhervé, Martinuzzi and Keirsbulck2018), whose oncoming TBLs are markedly thinner. In other words, the low-velocity large-scale motions are more developed in the TBL of Fang & Tachie (Reference Fang and Tachie2020), and their advection past the separation bubble thus occurs on a longer time scale.
A.3. Blunt plates
Like the BFS, for a rectangular blunt plate, the separation point is fixed by the geometry. Low-frequency excursions of the reattaching surface are also observed for separation bubbles forming over blunt plates. For example, like Eaton & Johnston (Reference Eaton and Johnston1982), Djilali & Gartshore (Reference Djilali and Gartshore1991) clearly observe the unsteadiness at reattachment from the near-wall forward flow fraction. Velocity spectra from within the shear layer also show significant energy contained in the low-frequency regime. Cherry, Hillier & Latour (Reference Cherry, Hillier and Latour1984) perform pressure and velocity measurements for a separation bubble forming over a blunt plate with high free stream turbulence. They observe that the low-frequency unsteadiness is most pronounced closer to separation in both pressure and velocity spectra, though it is also largely observable throughout the separation bubble. As for the BFS flows described in § A.1, they too observe the occasional shedding of larger-than-normal spanwise vortical motions and link the time scale of the low-frequency unsteadiness to their advection. They also demonstrate, however, the streamwise development of a spanwise phenomenon beginning close to separation. Through spanwise cross-correlations of streamwise velocity fluctuations, they observe a linear growth in spanwise length scale up to reattachment, the streamwise development being rather self-similar. Although not shown, they remark that smoke visualizations suggest a certain spanwise distortion (‘helical pairings’) of the shed vortices.
Kiya & Sasaki (Reference Kiya and Sasaki1983) study a TSB forming over a blunt plate experimentally and further corroborate many of the findings of Cherry et al. (Reference Cherry, Hillier and Latour1984). Through spanwise cross-correlations of wall pressure and spanwise velocity fluctuations, they demonstrate that counter-rotating streamwise vortical motions are present at reattachment with similar streamwise growth behaviour as the spanwise phenomenon observed by Cherry et al. (Reference Cherry, Hillier and Latour1984). Kiya & Sasaki (Reference Kiya and Sasaki1985) later propose that these streamwise vortical motions form hairpin-like structures in combination with the shed vortices. They link these structures with those previously observed in mixing layers and suspect the formation of a pattern of streamwise-elongated streaks. Furthermore, they remark that the shedding of larger-than-normal spanwise vortical motions is too rare an event to be responsible for the low frequency. This raises the question as to whether the same structures observed in the BFS flows of Troutt et al. (Reference Troutt, Scheelke and Norman1984), Driver et al. (Reference Driver, Seegmiller and Marvin1987) and Lee & Sung (Reference Lee and Sung2001) discussed in § A.1 are truly responsible for the low frequency as well. Instead, they propose that the low frequency is related to the feedback of disturbances from reattachment propagating upstream to separation. Dovgal, Kozlov & Michalke (Reference Dovgal, Kozlov and Michalke1994) suggests a similar mechanism for LSBs in general, where the mean flow is distorted by the amplification of such disturbances at separation.
Tafti and Vanka instead investigate LSBs forming over a blunt plate through numerical simulations in two (Tafti & Vanka Reference Tafti and Vanka1991a) and three dimensions (Tafti & Vanka Reference Tafti and Vanka1991b) for the same flow configuration, with  ${{Re}} = 1000$ (based on the plate thickness) and no imposed free stream turbulence. Low-frequency unsteadiness is only observed in their 3-D simulations. Tafti & Vanka (Reference Tafti and Vanka1991b) demonstrate similar spanwise results in their LSB as compared with the more turbulent results of Cherry et al. (Reference Cherry, Hillier and Latour1984) and Kiya & Sasaki (Reference Kiya and Sasaki1983, Reference Kiya and Sasaki1985). They also observe large streamwise-aligned vortical structures in the aft portion of their bubble through spanwise pressure–velocity correlations. Furthermore, they demonstrate that the maximum streamwise vorticity grows from nearly zero at separation to a maximum before reattachment. They observe strong correlations of
 $(-u', +v')$ and
 $(+u', -v')$ in the shear layer, respectively suggesting the presence of large ejection- and sweep-like motions accompanying these streamwise vortices.
A.4. Airfoils
The presence of the low-frequency unsteadiness for separation bubbles forming over airfoils is well documented by Zaman, McKinzie & Rumsey (Reference Zaman, McKinzie and Rumsey1989) and Bragg, Heinrich & Khodadoust (Reference Bragg, Heinrich and Khodadoust1993), particularly near stall conditions. The low frequency is clearly observed from streamwise velocity spectra for different Reynolds numbers, angles of attack, free stream turbulence intensities, as well as with or without external acoustic excitation. As in the prior flow configurations, some studies have also attributed the low-frequency unsteadiness to large spanwise vortices shed from the shear layer (Burgmann & Schröder Reference Burgmann and Schröder2008). Nevertheless, later studies demonstrate once again a strong correlation between the low-frequency unsteadiness and large-scale streak-like motions in the flow.
Kurelek, Lambert & Yarusevych (Reference Kurelek, Lambert and Yarusevych2016) examine experimentally the coherent structures forming during the transition process of an LSB forming over an NACA  $0018$ airfoil. They observe not only the classical Kelvin–Helmholtz rollers forming in the shear layer, but also that they develop a spanwise undulation. This undulation may be a consequence of an elliptical instability of the vortex filaments (Kerswell Reference Kerswell2002; Marxen et al. Reference Marxen, Lang and Rist2013). As they describe, the reorientation of spanwise vorticity to streamwise vorticity associated with the undulation causes pairs of streamwise vortices to develop close to the wall. These streamwise vortices entrain high-momentum fluid towards the wall and eject low-momentum fluid away from the wall, forming high- and low-speed streamwise streaky structures alternating in the spanwise direction. Yang & Abdalla (Reference Yang and Abdalla2005) observed a similar phenomenon in the transition of a separated flow over a blunt plate without explicit free stream turbulence.
More recently, Ma, Gibeau & Ghaemi (Reference Ma, Gibeau and Ghaemi2020) investigate the separation of a TBL near the trailing edge of an NACA  $4418$ airfoil experimentally. They demonstrate the presence of forward- and backward-oriented stall cells at separation respectively accompanied by high- and low-speed streaks from the upstream TBL. These stall cells resemble the wall-normal vorticity structures observed in the case of a BFS by Wilkins et al. (Reference Wilkins, Hosseinali and Hall2020). The dominant proper orthogonal modes within a near-wall plane also show a streaky pattern and are shown to be associated with motion and displacement of the separating surface. Wang & Ghaemi (Reference Wang and Ghaemi2022) later investigate a TSB forming near the trailing edge on the same airfoil experimentally (
 ${{Re}}_\theta = 2800$). They demonstrate large zones present within the TSB alternating between negative and positive streamwise velocity in time. These structures are noted to be much larger than the streaks present in the upstream TBL and occur at the frequency of the breathing motion which is lower than that of the boundary layer streaks. At the breathing frequency, spectral proper orthogonal modes within a near-wall plane reveal similar streak-like modes as those noted by Ma et al. (Reference Ma, Gibeau and Ghaemi2020). These large zones of fluctuating streamwise velocity are attributed to Görtler vortices formed as a result of the streamline curvature. Wu et al. (Reference Wu, Meneveau and Mittal2020) propose a similar mechanism in their numerical study of a TSB forming over a flat plate (
 ${{Re}}_\theta = 490$).



