


I. HISTORICAL REMARKS
The 62th Denver X-ray Conference and the Plenary Session was held under the banner of “The 100th Anniversary of X-ray Spectroscopy” and this paper will focus on the second half of that period. Nevertheless a few words may be in place about the fascinating time following Röntgen's (Reference Röntgen1895) discovery of “A New Kind of Rays”, also paying tributes to the scientific achievements by C.G. Barkla, M.T.F. von Laue, N.H. Bohr, H.G.J. Moseley, and many others who laid the foundation of today's X-ray spectrometry.
Moseley's (Reference Moseley1913) recognition of the mathematical relationship between wavelengths of elements and their atomic numbers was a scientific landmark in general and for X-ray spectrometry in particular – and the publication of N. Bohr's “Trilogy” (Bohr Reference Bohr1913) about “The Constitution of Atoms” in successive issues of the same volume of the Philosophical Magazine was a spectacular coincidence. However, Bohr and Moseley had been in contact before to discuss Bohr's new theory and Moseley knew about the experiments and theory of von Laue (Reference von Laue1913) and P. Ewald; this – together with the findings of the Braggs (senior and son) – allowed him to accurately (and efficiently) determine the numerical wavelength values as required for their mathematical implementation in “Moseley's law”.
The fact that “secondary X-rays” are emitted by chemical elements and characterized by their atomic weight field effect translators was originally (1906) described by Barkla as a function of atomic weight; its function of atomic numbers was established by Moseley's Law (1913).) (i.e., not by chemical state) was found by Barkla by careful measurement of the absorbability (Barkla, Reference Barkla1905a, Reference Barkla1905b, Reference Barkla1906a, Reference Barkla1906b, Reference Barkla1906c, Reference Barkla1909) of those radiations; their wavelengths and in fact even the nature of X-rays had been still unknown and a matter of dispute. The relationship between energy (in fact, absorbability–no energies/wavelengths were known at that time) was originally (1906) described by Barkla as a function of atomic weight; its function of atomic numbers was established by Moseley's Law (1913). Consequently he sorted them by atomic weight correctly for example, as Fe–Ni–Co–Cu rather than according to atomic number, Fe–Co–Ni–Cu. Barkla (Reference Barkla1912) also showed the polarizability of “Röntgen Rays” as they were still called in English journals at that time.
II. EARLY TIMES OF THE ELECTRONIC AGE
Today's use of the word “electronics” is – concerning hardware – generally associated with semiconductor devices where transistors are the basic element while vacuum tube technology was already well developed since the 1930s. The earliest technical studies and patents of point-type transistors are perhaps those by J. Lilienfeld in the mid/late 1920s [see IEEE Global History Network (2012)]. His work, however, remained in early prototype state without reasonable perspectives of commercial success, mainly because the required high-purity base material (Ge, Si) was not available at that time in sufficient quantity. This changed during the following two decades and was perhaps also stimulated by military developments during WW2 and the cold war thereafter, for example by the frequent employment of Ge-based rectifier diodes in radar technology.
Working point-type junction transistors have been successfully produced by Bell Laboratories by end of 1947 and patents were filed in 1948; manufacturing at the industrial level followed around 1950. For their invention the Nobel Price in Physics 1956 was awarded to William Shockley, John Bardeen, and Walter Brattain.
The first radiation detector based on semiconductor junction technology was developed by McKay (Reference McKay1949) encouraged and under guidance by W. Shockley; this is further discussed below.
III. SEMICONDUCTOR DETECTORS AND RELATED DEVICES
Naturally electronic consumer products have been among the first to take advantage of the small size and low power consumption of transistors and it must be assumed that this was also the case with certain military devices. The first transistorized car radios were announced in 1954. However, for high-quality/high-reliability devices vacuum tubes were still preferred.
Radiation detectors for X-rays in the 1950s where mainly gas filled counters similar to those employed today. Their disadvantage was low absorption of high-energy radiation by the gas. Attempts instead to use high-purity crystals with electrical area contacts on two opposite faces were made for about a decade after 1945 (Figure 1). The working principle of these “Crystal Detectors” (van Heerden, Reference van Heerden1945; Wooldridge et al., Reference Wooldridge, Ahearn and Burton1947; Jentschke, Reference Jentschke1948; Hofstadter, Reference Hofstadter1950) is similar to that of gas-filled detectors: an electrical charge is initially produced proportional to the energy of the absorbed photon or particle (however, with path-length dependent losses of charge carriers on their way to the electrodes), and without the advantage of a (well-defined) equivalent to the “gas amplification factor”. Disadvantages were the high dark current and recombination rate because of impurities and crystal imperfections. The technology went out of use in the mid-1950s.
(Color online) Scheme of Crystal Detector as described by Dearnaley (1966).

Semiconductor detectors in today's sense are Junction Detectors. The basic principle is illustrated in Figure 2. When two pieces of a high-purity crystal (e.g., Ge), one doped with p-type atoms (electron acceptors) and the other with n-type (electron donators), are brought into contact, free charge carriers from each side will move into the contact zone and compensate some of the opposite potential. A gradual transition zone builds. If a potential in proper polarity (+ to the n-type, − to the p-type sides) is applied, the free charge carriers are withdrawn from the populated contact zone and a depleted zone (no charge carriers) remains. This is the useful detection volume for absorbed radiation. In the ideal case, the free charge carriers are only built by ionization processes in proportion to the energy of the absorbed photon and particle and led to external amplifiers by an applied potential. Of practical importance are: the size (volume) of the depleted zone; the purity (low concentration of foreign trace elements); the perfectness of the crystal lattice (acting as traps for charge carriers); and the quality (low-noise level) of the amplifier for the collected charge. Today's Si(Li) detectors (and others) are the result of essential improvements in all mentioned aspects over a period of around 20 years, from the early junction detector by McKay to commercial Si(Li) detectors for X-ray spectrometry and other applications.
(Color online) Scheme of p-n junction.
McKay's junction detector (McKay, Reference McKay1949, Bell Laboratories, under direction of Shockley) is the earliest reported junction detector and consisted of a simple point contact between a phosphor-bronze wire and an n-type Ge-crystal with an area contact at the backside (Figure 3). The configuration corresponds at first view to a metal–semiconductor junction. However, early transistors were “electrically formed” by passing a short but large current pulse in the reverse direction through the collector. This seems to have caused diffusion of Cu atoms into the contact area and formed an increased depletion area. While such procedures were studied and applied at Bell Laboratories and general reports exist (e.g., Pfann, Reference Pfann1950), detailed information specifically related to McKay's detector is rare; some was reported by Dearnaley (Reference Dearnaley1966, in Figure 1 of that article a “p” denotes the metal side of the junction). Experimental data of the detector have been shown by McKay for detected alpha particles that are slowed down and loose their energy along very short distances in Ge (therefore requiring only a small depletion volume); nevertheless the detected charge varied due to recombination effects. Pulse height analysis was possible and is reported by McKay by showing the relationship between collected charge (extrapolated for correction of losses) and applied detector voltage.
(Color online) Scheme of “Germanium Counter” by K.G. McKay.
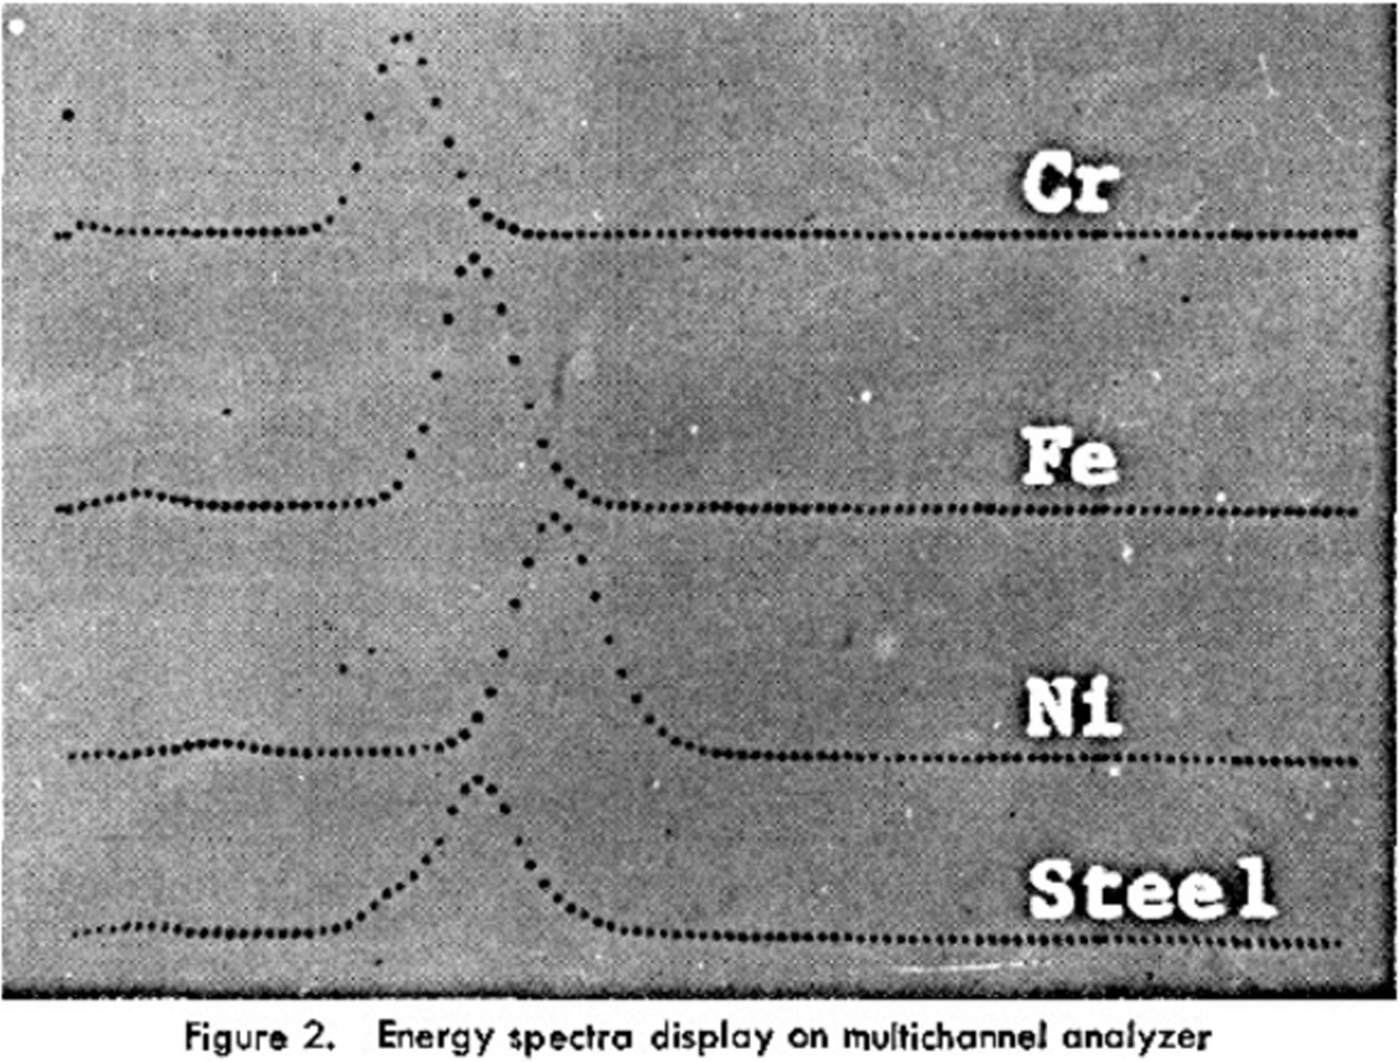
The term “Energy-Dispersive XRF” has its origin probably in the mid-1950s with the advent of (vacuum-tube-based) multichannel analyzers in combination with gas-filled proportional counters; in 1954 an 8-channel “X-ray Quantometer” was presented at Pittcon (Kemp and Andermann, 1956; Kemp et al., 1955; Lüscher, Reference Lüscher1955). Applications by employing a 400 channel MCA and gas proportional counters were described by Birks and Batt (Reference Birks and Batt1963) showing Fe–Cr–Ni spectra with a resolution of around 1200 eV; an improved version (but with same energy resolution, Figure 4) for excitation by secondary targets followed 3 years later (Birks et al., Reference Birks, Labrie and Criss1966). Even for the difficulties with the deconvolution of overlapping peaks arising from the relatively poor energy resolution the technology was seen as advantageous in terms of speed and higher sample throughput.
Early EDX spectrum of a steel sample. From: Birks et al. (Reference Birks, Labrie and Criss1966).
In the mid-1960s two crucially important prerequisites for practically useful Si(Li) detectors [and initially since the early 1960s, Ge(Li)] have been finally met: the expansion of the size of the depleted region of the p–n junction (active detector volume) by drifting Li-ions into that area and thereby compensating the effects of impurities and lattice defects; and the development of a low-noise preamplifier stage based on a new generation of cooled field-effect transistors and matching electronics (Pell, Reference Pell1959; Ryon, Reference Ryon2001; Lechner et al., Reference Lechner, Fiorini, Longoni, Lutz, Pahlke, Soltau and Strüder2004).
Thereby the Si(Li) detectors presented by Bowman et al. (Reference Bowman, Hyde, Thomson and Jared1966) achieved a resolution full width at half maximum comparable to that of gas proportional counters of 1300 eV for Ni–K radiation. The first complete analytical energy dispersive system was probably the “Solid-State Energy-Dispersion Spectrometer for Electron-Microprobe X-ray Analysis” by R. Fitzgerald, K. Keil, and K. Heinrich (Fitzgerald et al., Reference Fitzgerald, Keil and Heinrich1968). The great advantage of the solid-state detector in electron probe microanalysis over dispersion by a crystal in focusing geometry was that the displacement of the source point of fluorescent radiation by the scanning electron beam has only insignificant impact on the measured intensity.
The new technology became quickly popular and developed rapidly in the highly competitive environment of a rising number of high-tech companies. What in 1966 was called a “line-width horse power race” in view of the new 2N3823 low-noise FET and 700 eV resolution for FeKa (Donovan, Reference Donovan1966) was by far exceeded by reality already 2 years later: In 1968, Aitken showed a spectrum illustrating a “best system resolution that has come to the author's attention to date” of 330 eV for FeKa with a 25 mm2 Si(Li) detector; 2 years later Frankel and Aitken reported 170 eV available for the best commercial instruments and 150 eV was in development (Aitken, Reference Aitken1968; Frankel and Aitken, Reference Frankel and Aitken1970).
In view of the many competent and detailed papers and reports of today's modern detector technology at the Denver X-Ray Conference (and the presence of manufacturers at the trade show), only a few general comments are given about recent developments. The most significant innovation was the introduction of Silicon Drift Detectors by E. Gatti and P. Rehak (Gatti and Rehak, Reference Gatti and Rehak1984). They consist of a thin Si disc with a generally large sensitive surface area (several mm2 up to exceeding 100 mm2) carrying an arrangement of concentric electrodes at the surface and full area back contact. The small size of the center electrode (charge collector and input to the FET amplifier stage) is a key property for low electronic noise even at extremely high count rates (because noise is proportional to capacitance and therefore area). Pahlke (Reference Pahlke2013) reports the latest progress by models featuring 150 eV resolution at 1 Mio counts s−1 and 150 mm2 detector size. A general disadvantage of designs with thin Si discs is that the absorbability for photons with higher energies depends on the direction of incidence. Special models allow application at room temperature (Lechner et al., Reference Lechner, Fiorini, Longoni, Lutz, Pahlke, Soltau and Strüder2004).
A special design of solid-state detectors are pnCCD detectors consisting of a large array of p–n junction cells (several thousand); during a single exposure cycle the charge created by the absorbed photons is stored in each cell and thereafter shifted through read out electronics to further stages of processing. A typical cycle rate is 200 Hz. If the collected charge comes from a single photon the energy of that photon can be determined from the average ionization energy of the junction: the device is then an array of energy-dispersive detectors and well suited for imaging applications (Send et al., Reference Send, Abboud, Hartmann, Huth, Leitenberger, Pashniak, Schmidt, Strüder and Pietsch2013).
Handheld XRF devices have their origin in portable instruments for the analysis of Radon (historical name: Niton, from which a company's name was derived later) developed around 1990 by L. Grodzins (Reference Grodzins2012). Extension of the field of analyses (lead in paints of houses, tools, and toys) and more general applications led to cooperation with commercial manufacturers (Pantazis, 2010) and the design of miniaturized instruments known as Handheld XRF. The short air distance between sample and detector entrance window allows also analysis of light elements with reasonable detection limits. The built-in software is often based on libraries of materials (e.g., metals) and matching of spectra.
IV. IMPACT BY COMPUTERS (AND X-RAY ANALYTICAL SOFTWARE)
The first research computer (perhaps more an object of research rather than a tool for research) was probably installed 1953 at the University of Manchester, featuring 92 point contact transistors with an average life time of less than 1 h, and around 500 diodes. No high level programming language was available at that time. Fortran, developed by J. Backus, IBM, became commercially available in 1957 together with the (probably) first commercial “all solid state” computer (IBM 608) followed by DEC PDP-1 (1959), IBM 360 and CDC 6600 (1964), DEC PDP8 (1965), and the IBM PC (1981). The phenomenal success of the IBM PC was not so much because of its technical superiority over others at that time but the fact that the market leader laid open the technical specifications, which guaranteed a high level of stability; this encouraged many smaller enterprises to software and hardware developments as well as implementation of PC's into industrial instrumentation (such as X-ray analytical equipment).
The historical mathematical attempts to describe the number of X-ray photons from a sample have therefore been quite academic studies (Glocker and Schreiber, Reference Glocker and Schreiber1928; Gillam and Heal, Reference Gillam and Heal1953; Beattie and Brissey, Reference Beattie and Brissey1954; Sherman, Reference Sherman1955) without practical numerical calculations. At the Denver X-ray Conference 1957 J. Sherman presented his equations by proposing also a “method of measured dilution” that “(a) Integration with respect to λ (the polychromatic effect) is avoided by converting the spectrometer into monochromator. (b) The complication of the quadratic and higher terms (…) is avoided by so selecting the wavelength of the monochromator that the element Z is effectively the element of the highest atomic number to be excited” (Sherman, 1957). The first reports of computations obtained by numerical integration of the excitation formula for direct and indirect excitation (including tertiary) was given by Shiraiwa and Fujino (Reference Shiraiwa and Fujino1966), and the first published software for solving fundamental parameter equations in non-trivial cases was probably NRLXRF, developed at the Naval Research Laboratories (NRL) by Criss et al. (Reference Criss, Birks and Gilfrich1978). At that time the required computer readable collections of fundamental parameters including tabulated tube spectra (Gilfrich and Birks, Reference Gilfrich and Birks1968) were available: wavelengths by Bearden and Burr (Reference Bearden and Burr1967), absorption coefficients by McMaster et al. (Reference McMaster, Kerr Del Grande, Mallett and Hubbell1969), Auger/Coster Kronig transition data by Bambynek et al. (Reference Bambynek, Crasemann, Fink, Freund, Mark, Swift, Price and Venugopala Rao1972), and various versions of computed tube spectra.
V. CURRENT STATE AND OUTLOOK
Figure 5 shows the graphical representations of statistical data obtained from the SCOPUS database (Elsevier B. V.) by searching for keywords in article titles and abstracts related to energy-dispersive X-ray spectrometry (EDX). The impressive increase of publications during the decade 1970–1980 (Figure 5, left graph) was followed by some stagnation in the 1980s but further increased until present times (Figure 5, center graph). The diversity of applications is shown in Figure 5 (right graph, representing the focus of journals, not individual content of articles), with almost two-thirds related to physics, chemistry, engineering, and materials sciences. The increase of EDX-related publications is, however, at least partially biased by a generally growing number of publications. The data in Figure 6 show the development of “technical” vs. “non-technical” papers therefore relative to the total number of papers in each year. It is interesting that the non-technical fraction greatly increased in the first decade (breaking even with the technical) but was continuously reduced until year 2000; it appears to be stable since then. If a relationship exists between the stagnation in the 1980s and the trend reversal at the same time is unknown. It is, however, frequently observed that authors of papers cooperate with others having a quite different background (often technical vs. non-technical) and then choose the more technical journals (Figure 7).
(Color online) Number of publications/year with keywords “Energy dispersive” and “X-ray” in title or abstract. Right: Frequency of publications in field-specific journals (main areas). Statistics using Scopus/Elsevier.
(Color online) Fraction of publications per year in technically oriented (blue) and non-technical journals (red) (keywords and reference as in Figure 5).
(Color online) L-range of μ/ρ (Cu). Non-parallel lines indicate energy-dependent subshell ratios (Cullen 1997).
The obvious trend toward multidisciplinary application of XRF in general and EDX in particular goes hand-in-hand with the development of new instrumental features and methods such as trace analysis, microanalysis, imaging, confocal depth profiling, and various industrial specialties; among the interesting mathematical/methodical developments are reference-free methods (including the “pre-calibration” and “truly reference free” variants), Monte Carlo methods, and the combination of XRF with statistical methods and chemometrics (occasionally conflicting with the advantageous principles of fundamental parameter methods). While the high long-term stability of modern instruments in combination with pre-calibration using dedicated type standards (matching the intended application by the user) gives the comfortable impression of reference-free analysis, the scientific “truly reference free” methods require calibration of all components of a setup vs. metrological standards (i.e., effectively against the international unit system, not against application oriented reference samples). Only a few laboratories have these abilities, but are the final reference for obtaining (best possible) unbiased fundamental parameter values.
In all fundamental parameter methods, the quality of the parameters themselves is a key factor. While most K-line related parameters are quite well known except for low atomic numbers this is by far not always the case for L- and M-lines. Besides individual numerical values is sometimes also the method of definition and determination that requires critical investigation as shown below for the subshell photo-absorption coefficients.
The L-subshell ratios τ L1:τ L2:L3 of photo-absorption are conventionally assumed to be constants (determined as the ratio of the high- and low-energy values in the vicinity of the subshell edges); however, theoretical computations show clearly energy dependence (Figure 7). Recently experimental data became available that confirm the theoretical values; (Hönicke et al., Reference Hönicke, Beckhoff, Müller, Kolbe, Krämer and Mantler2012; Doi et al., Reference Doi, Kawahara, Hara and Mantler2013). In context of the often complex rearrangements within the electronic structure after an initial ionization in an inner shell such studies and the application of the findings are relevant in practical applications.
Trying to extrapolate the developments into the future reveals a pattern of challenges, not all with entirely optimistic expectations. On one hand, the assumption that instruments will become more powerful, the methods more advanced, and applications more versatile is reasonable – but at the same time the average future user tends to be less frequently a specialist in analytical sciences and more dependent on automated black-boxed procedures designed by programmers and instrument developers who are not necessarily specialists in the intended field of application. The situation becomes even more complex by the simultaneous application of different analytical techniques. As already mentioned the frequently observed cooperation of experts with different background (such as technical/non-technical) will be increasingly helpful and will need its mirror on the side of developers of instruments and methods.



