


This article uses demographic data from nineteenth-century Angola to evaluate one of the most influential and contested theories in African history, the idea that external slave trades fundamentally transformed the institution of slavery in Africa. This ‘transformation’ thesis consists essentially of two parts.Footnote 1 The first part relates to changes in slavery that occurred because of a growing slave trade from sub-Saharan Africa to other parts of the world, most notably after 1500 via the transatlantic slave trade. The second part holds that transformations that were even more radical took place during and after the European suppression of the Atlantic slave trade, which caused significant economic change and a reorganisation of labour supplies in the coastal areas of western Africa. This article will evaluate the ‘transformation’ debate using demographic surveys from colonial districts in the coffee belt of nineteenth-century Angola. In the context of this forum, we explore the analytical possibilities of the censuses produced in the Portuguese Empire from the late eighteenth century, which have given demographers and other researchers a unique series of historical population data for the African continent. Moreover, by focusing on the category of the enslaved, the article makes a significant contribution to understanding the demographic context of slavery in the era of abolition.
Since Walter Rodney's seminal statement on African slavery in 1966, several scholars have defended the idea that, after the opening of the transatlantic slave trade in the sixteenth century, slavery developed from a marginal feature of social life into a central institution governing social relationships in the coastal regions of western Africa.Footnote 2 This transition mainly happened because political and economic elites in areas supplying enslaved people to Atlantic markets found new ways to make use of captive labour at home. Historians like Paul Lovejoy, Patrick Manning, Stephanie Smallwood, and Kwasi Konadu acknowledge that different kinds of slavery previously existed in Africa. But they argue that, under the impact of an expanding export market, slavery became a dominant form of organising labour within African societies, more commodified and detached from kinship structures and characterised by greater gender imbalances, as generally more men than women were sold into the Atlantic slave trade.Footnote 3 Lovejoy has been the most articulate proponent of this argument, although for him what mattered was the demand for enslaved persons from across the Sahara and the Indian Ocean as well as the Atlantic. Under the influence of these different external trades, ‘societies with slaves’ in sub-Saharan Africa developed into ‘slave societies’ in which production in at least some economic sectors became dependent on slave labour. In western Africa, the transatlantic slave trade became the main factor in the interplay between external and internal dynamics from the moment European colonists developed mining and plantation economies in the Americas that depended on the exploitation of enslaved Africans. Significantly, in a region like Angola the only extra-African slave trade was the Atlantic one.Footnote 4
Against this view of the Atlantic world's ‘impact’ on Africa, John Thornton has argued that slave ownership and slave trading were already widespread when Europeans first arrived in West Africa and that Atlantic markets only created an additional outlet for internal trade networks.Footnote 5 Other critics of the transformation thesis, like David Eltis and Ralph Austen, contend that, beyond the coastal zones where African brokers exchanged captives with their European trading partners, the impact of Atlantic commerce on African societies was too limited for it to have been a major force of social change. According to these scholars, among a range of factors influencing the size and composition of slave populations in Africa, including different internal demands for labour, the European slave trade was perhaps the least significant.Footnote 6
One key element in the approaches of Lovejoy and Manning is the claim that the transformation of African slavery into a ‘mode of production’, starting in the 1400s, accelerated during the nineteenth-century suppression of the transatlantic slave trade and the associated growth of ‘legitimate’ commerce. With the closing of Atlantic slave markets, they argue, labour previously exported to the Americas was increasingly retained for commercial farming within Africa, in some instances giving rise to American-style plantation slavery.Footnote 7 Critics like Eltis and Austen think this argument, again, gives too much weight to external inducements to social and economic change in nineteenth-century Africa. Since the Atlantic slave trade did not structurally transform African societies, the ramifications of its suppression were also limited. If anything, they would argue, declining slave prices on the African coast after British abolition of the trade in 1807 suggest that local demand for slave labour was falling.Footnote 8
There is disagreement, therefore, on the question of whether the abolition of the slave trade created a labour reservoir in coastal areas, encouraging former slave exporters to seek alternative means of self-enrichment. Most historians agree, nonetheless, that slave labour played a crucial role in the expansion of commercial agriculture in Africa during the 1800s. In this watered-down version of the transformation thesis, it was the development of new commodity trades, which created their own labour demands, that caused slave populations to grow rather than the closing of the export slave trade. Gareth Austin articulates this position in relation to West Africa, where, he says, ‘the basic social units of commercial agriculture, at least by the mid and late-nineteenth century, were large slave estates combined with “ordinary” households expanded by the incorporation of captives.’Footnote 9 This view has a counterargument, too, which is that the nineteenth-century expansion of cash crop production did not necessarily depend on coerced labour. In Senegal, for instance, free peasantries pioneered the development of groundnut production, while in southeast Nigeria many palm oil farmers bought wives, not captives, to extend their households.Footnote 10 These arguments have not yet been tested much in the Angolan context, although implicit endorsements of Austin's position can be found in the work of, for instance, William Gervase Clarence-Smith, Aida Freudenthal, Roquinaldo Ferreira, and Mariana Candido.Footnote 11
In this article, we use demographic data from nineteenth-century Angola to refine three basic arguments of the transformation theory: first, that the transatlantic slave trade contributed to growing enslaved populations in Angola; second, that these populations were predominantly female; and third, that slavery in Angola expanded during the agrarian transition after the suppression of the slave trade. The data are drawn from the Counting Colonial Populations database, an online repository of population tables of different territories in the Portuguese Empire from 1776 to 1890.Footnote 12 The demographic data available for Angola cover the last phase of the transatlantic slave trade and the early growth of export-oriented agriculture, which in Angola was most noticeable in its expanding coffee sector. Numeric data on the size and composition of slave populations in several coffee-producing districts should allow us to measure the impact of Atlantic commerce on local social structures until about 1870. To do so, we shall first discuss our methodology in the light of the document collection made available through Counting Colonial Populations. The next section examines the Angolan data to assess three key arguments of the transformation school, starting with a reflection on Jan Vansina's study of Ambaca, a slave-trading hub in the hinterland of Luanda. The conclusion sums up the results and offers potential avenues for further research in the historical demography of slavery.
By using demographic surveys from the 1790s through the 1860s to track population sizes over time, this article departs methodologically from a trend in African historical demography that is concerned with constructing estimates of long-term population growth. Patrick Manning recently revisited his earlier work on population growth in Africa, using estimated growth rates and backward projections from 1950 census data to calculate total populations in Africa from the mid-nineteenth century.Footnote 13 As in his earlier model, the impact of the export slave trade on population size figures prominently in these calculations. In a recent correction of Manning's estimates, Ewout Frankema and Morten Jerven suggest that it is necessary to ‘redirect attention from the demographic impact of the various slave trades, towards the potentially much bigger shocks produced by the increased exposure of Africans to Eurasian diseases . . . in the late nineteenth century, as well as the prevention measures that have been developed in response’.Footnote 14 We acknowledge that slaving was only one of several factors influencing population growth in Angola. In assessing the demographic impact of Atlantic commerce, however, we aim to showcase a different methodological approach to demographic history in precolonial Africa. We demonstrate that, at least in the former Portuguese domains, it is possible to study population history before 1900 using empirical data, thus avoiding the need to make backward projections based on debatable assumptions.Footnote 15
Critics might argue that since our data come from African territories that were nominally Portuguese, home to populations of so-called residents (moradores) and indigenous chiefs (sobas) who were subject to European jurisdiction, they are unrepresentative of wider precolonial patterns in sub-Saharan Africa of the kind sketched by Rodney and his successors. Indeed, the data do not relate directly to changes in African societies outside these protocolonial enclaves. Even so, it is important to recognise that these enclaves were mainly inhabited by locally born Africans who assumed a Portuguese identity and, in exchange for colonial protection, accepted the authority of the Portuguese Crown. Many of these Luso-Africans were slaveowners who engaged in commerce and agriculture and mediated the transatlantic slave trade between inland suppliers and Brazilian buyers.Footnote 16 In the nineteenth century, some of them turned to coffee growing, alongside a handful of new settlers from Portugal and Brazil and hundreds of independent African farmers. In the same way that Lovejoy saw this emerging coffee sector as evidence supporting the transformation thesis, we hope that the conclusions reached here will resonate beyond the confines of Angolan history.Footnote 17
Counting colonial populations
The rich corpus of historical population data extant in Portuguese colonial archives has long caught the attention of historians of empire. In the 1960s, Dauril Alden and Maria Luiza Marcílio pioneered the historical study of Brazilian demography by examining eighteenth-century population tables (mapas da população) from different parts of colonial Brazil.Footnote 18 However, the systematic analysis of similar demographic data from other regions of the Portuguese Empire only developed seriously in the 1990s. Following the multi-volume Nova História da Expansão Portuguesa, which paid close attention to the demographic structures of Portugal's overseas territories, several independent studies of Macau, Goa, São Tomé and Príncipe, Cabo Verde, Angola, and the Azores based on colonial census data appeared. These studies tended to concentrate on general developments in population size and structure in the short or medium term. Questions concerning long-term changes in the social composition of colonial populations, especially regarding the weight of different racial categories and of free and unfree populations, remained understudied.Footnote 19
The international project Counting Colonial Populations, which launched in 2014, aimed to advance the demographic study of the Portuguese Empire through the systematic collection and interpretation of historical population tables. These tables, produced from the late eighteenth through late nineteenth centuries, resulted from a series of Crown orders instructing governors throughout the empire to send the colonial office in Lisbon every year a standardised survey of the populations under their jurisdiction. In most colonies, governors aggregated data collected at the parish level, where priests counted people and split them into age groups using baptismal, matrimonial, and vital records as well as confession rolls. In Brazil and Angola, however, governors rarely aggregated data beyond the administrative level of the capitania (Brazil) or the presídio (Angola), and as a result, general tables for these colonies are far and few between. The Angolan presídio, an archaic form of what later became the colonial district, usually overlapped with a parish, so in Angola the presídio was generally the only level at which people were tallied.Footnote 20 Counting Colonial Populations has been able to collect about 2,700 tables created in all corners of the empire, from Mato Grosso in the western hemisphere to Timor in the east. The tables produced in Cabo Verde, São Tomé and Príncipe, Angola, and Mozambique rank among the oldest population counts in sub-Saharan Africa.
The project database contains 571 population tables from Portugal's former African possessions, with 291 coming from Angola. These tables divided populations racially into categories of white (brancos), mixed (pardos), and black (pretos), with the latter two groups subdivided into free and enslaved, and in theory all categories included a breakdown by age and gender.Footnote 21 But the territorial coverage of these imperial censuses was uneven. Because the archipelagos of Cabo Verde and São Tomé and Príncipe were almost fully colonised, local governments were able to count most inhabitants. In Angola and Mozambique, however, the regions under Portuguese jurisdiction where census takers could operate tended to be isolated districts, generally located close to the coast or along the major waterways. In Mozambique, moreover, the government's power to count was so limited that only Christians and Indian minorities were included, thus leaving out most of the Africans living under Portuguese rule.Footnote 22
Angola produced its first census in 1777, which was a count of the colony's total population with no segregation of districts.Footnote 23 New instructions in 1797 told the governor to distribute all inhabitants over four different age groups (0–7, 7–14, 14–25 and 25 and older) and classify them according to marital status, origin (European, African, or American), and legal status (free or enslaved).Footnote 24 The racial categories remained the same. From that year on, all administrative units in Angola produced their own tables, generally following the standard format described above, although, as Governor Nicolau de Abreu Castelo Branco admitted in 1827, the requested details were not always available for all segments of the population.Footnote 25 On several occasions the administrator of Pedras de Pungo Andongo pointed out, for instance, that his district's census did not include ages for the enslaved, as many of them had been purchased in the interior and so their births were not registered.Footnote 26 In other cases, ages were determined by approximation.Footnote 27 In the 1860s, the tables also included a wide range of additional categories, such as religion, educational level, and profession, although the census takers could only collect these specifics from a very small section of the population.
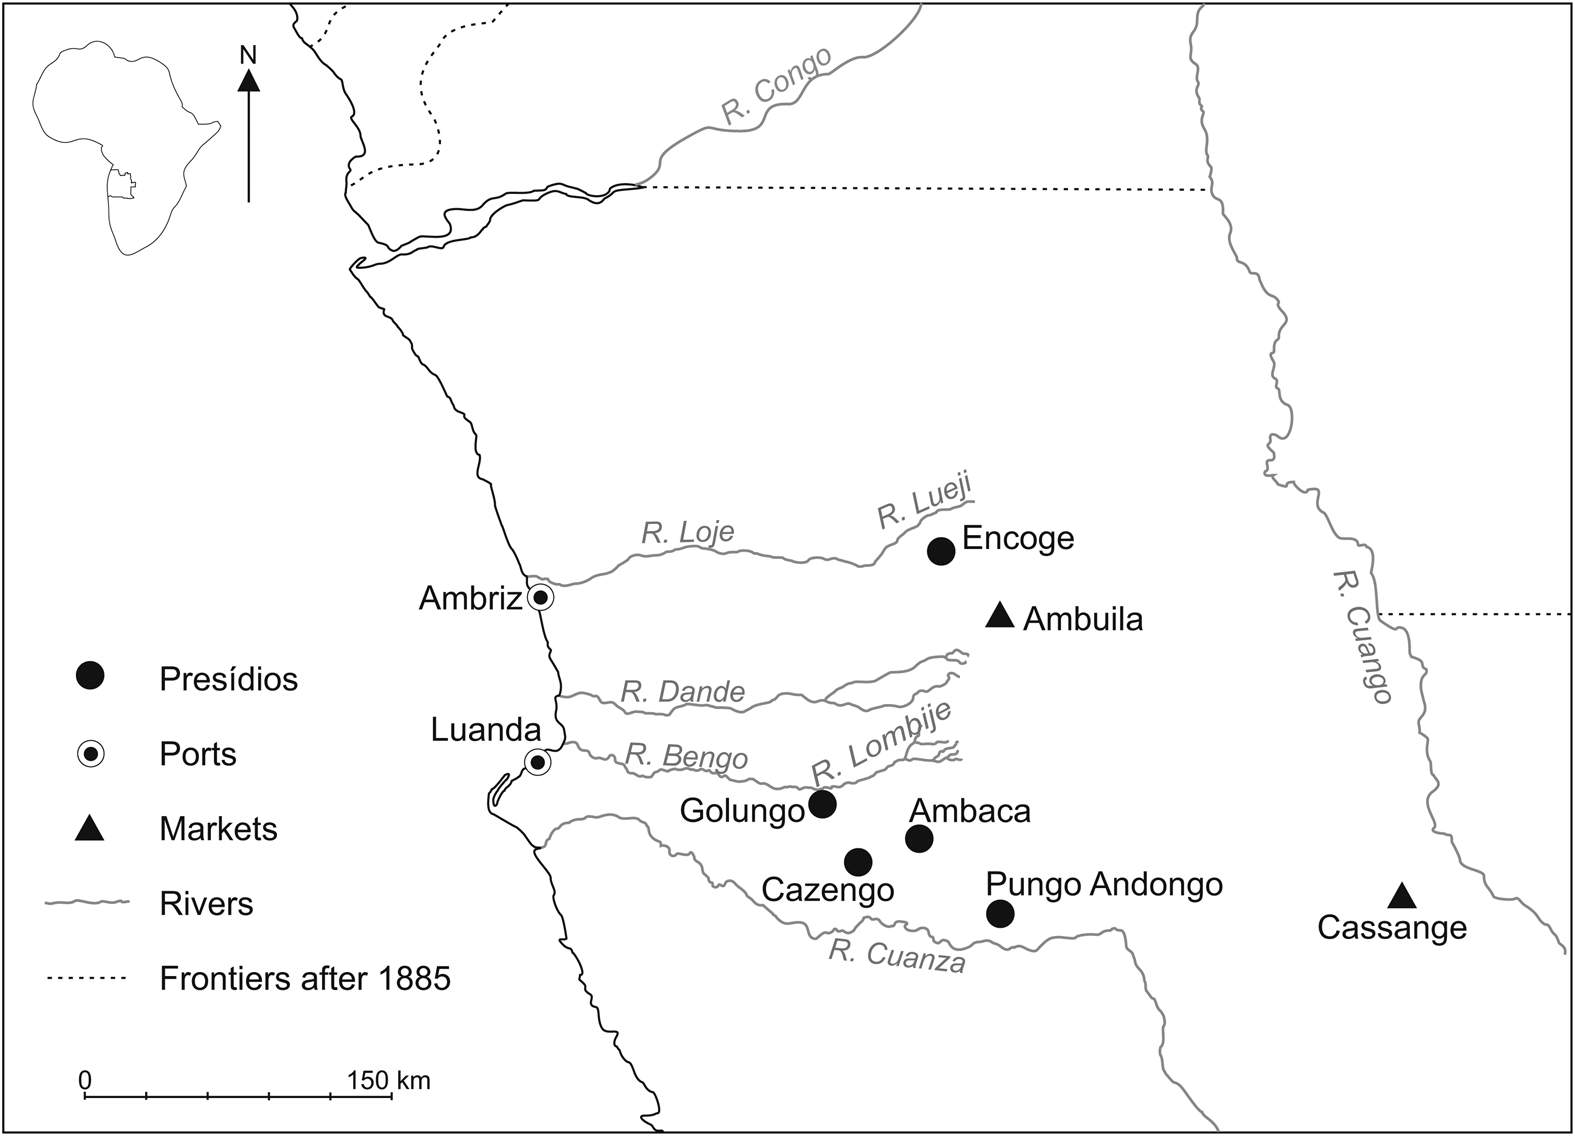
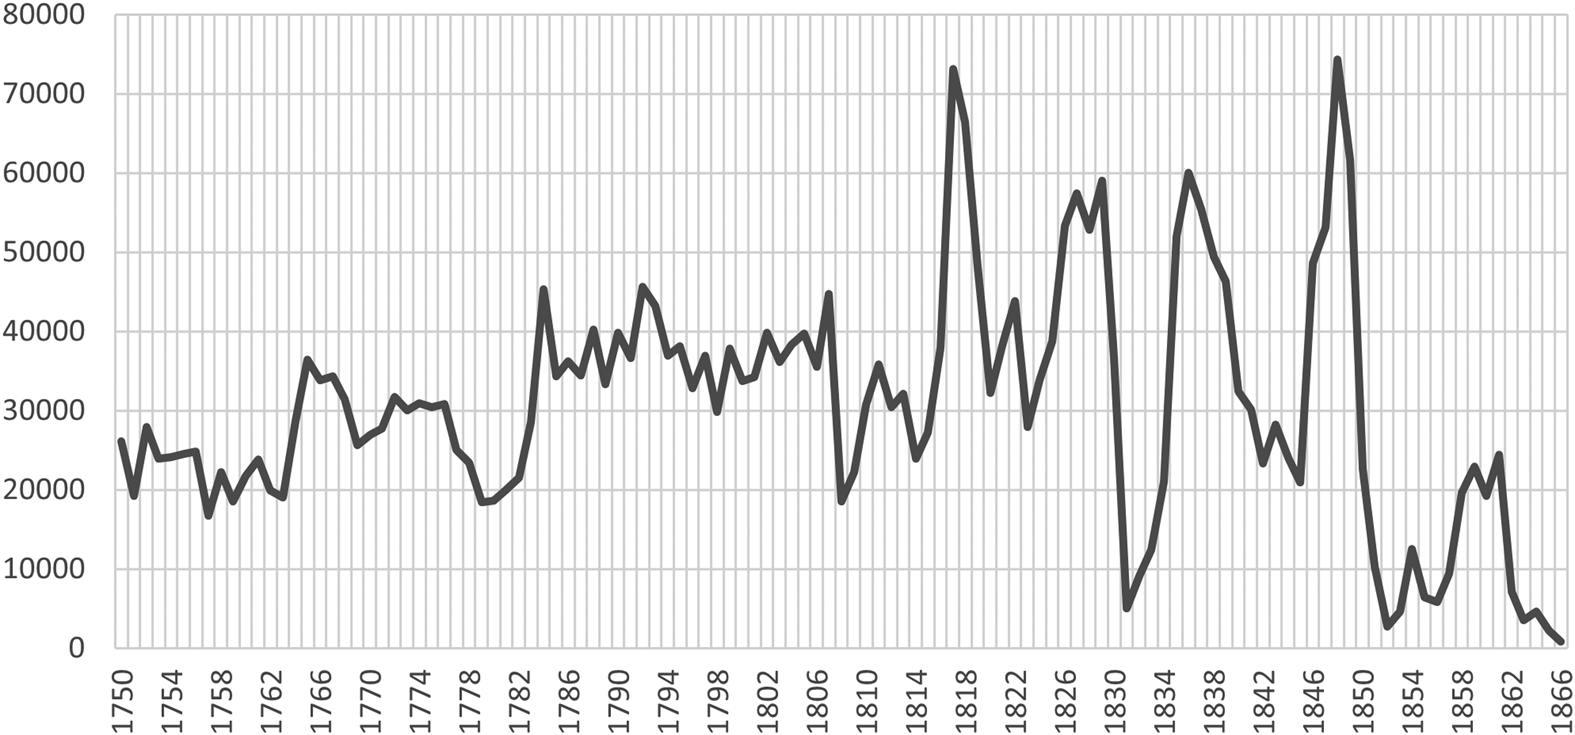
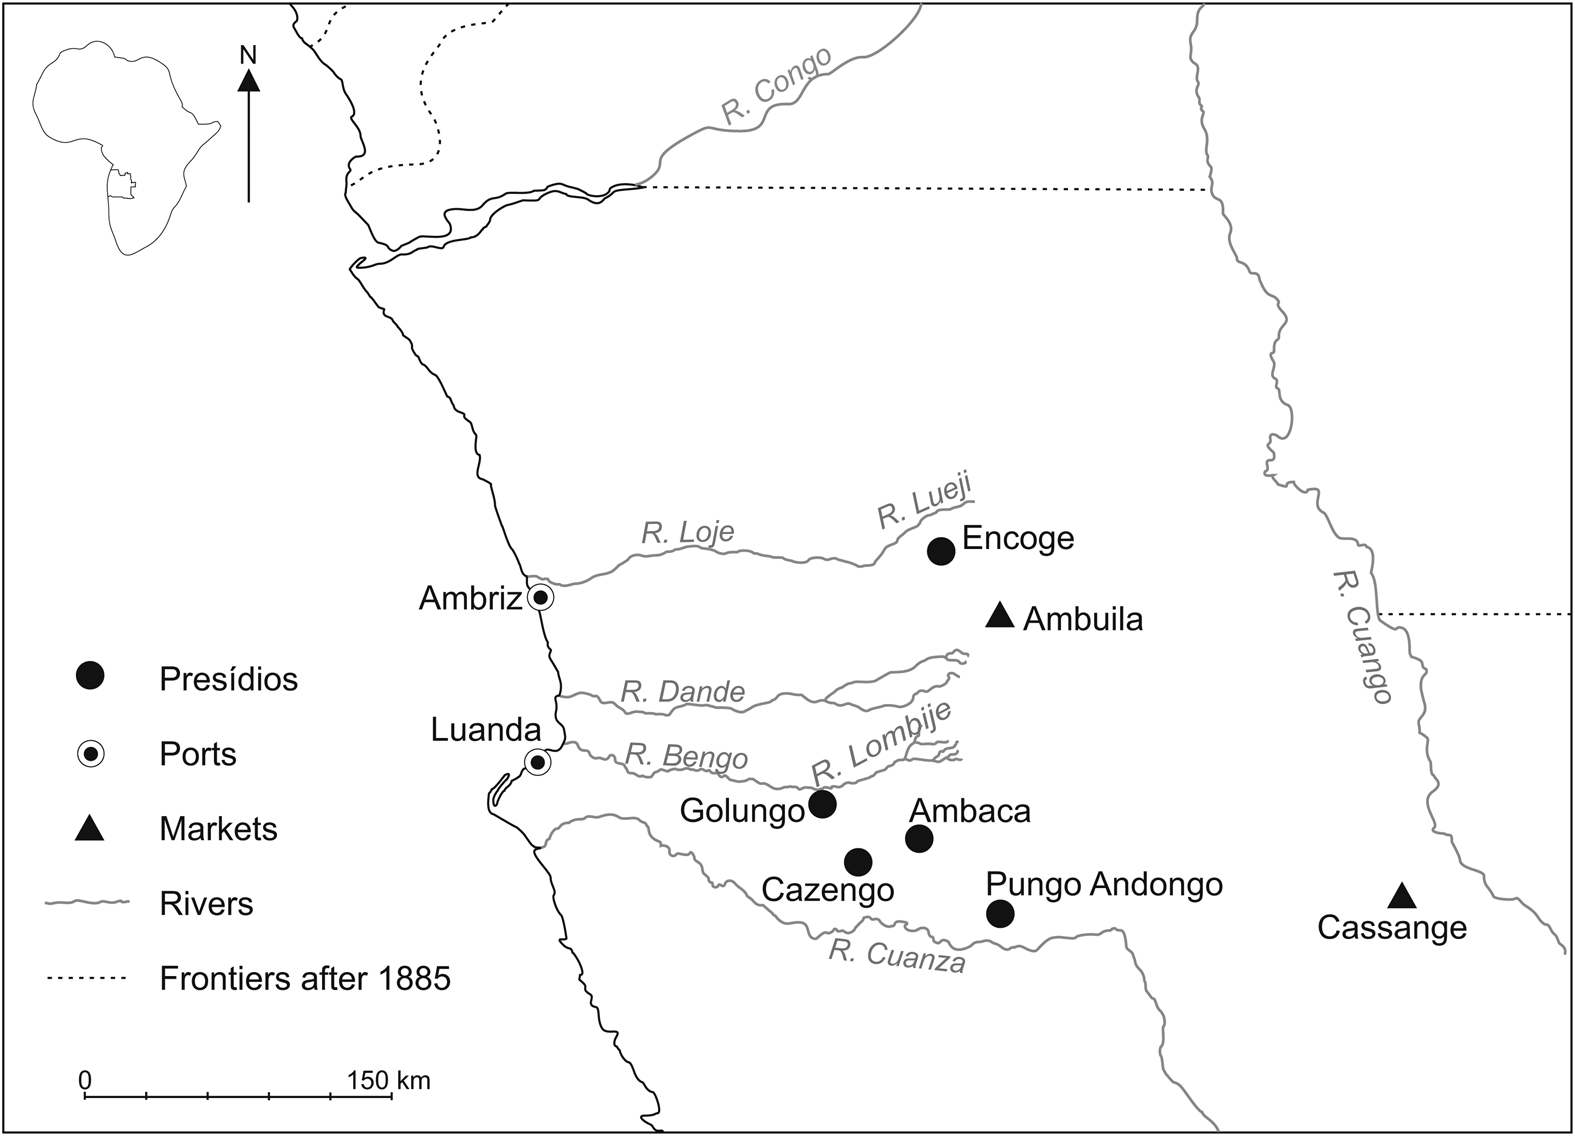
This article examines the population tables from four adjacent districts in northern Angola: Ambaca, São José de Encoge, Golungo, and Cazengo; the latter became a separate administration from Golungo around 1850. These districts sat in a mountainous, subtropical forest region about 200 to 300 kilometres from the Angolan capital, Luanda (Fig. 1). They were the core of a coastal hinterland that for several centuries supplied Luanda and ports near the Congo River with captives for the transatlantic slave trade.Footnote 28 As the website of Slave Voyages: The Trans-Atlantic Slave Trade Database indicates, the draining of enslaved people from West Central Africa to Brazil and Cuba continued unabatedly in the first half of the nineteenth century despite the onset of British abolition (Fig. 2).Footnote 29 In fact, between 1807 and 1850, slave exports from Luanda and the wider Angola region peaked at unprecedented levels. The slaving business tapered off when Brazil effectively banned the importation of enslaved Africans in 1850, making Cuba the last overseas market still open to Angolan slave dealers.Footnote 30 By 1862, abolitionist measures across the Atlantic basin had reduced the slave trade from Angola to a level last witnessed in the mid-seventeenth century, but it took another five years to supress the traffic completely. It was during this time that Angola's fledgling export trade in commodities began to develop in earnest.
Northern Angola. Adapted from a map produced by Portugal's Commissão de Cartografia, Carta de Angola contendo indicações de produção e salubridade (Lisboa, 1885). Courtesy of the Biblioteca National de Portugal (https://purl.pt/1926/2/). Map by Maria João Pereira.
Enslaved Africans shipped from West Central Africa, 1750–1866 (estimated numbers).
Source: ‘Trans-Atlantic slave trade: estimates’, STDB, (https://www.slavevoyages.org/assessment/estimates), accessed 4 Apr. 2021.

Portuguese officials had been debating the promotion of commercial agriculture in Angola since the late eighteenth century. Anticipating the end of the transatlantic slave trade, in the 1820s some optimistically depicted Portugal's crown colony in Africa as a ‘new Brazil’, a land rich in soils and natural resources, which could make up for the loss of American territories and be a worthy substitute for the increasingly indefensible trade in human beings.Footnote 31 In 1844, in an early expression of the transformation thesis, the military officer and colonial statistician José Joaquim Lopes de Lima reasoned that slave owners in Angola would soon use the captives currently sold abroad for domestic production instead.
The number of slaves [in Angola] should increase as soon as the inhabitants of our cities and inland districts decide to build plantations rivalling those of Brazil . . . and the allied chiefs in the interior, convinced they can no longer sell their subjects and slaves to foreign lands, realise how beneficial it is to employ them in extracting profit from their own lands by sending colonial products to markets.Footnote 32
While colonial projects envisioned the development of several potential cash crops, including tobacco, cotton, and sugar, only coffee became a significant export earner in the nineteenth century. This was mainly because coffee was an indigenous tree crop, appreciated by African smallholders and foreign settlers alike because its cultivation required little capital. Coffee could be integrated into mixed cropping systems and only demanded significant labour inputs when trees were planted and when, in the dry months from July to September, the ripe berries were harvested, dried, and packed for sale. Africans also foraged wild cotton and tobacco, but more for domestic consumption than for export. Cotton did not fit easily into African systems of subsistence farming, and early Portuguese attempts to increase cultivation failed because of recurring low prices, environmental factors, and labour shortages on settler farms. Colonial initiatives to develop sugar production were unsuccessful until the early twentieth century, as high capital requirements long kept investors away.Footnote 33 At the same time, the production of coffee, like all other export products, developed relatively slowly until the 1860s, as erratic prices and the dominance of the slave trade kept merchants and entrepreneurs from investing in new commercial ventures and forms of labour employment.Footnote 34
Coffee cultivation was concentrated in the districts of Cazengo, Golungo, Ambaca, and Encoge, whose montane forests were the bedrock of West Central Africa's original coffee belt. While a small trade from these regions started to blossom in the 1830s, planting and cultivating semiwild stands accelerated in the 1850s, when the region of Cazengo alone contained about half a million cultivated stands.Footnote 35 Based on this expansion, Angolan customs registered sales of more than 1,000 metric tons in the early 1860s, while annual exports surpassed 2,000 tons a decade later, making coffee Angola's most valuable colonial product and Angola the leading coffee exporter in the continent.Footnote 36 Ivory, beeswax, orchil lichen, gum copal, palm oil, and peanuts also figured prominently in the early stages of the new commodity trade, but most of these products were extracted from natural resources rather than cultivated. Moreover, unlike coffee, they often originated from parts of the Angolan hinterland outside the purview of the colonial government, which complicates the use of official population counts to assess the role of slavery in their production.Footnote 37
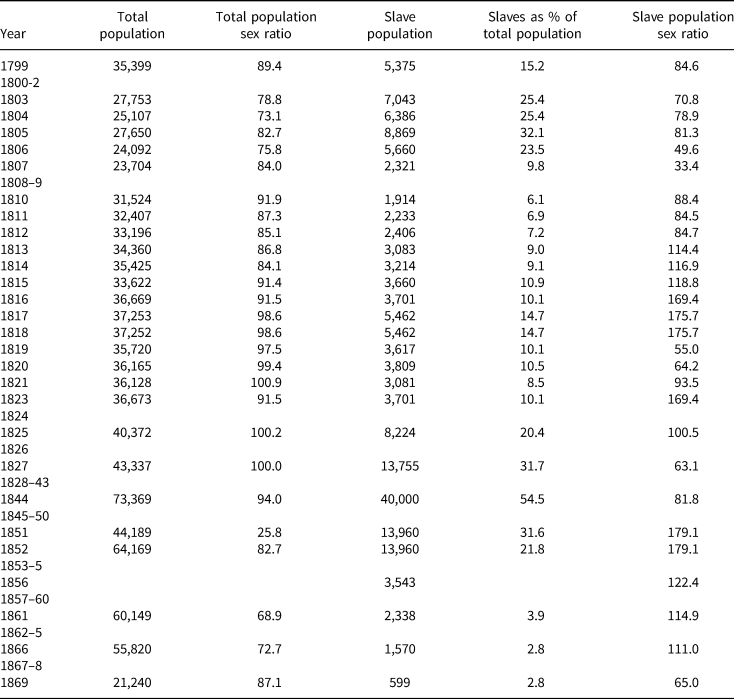
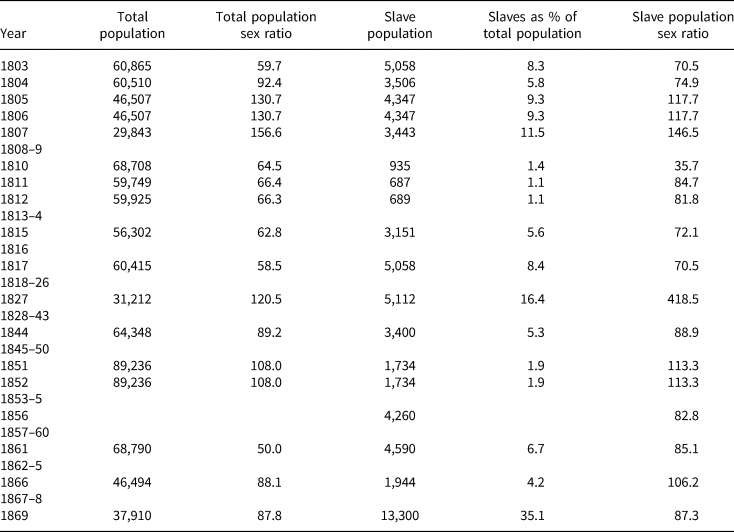
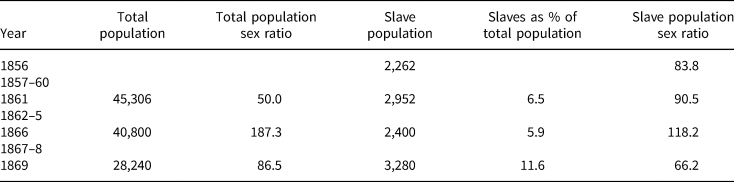
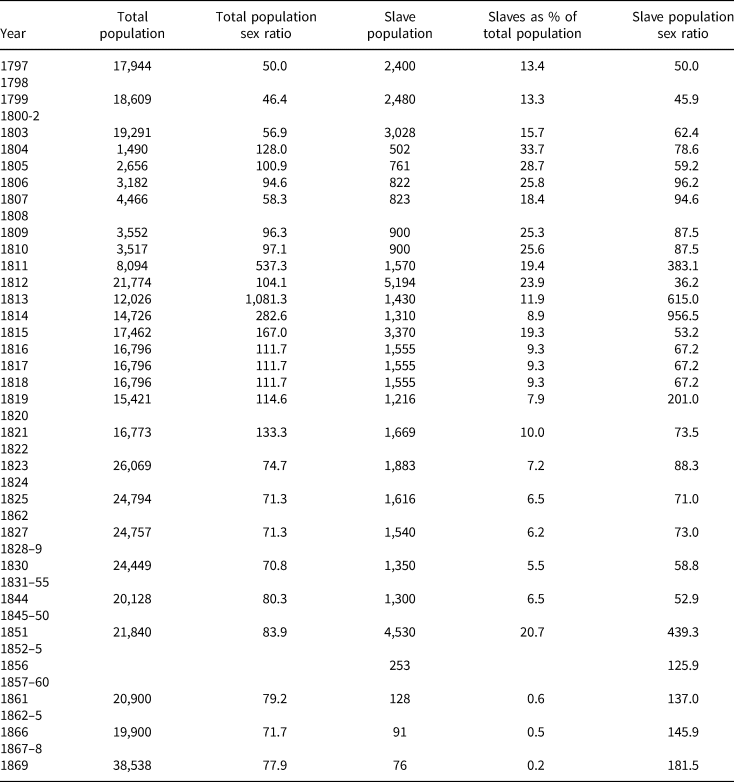
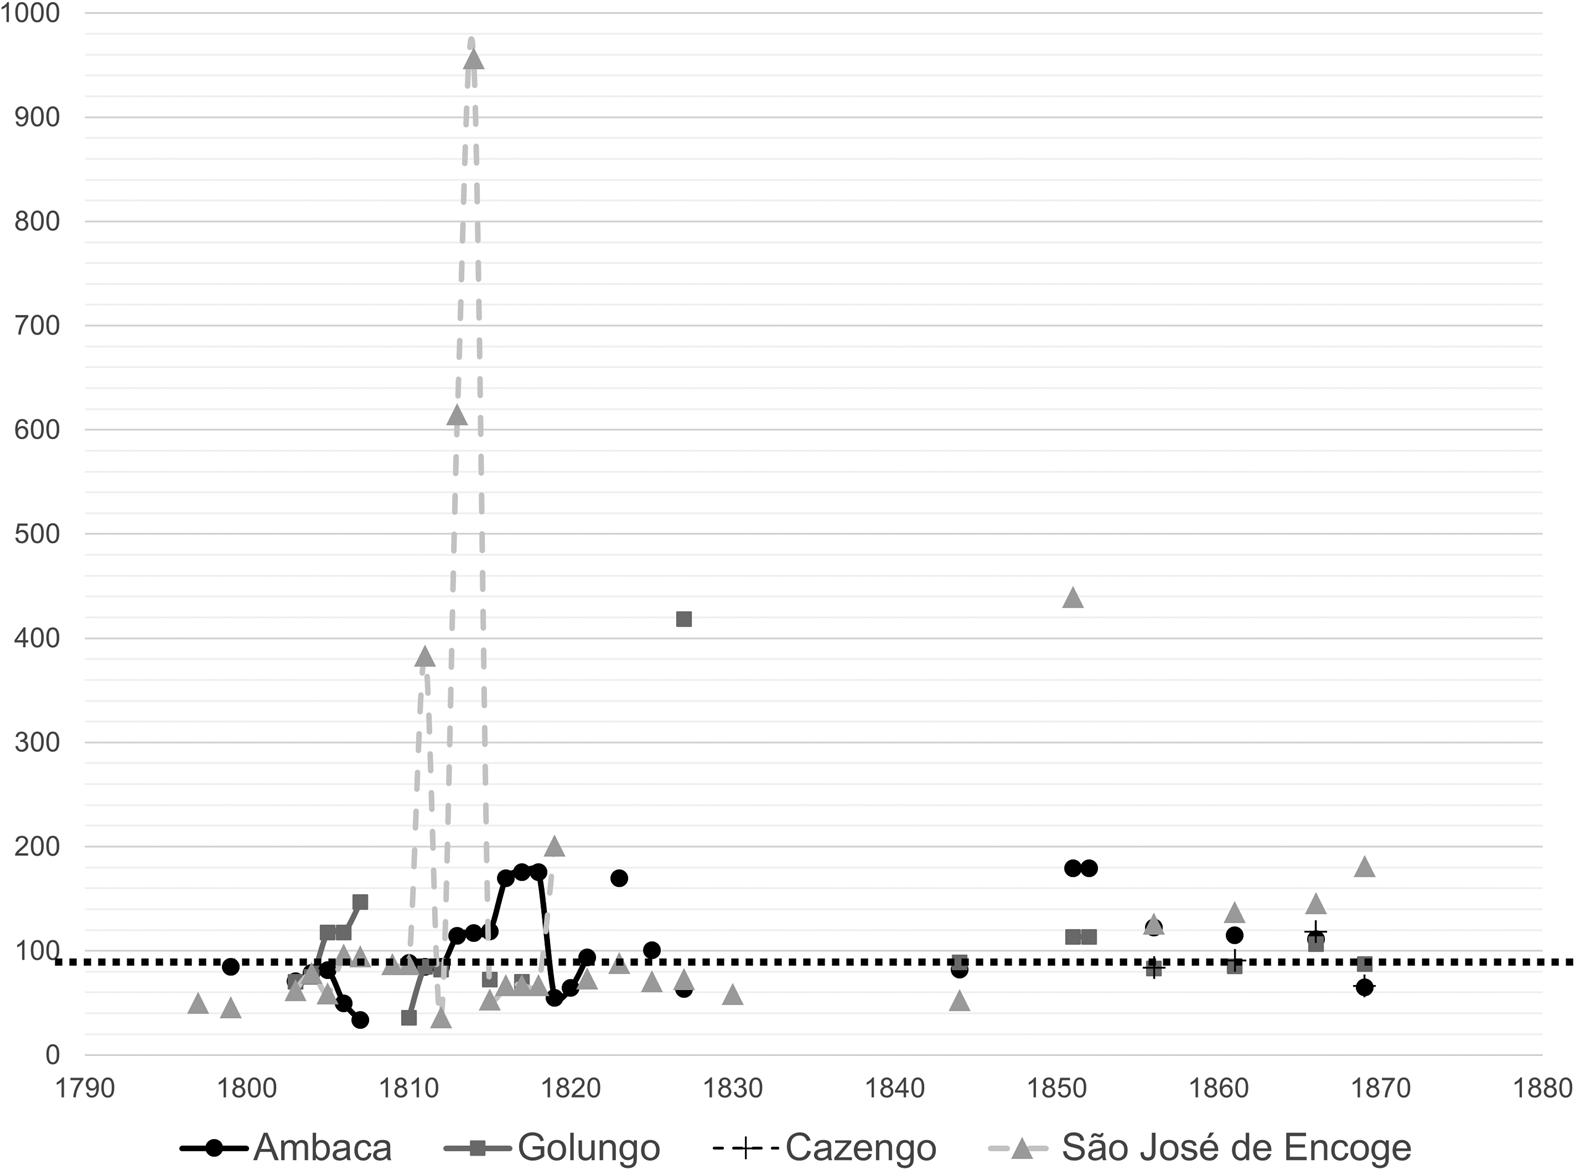
This article incorporates population tables for all four districts under discussion, indicating per year the size of the captive population, both in absolute numbers and as a percentage of the total population, as well as the ratio of male to female enslaved. The years from 1797 to 1830 are comparatively well covered, but there is a gap in the data for the 1830s and 1840s, and coverage after 1850 is uneven. The well-known figures published by Lopes de Lima in 1846, which according to José Curto were based on census materials carried to Portugal by the Angolan governor Germack Possollo the year before, can fill part of this gap despite lingering uncertainty about their source.Footnote 38 In 1861 libertos appeared as a new category in the tables. Portugal enshrined the condition of liberto in colonial law in 1854 to designate freed people, who despite their new legal status were forced to work for their former owners or the colonial state for an indefinite length of time.Footnote 39 By 1869 slavery was legally abolished in the Portuguese Empire, and so libertos officially replaced the slave population of Angola. Since they were de facto enslaved, however, we have included them in our counts of captive people.
The population counts at district level included all African chiefs allied to the Portuguese government, colonial residents known as moradores (most of whom were locally born Luso-Africans), and the subjects of the chiefs and moradores. Responsibility for the annual survey usually lay with the local Portuguese authority, the capitão-mor, who could use the counts for tax and labour recruitment purposes.Footnote 40 The capitão-mor asked chiefs and moradores how many enslaved people they owned.Footnote 41 Faced with the impossibility of counting everyone individually, however, he generally estimated district totals based on the total number of villages in his district or a small sample of the population.Footnote 42 As the French traveller Jean-Baptiste Douville observed in Golungo in 1829, the census taker there asked all chiefs for the number of homes (fogos) in their area, which, multiplied by three, gave an estimate of the total population in the district.Footnote 43 The government in Luanda often apologised to Lisbon for such crude ways of counting, although one governor astutely remarked that even in the ‘civilised countries of Europe’ population sizes were often calculated by approximation.Footnote 44 Besides technical difficulties, census takers also encountered resistance. Chiefs sometimes refused to collaborate with the census, as they feared the Portuguese would steal their subjects, or they undercounted to reduce the number of men the government could lawfully request for transport or military service. Ambaca residents hid their enslaved subjects in 1797 to diminish the value of their property, leaving the capitão-mor clueless about the dimensions of the local slave population.Footnote 45 These flaws can make the colonial surveys unreliable sources for estimating total population sizes. But, if risks of exclusion are relatively consistent, they can still be useful for analysing demographic structures, specifically sex ratios and the ratio of enslaved versus free individuals.Footnote 46 For this reason, we use percentages as well as absolute numbers to indicate changes in the structure of slavery in the Angolan hinterland.
It should also be noted that the data reproduced in our tables present some extraordinary fluctuations and curious extrapolations. For example, the numbers from Golungo are the same in 1805 and 1806, which the local administrator explained by pointing to difficulties in obtaining data for the latter year.Footnote 47 Large differences between one year and the next might raise the suspicion of poor counting but often reflected historical realities. According to Jill Dias, droughts, famines, epidemic diseases, and the migration flows resulting from such natural hazards could cause rapid depopulation in some regions of Angola, while neighbouring districts often benefited from incorporating hungry migrants as clients or slaves.Footnote 48 In 1805, for instance, the population of Golungo was down by 14,000 from the year before because, so the administrator argued, ‘some people died, others left [the region] to work in the caravan trade, while the rest escaped to the neighbouring Mahungos and Dembos’ to avoid colonial taxation.Footnote 49 To give another example, in 1819 it was reported that 1,412 people moved back from Dande to their homes in Zenza e Quilengues do Golungo, which they had left in 1806 because of a local famine.Footnote 50 Administrative reorganisations as well as changes in Portugal's alliances with African chiefs further affected population counts in the interior. From 1810 to 1811, for instance, the number of inhabitants in Golungo dropped again as the subdivisions of Zenza and Dembos became separate jurisdictions.Footnote 51 Moreover, as will be discussed below, the continuous influx and departure of captives also contributed to fluctuations in total population sizes.Footnote 52 Observations added to the annual surveys, like the ones cited here, suggest that many local administrators were conscientious census takers who did not create numbers out of the blue to please their superiors in Luanda. To reflect the richness and complexity of the available data, our tables (see Tables 1–4 in the Appendix) show individual years, without eliminating outliers or smoothing data by grouping them in multiyear intervals.
The transformation of slavery in Angola
In 2005, the eminent historian of Central Africa, Jan Vansina, published an article in this journal which analysed the impact of the Atlantic slave trade on social relations in the colonial district of Ambaca.Footnote 53 Like São José de Encoge, examined below, Ambaca was a presídio, a fortified settlement with its own military force, established in the middle of the eighteenth century to control the slave trade between Angola's deep interior and the Atlantic coast. With these two colonial settlements, Portugal specifically aimed to protect its dominance in African slave markets like Ambuila and Cassange from the influence of northern European traders operating north of the Congo River.Footnote 54 During the eighteenth and nineteenth centuries, Ambaca was one of the key hubs in the Angolan slave trade. Every year thousands of captives passed through Ambaca on their way to Luanda and Brazil, while caravans going in the opposite direction carried vast amounts of imported commodities to markets deeper inland. Although Vansina's study of this process is more complex than our summary suggests, his assessment of its impact on the size and composition of the local slave population is clear. ‘When the slave trade ended, slightly less than half the population was still free . . . Moreover, the sex ratio had become quite unbalanced’, which ‘probably resulted in large part from the acquisition of female slaves abroad’.Footnote 55 Vansina based this claim on the census material published by Lopes de Lima in 1846, which indeed showed a high incidence of enslavement with a strong female bias. The labour of enslaved women was especially important for the cultivation of manioc and cereal crops, which were grown to feed the trade caravans and supply flour and grain to nearby markets. This emphasis on female captives underscores the idea that slave owners in Africa generally preferred women to men, mainly because of their centrality in agricultural production.Footnote 56 Although Vansina did not use other population data for comparison over time, the tenor of his argument is in keeping with the transformation thesis: Ambaca became a ‘slave society’ with a notable gender imbalance through its integration into the global economy.
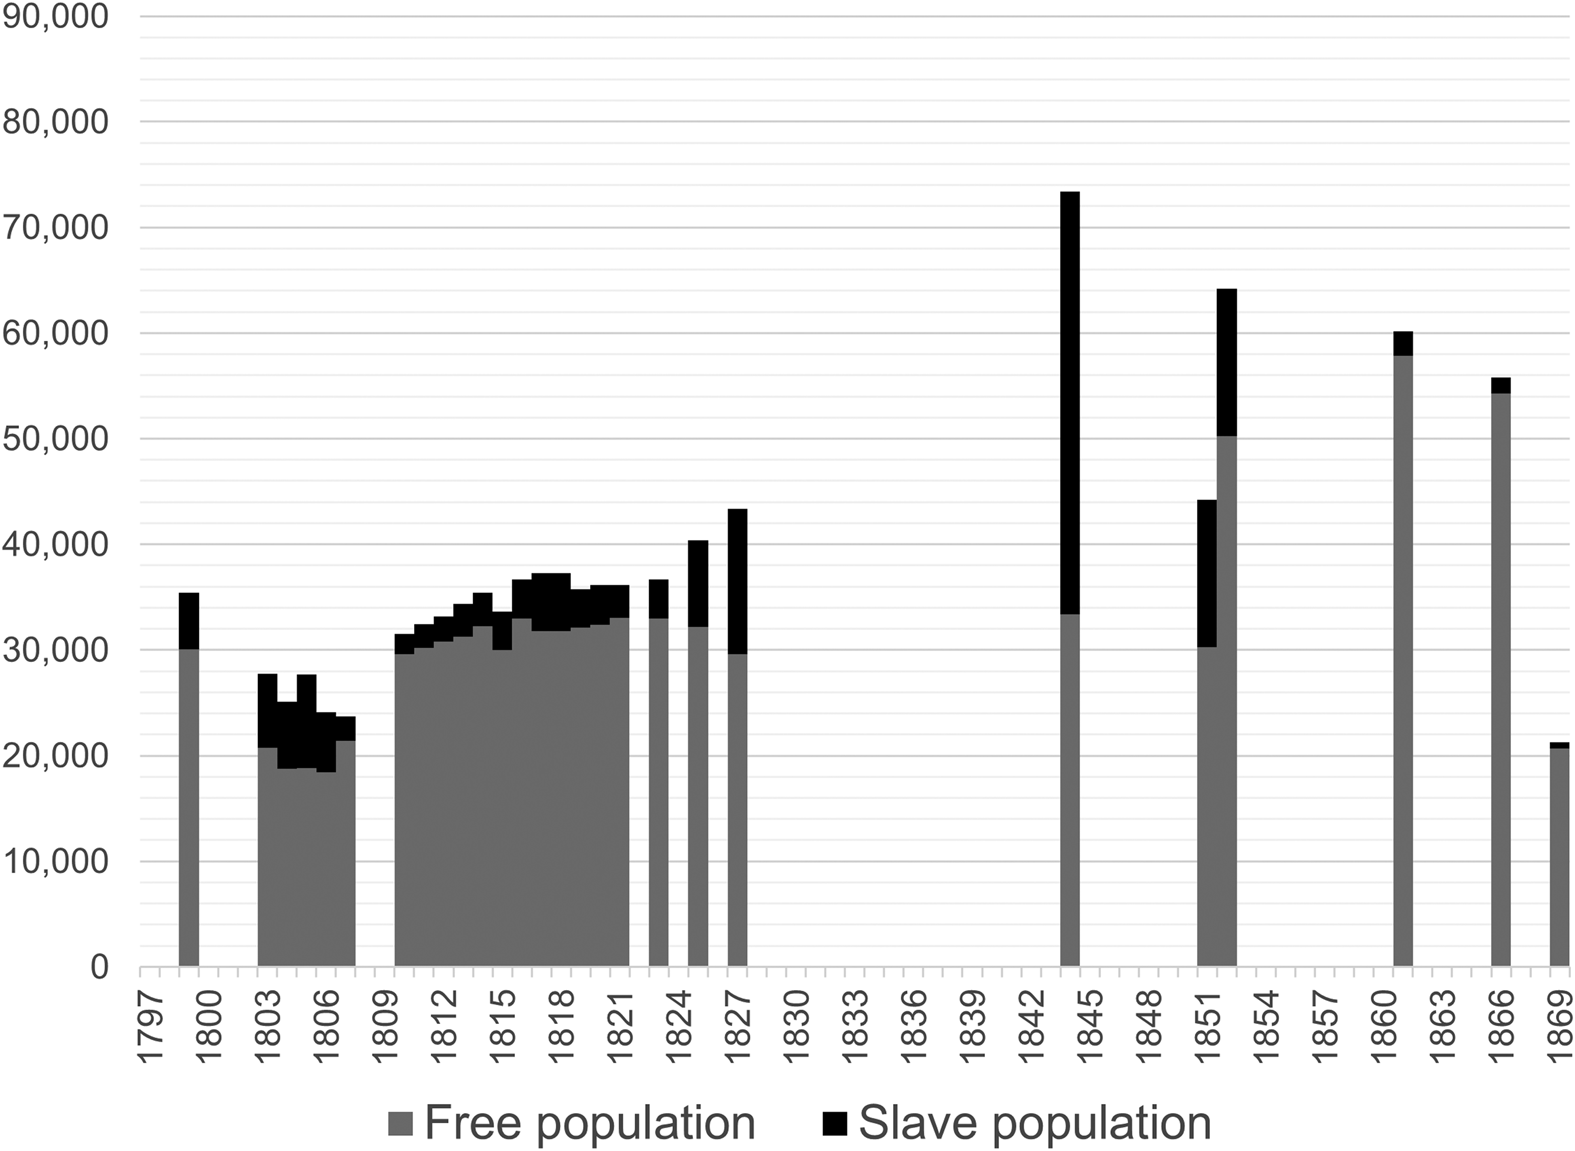
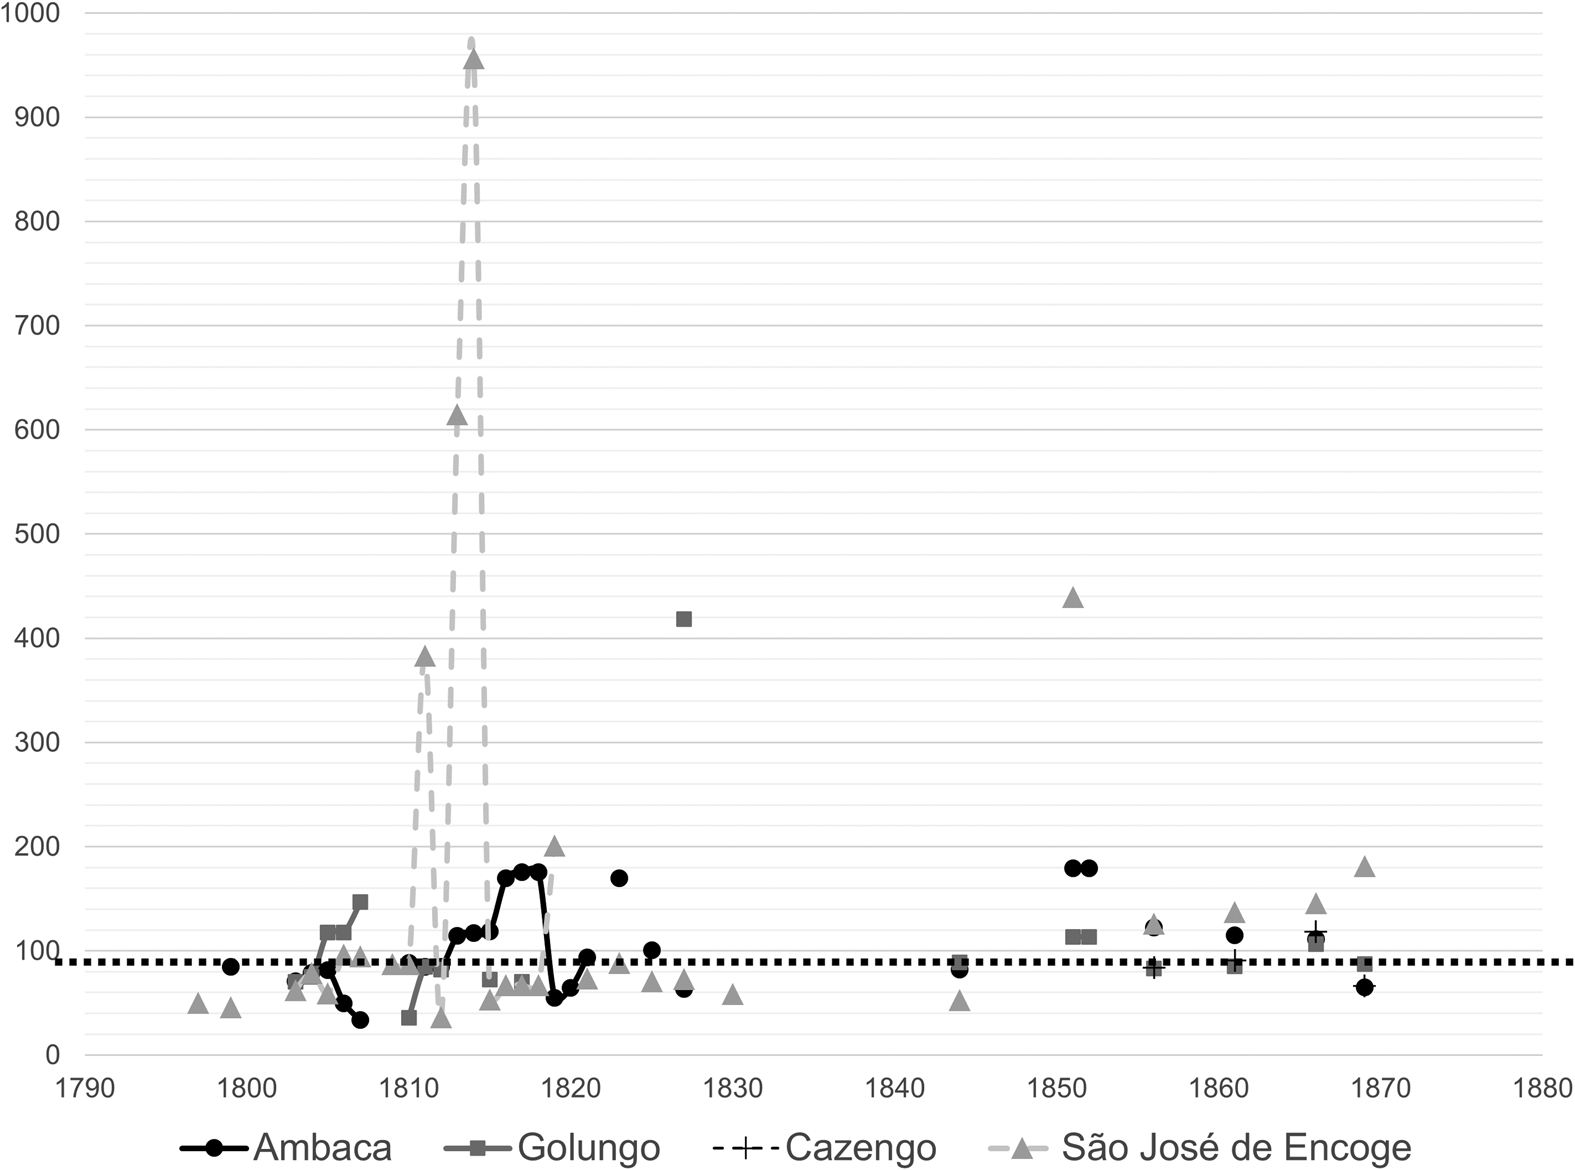
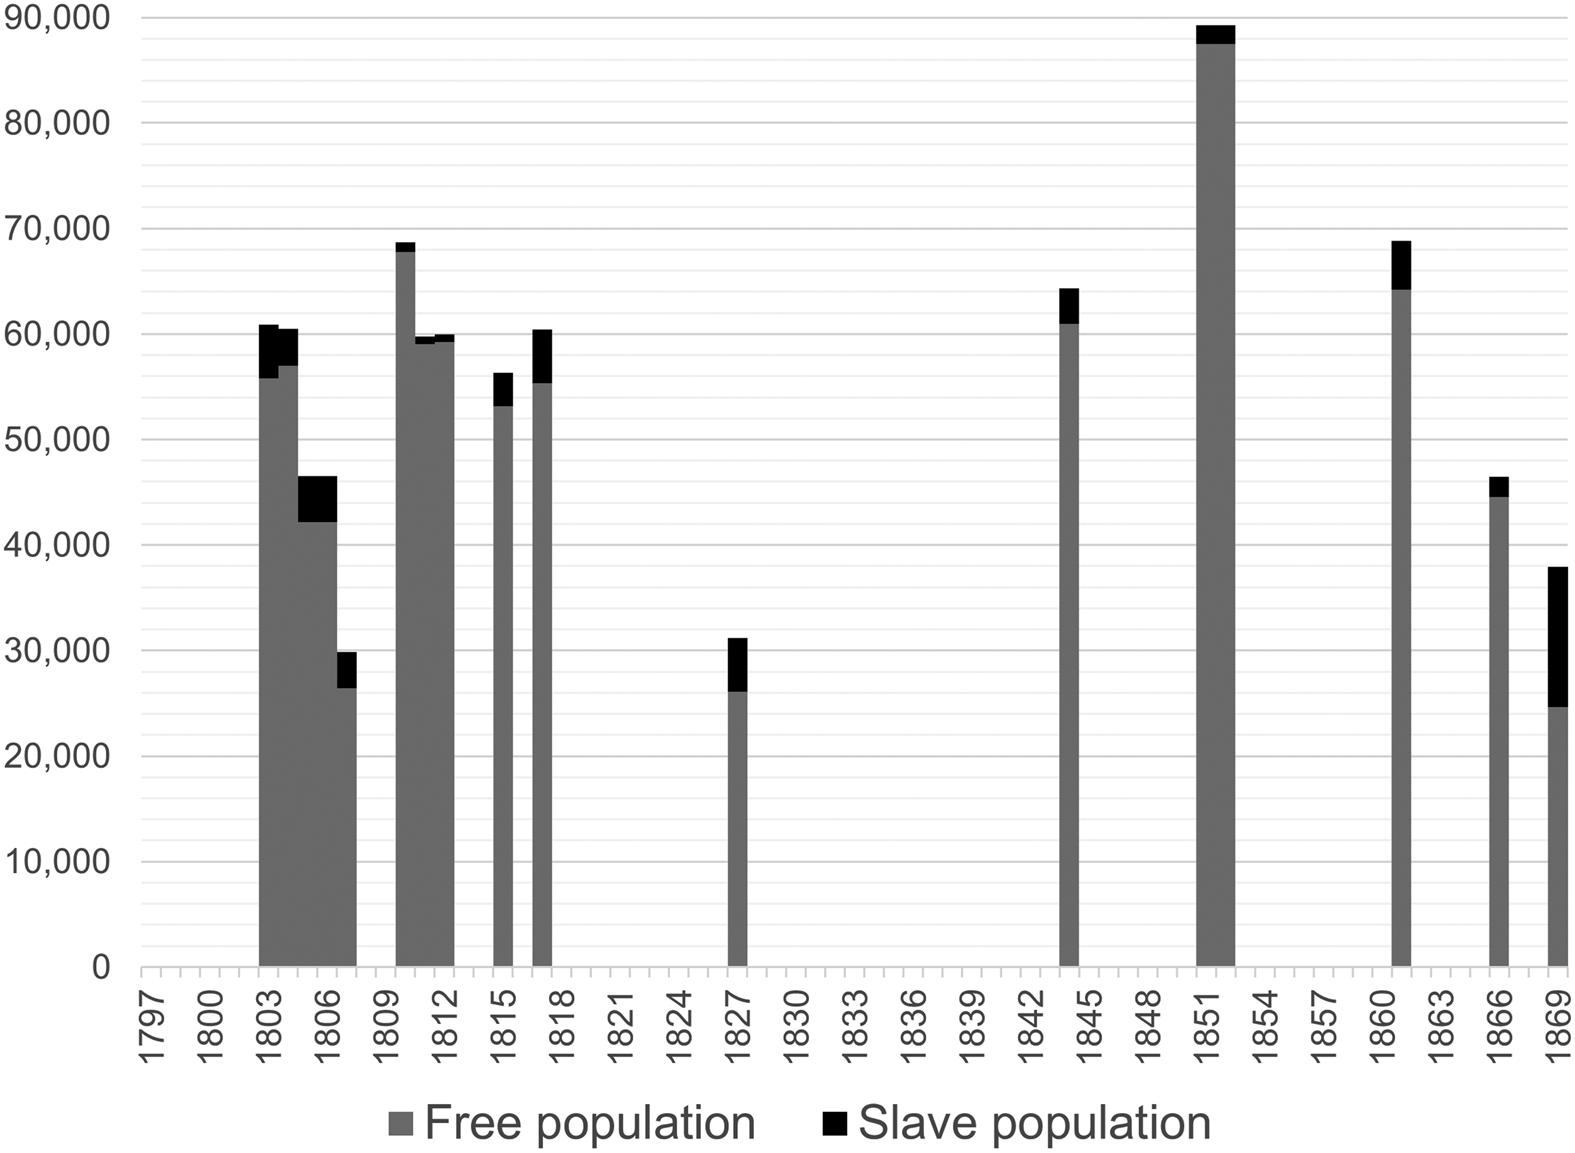
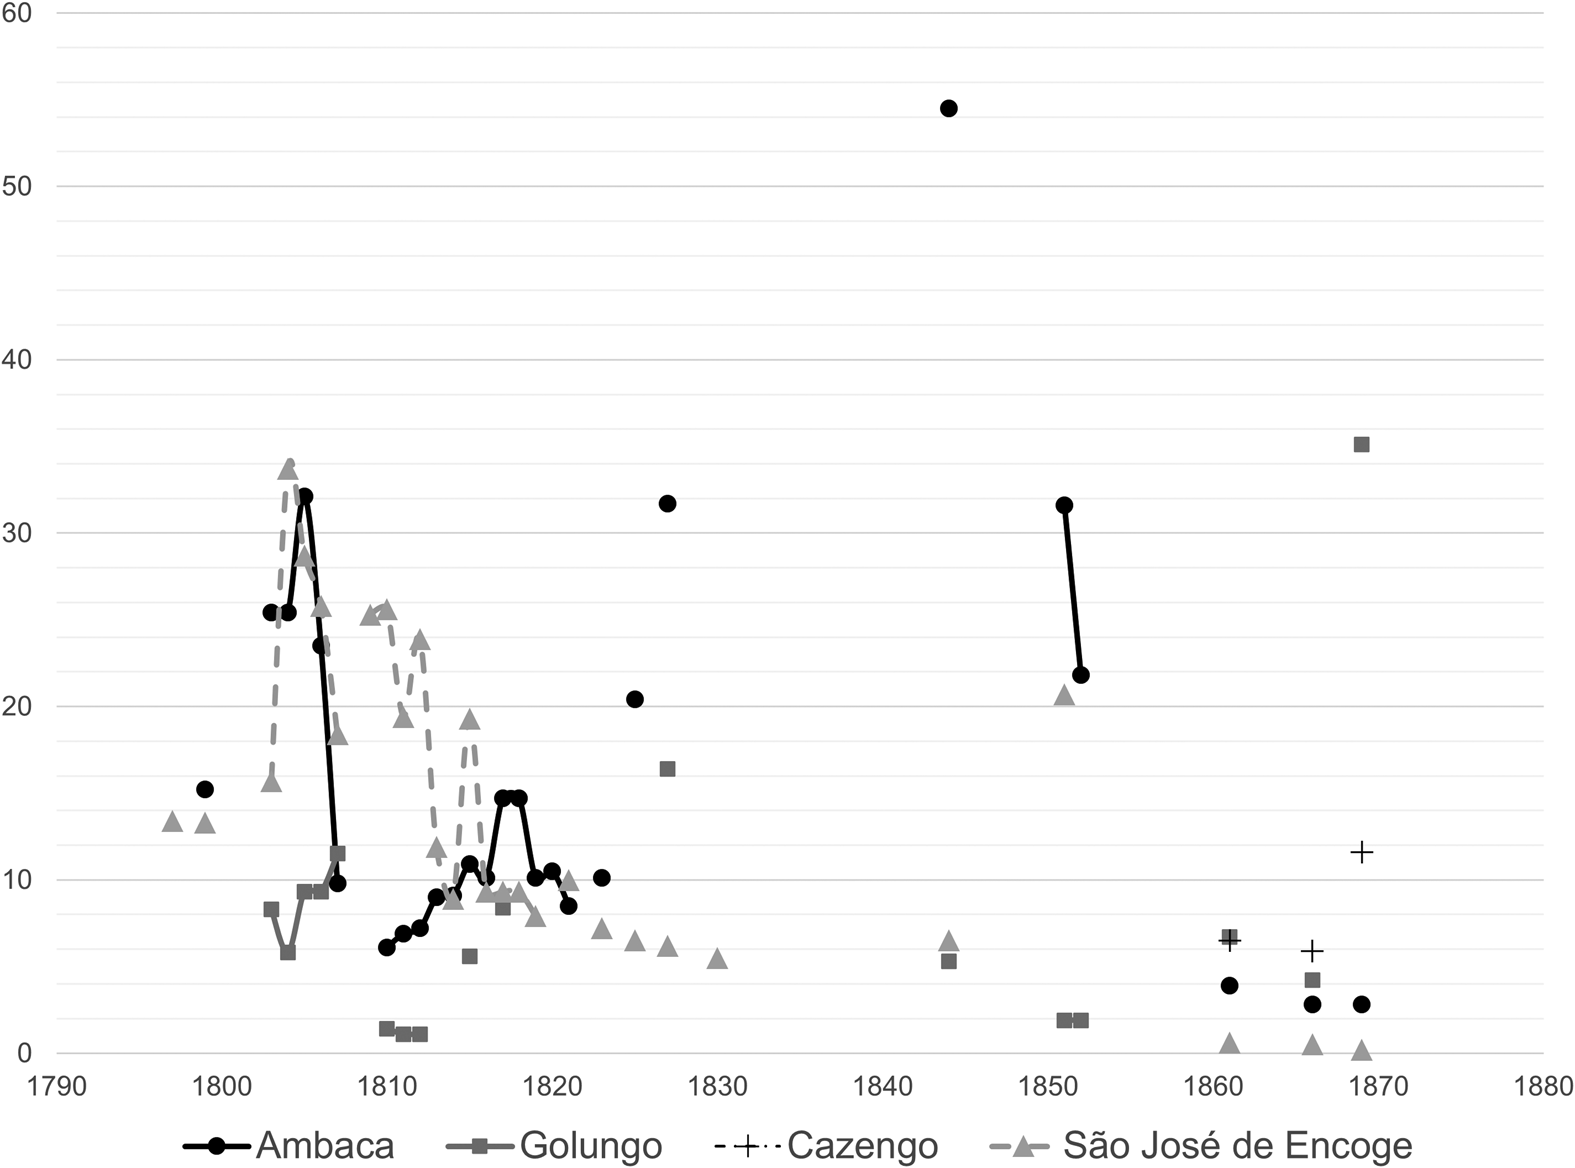
Any assumption that slavery expanded in Ambaca during the last phase of the export slave trade is complicated by the absence of an earlier benchmark figure, which makes it impossible to know what proportion of the population was enslaved in a previous era. But our data series for the nineteenth century at least makes it possible to discern trends in a period of increased slaving. The available data do not unambiguously support the idea that Ambaca was becoming a slave society (Fig. 3). Between 1803 and 1806 at least a quarter of the district's inhabitants were enslaved. But the captive population was comparatively small from 1807 to 1823, before expanding again in the period up to 1851. Thus, in a period when exports of enslaved Africans from Luanda, the main terminal of the Ambaca trade, were generally high, the size of Ambaca's captive population was depressed for almost two decades — a scenario that runs counter to the transformation thesis.Footnote 57 Moreover, it is not at all evident that slave owners in Ambaca were mainly interested in female captives (Fig. 4). Although women were predominant in most years for which records exist, on average the male-female ratio of the enslaved population was 105, much higher than the average of 86 for the total population of Ambaca between 1799 and 1869. If there was a gender bias in the enslaved population, it might have been a male one.Footnote 58
Population of Ambaca, 1799–1869.
Source: Counting Colonial Populations, accessed 1 Apr. 2021. The database contains reproductions of population tables for Ambaca from the following archival sources: AHU CU Angola Cx 89, doc. 88 [1799]; Cx 109, doc. 37 [1803]; Cx 112, doc. 47 [1804]; Cx 115, doc. 28 [1805]; Cx 118, doc. 49 [1806]; Cx 119, doc. 6 [1807]; Cx 122, doc. 21 [1810]; Cx 124, doc. 9 [1811]; Cx 128, doc. 26 [1813]; Cx 130, doc. 30 [1814]; Cx 131, doc. 14 [1815]; Cx 132, doc. 32 [1816]; Cx 134, doc. 37 [1817]; Cx 136, doc. 19 [1818]; Cx 138, doc. 17 [1819]; Cx 139, doc. 85 [1820]; Cx 144, doc. 92 [1823]; Cx 141, doc. 49 [1825]; Cx 156, doc. 16 [1827]. Additionally, the website references the following sources without providing reproductions: AHU CU Angola, Cx 127, doc. 1 [1812]; AHM, 2ª Divisão, 2ª Secção, Angola, Cx 1, doc. 19 [1821]; J. J. L. de Lima, Ensaios sobre a statística das possessões portuguezas, Volume III, Part I (Lisboa, 1846), 4-A [1844]; Almanak estatístico da província de Angola e suas dependências para o ano de 1852, Volume I (Luanda, 1852), 8 [1851]; Almanach de Portugal para o anno de 1855 (Lisboa, 1854–5), 78–9 [1852]; Diário do Governo (hereafter DG), 145 (1856), 854 [1856]; Boletim do Governo de Angola (hereafter BOA), 27–8 (1863), 218–19, 226 [1861]; BOA, 7 (1867), 76–7 [1866]; BOA, 42 (1870), 596–7 [1869].

Population of Golungo, 1803–69.
Source: Counting Colonial Populations, accessed 1 Apr. 2021. The database contains reproductions of population tables for Golungo from the following archival sources: AHU CU Angola, Cx 109, doc. 37 [1803]; Cx 112, doc. 47 [1804]; Cx 115, doc. 28 [1805]; Cx 122, doc. 21 [1810]; Cx 124, doc. 9 [1811]; Cx 127, doc. 1 [1812]; Cx 131, doc. 14 [1815]; Cx 134, doc. 37 [1817]; Cx 156, doc. 16 [1827]. Additionally, the website references the following sources without providing reproductions: AHU CU Angola, Cx 118, doc. 49 [1806]; Cx 119, doc. 6 [1807]; Lima, Ensaios, 4-A [1844]; Almanak estatístico, 8 [1851]; Almanach de Portugal, 78–9 [1852]; DG, 145 (1856), 854 [1856]; BOA, 27–8 (1863), 218–9, 226 [1861]; BOA, 7 (1867), 76–7 [1866]; BOA, 42 (1870), 596–7 [1869].

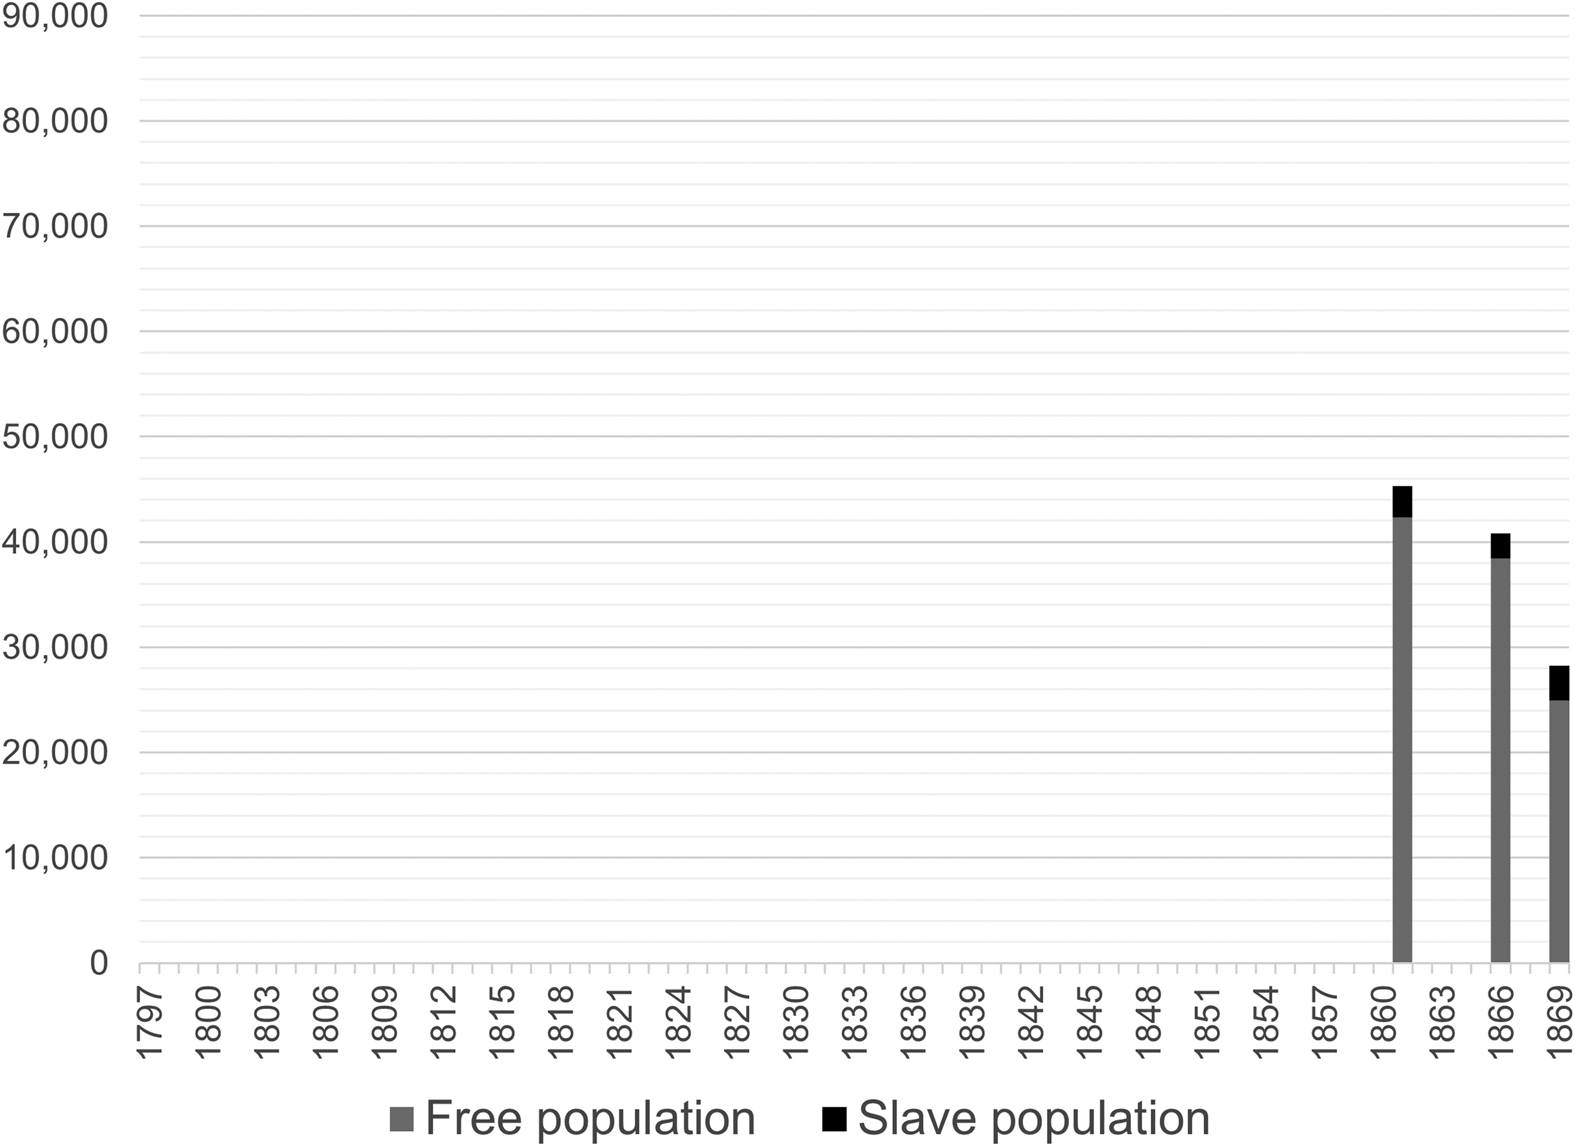
Population of Cazengo, 1861–9.
Source: DG, 145 (1856), 854 [1856]; BOA, 27–8 (1863), 218–9, 226 [1861]; BOA, 7 (1867), 76–7 [1866]; BOA, 42 (1870), 596–7 [1869].

It is worth noting that in other parts of Angola the female bias in slave populations was, at least in this period, not as pronounced as often thought. In the urban economies of Luanda and Benguela, for example, or in the Caconda presídio in the central highlands, slavery was more noticeable than it was in Ambaca, but the sex ratios in these captive populations were still close to equal.Footnote 59 There are several possible explanations for these even sex ratios. First, they could have resulted from natural reproduction, which would have evened out significant gender imbalances. But this is an unlikely scenario given the demographic fluctuations observed in the data and the fact that the presídios incorporated many captives who had been enslaved elsewhere. A more convincing explanation would look at what slave owners needed people for. In Ambaca and other interior districts, enslaved people worked not only in agriculture, which was historically associated with female labour, but also in male-dominated trade expeditions and craft industries.Footnote 60 Finally, it must be remembered that for new arrivals Ambaca was often a station on the way to the coast, which brings us to the practice of warehousing.
The rapid expansion and depletion of the slave population repeatedly seen in the census data suggest that owners were very likely storing captives in Ambaca before sending them on to Luanda. Evidence from São José de Encoge, presented below, supports this view. Buyers in Luanda purchased on average two enslaved males for every enslaved female, which, with the interposition of warehousing as a factor, explains the unexpectedly strong male presence in Ambaca's slave population. Many of these captives undoubtedly provided labour to the local economy during their time in transit. In West Africa, as Stephen Behrendt has pointed out, slave owners often employed captives in agriculture during periods of high labour demand, selling them to buyers on the coast when their input was no longer needed.Footnote 61 Warehousing would also explain why Ambaca's captive population decreased so rapidly after the closing of the Brazilian market in 1850. Once Angola stopped exporting enslaved workers to Brazil, there was less need to hold people captive in transport hubs like Ambaca.Footnote 62 In short, Ambaca's transformation into a slave society, if it happened at all, remained incomplete as it depended on the district's role as a distribution centre in the Angolan slave trade.
Immediately west of Ambaca, Golungo and Cazengo were two of the most commercialised agrarian districts in Angola in the mid-nineteenth century. Here, in the 1830s, African smallholders and Portuguese planters began to cultivate Angola's first successful export crop, coffee, the production of which expanded rapidly when the Angolan slave trade to Cuba closed in the 1860s. Scholars like David Birmingham, Aida Freudenthal, and Roquinaldo Ferreira have underlined the importance of slave labour in these new agricultural ventures, supporting Lovejoy's use of Cazengo as an illustration of his argument that a new kind of plantation slavery developed in Portugal's protocolonial enclaves in western Africa.Footnote 63 Against this background, Angola's historical coffee belt is a textbook case for examining the transformation thesis.
Demographic data from Golungo (Fig. 5) and Cazengo (Fig. 6) suggest that, at least initially in these two districts, there was a correlation between slavery and the agrarian transition. In the era of the transatlantic slave trade, which lasted until 1867, the captive population of Golungo and Cazengo fluctuated in size and proportion, but rarely made up more than 10 per cent of the total population (Fig. 7). As in Ambaca, slave owners did not seem to have a strong or consistent preference for female captives. In fact, with an average sex ratio of 110, men outweighed women in the slave population of Golungo between 1803 and 1869 (the overall sex ratio in the district was 91). During the suppression of the slave trade to Brazil and Cuba after 1850, the number of enslaved people in Golungo and Cazengo initially declined. But in the late 1860s slavery became more dominant. Responding to a rally in world coffee prices, planters in both regions expanded production by adding privately purchased slaves and publicly provisioned libertos to their workforce, with the larger estates employing between 200 and 400 enslaved workers. In 1866, Albino José Soares, owner of the plantation Prototypo in Cazengo, even planned to purchase 1,000 captives to strengthen his labour force.Footnote 64 Interestingly, the people enslaved in this period were predominantly women, reflecting a preference for female labour in the coffee sector.

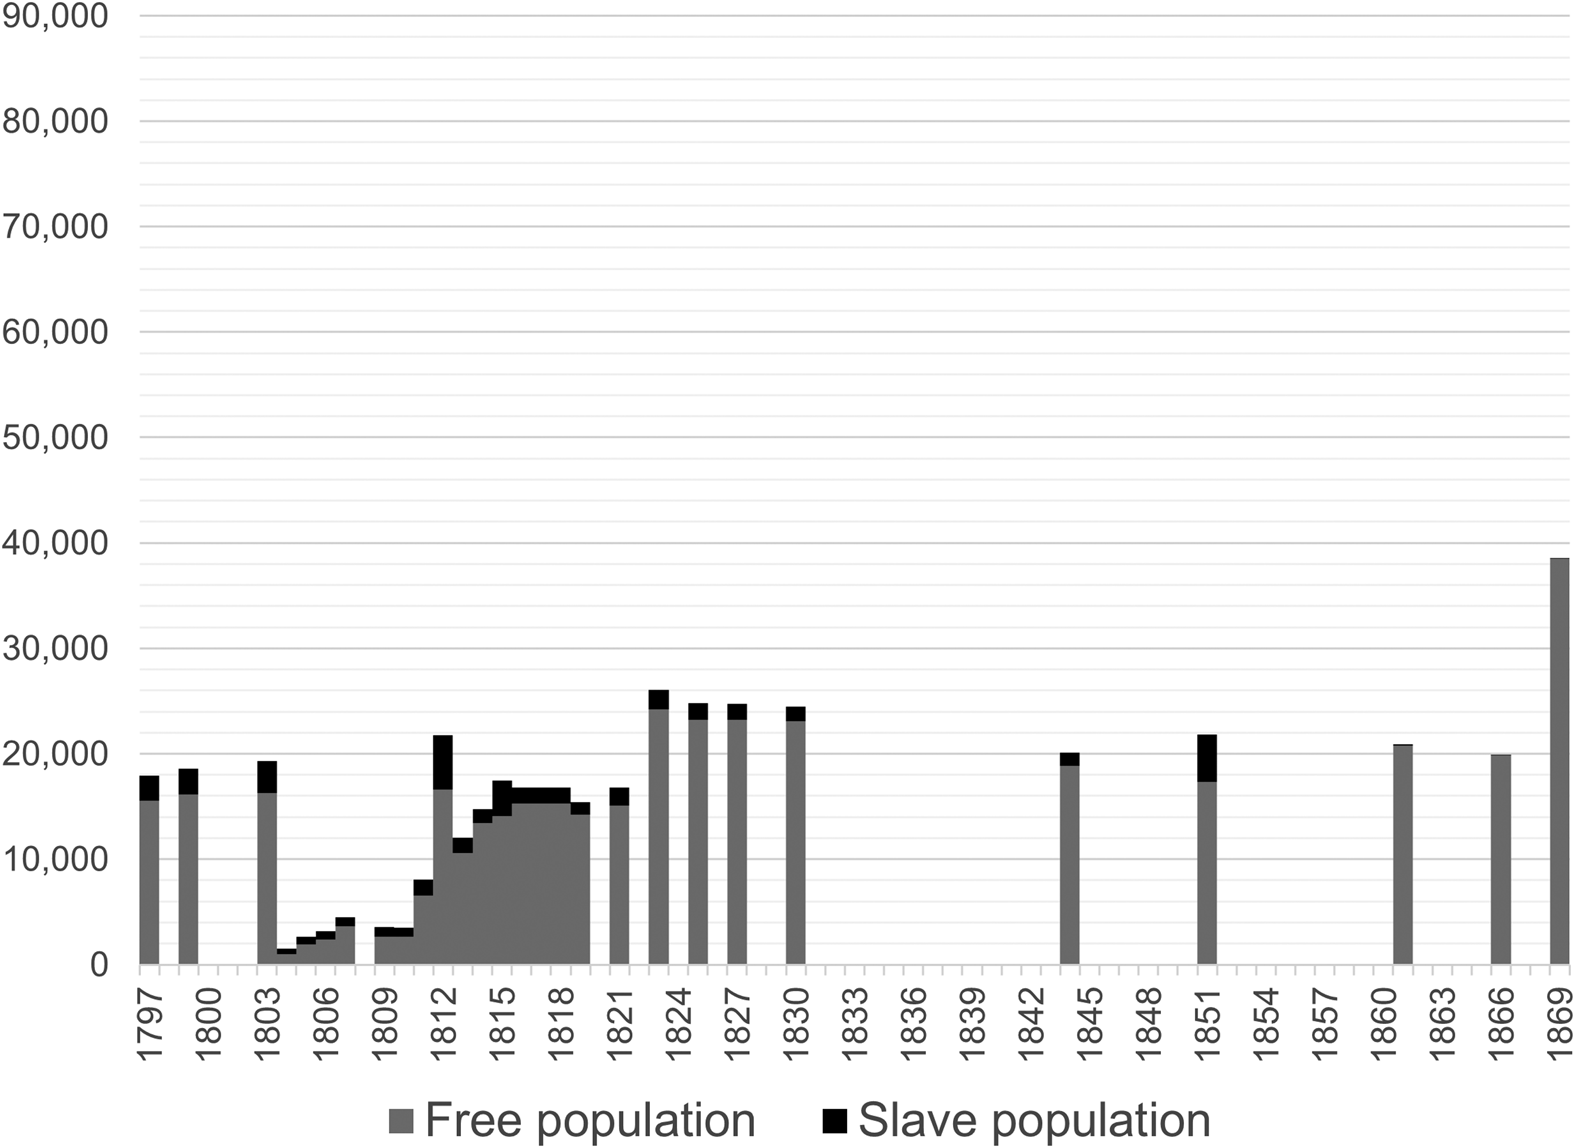
Population of São José de Encoge, 1797–1869.
Source: Counting Colonial Populations, accessed 1 Apr. 2021. The database contains reproductions of population tables for São José de Encoge from the following archival sources: AHU CU Angola, Cx 86, doc. 76 [1797]; Cx 93A, doc. 55 [1799]; Cx 109, doc. 37 [1803]; Cx 112, doc. 47 [1804]; Cx 115, doc. 28 [1805]; Cx 118, doc. 49 [1806]; Cx 119, doc. 6 [1807]; Cx 121, doc. 32 [1809]; Cx 122, doc. 21 [1810]; Cx 124, doc. 9 [1811]; Cx 127, doc. 1 [1812]; Cx 128, doc. 26 [1813]; Cx 130, doc. 30 [1814]; Cx 131, doc. 14 [1815]; Cx 132, doc. 32 [1816]; Cx 134, doc. 37 [1817]; Cx 136, doc. 19 [1818]; Cx 138, doc. 17 [1819]; Cx 168, doc. 2 [1823]; Cx 141, doc. 49 [1825]; Cx 156, doc. 16 [1827]; Cx 168, doc. 2 [1830]. Additionally, the website references the following sources without providing reproductions: AHM, 2ª Divisão, 2ª Secção, Angola, Cx 1, doc. 22 [1821]; Lima, Ensaios, 4-A [1844]; Almanak estatístico, 8 [1851]; DG, 145 (1856), 854 [1856]; BOA, 27–8 (1863), 218–19, 226 [1861]; BOA, 7 (1867), 76–7 [1866]; BOA, 42 (1870), 596–7 [1869].

The growth of the captive population registered in Golungo and Cazengo points to a diversion of labour supplies towards coffee and other agrarian sectors in Angola. But this does not directly prove that enslaved workers previously shipped to Brazil were being retained in the country to support the development of commercial agriculture, as the transformation thesis implies. As the total number of people enslaved in Angola more than doubled to 66,000 between 1849 and 1856, ‘slavery eventually became the cornerstone of labour relations in commercial agriculture’, according to Ferreira. But a concurrent decline in slave prices, also noted by Ferreira, suggests that the closure of the slave trade to Brazil provided the internal market with more captives than it could accommodate.Footnote 65 Through much of the 1850s and 1860s, commodity production remained sluggish in Angola, inducing some slave owners to ship their human property illegally to São Tomé, where demand and prices for slaves were higher, while the slave trade to Cuba also gained pace.Footnote 66 The number of officially registered enslaved and libertos dropped to 42,000 by 1866, although three years later it was back up at 65,000, with the largest number of libertos employed in the rural districts of Icolo e Bengo, Golungo, Cazengo, Pungo Andongo, Dombe Grande, Quilengues, and Mossâmedes. The closure of the illegal slave trade to Cuba freed up some labour supplies, but the main factor behind these growing numbers was the expansion of cash crop production in the late 1860s, which in these colonial enclaves depended to a significant degree on slavery.Footnote 67 It is worth emphasising, however, that by 1895, at the peak of the first Angolan coffee boom, the number of workers trapped on the Cazengo coffee plantations had only grown to 3,798, from 3,280 in 1869, whereas Angolan coffee production had increased about tenfold in this period.Footnote 68 The expansion of coffee cultivation in the intervening years was mainly driven by independent African smallholders, notably in the region around Encoge, not the slave-based estate sector.
The data from Ambaca and Encoge call for more caution in associating the end of the slave trade with an expansion in slavery. They suggest that, at least in some Angolan regions, slavery was on a downward trajectory instead of an upward one. After 1851, the number of enslaved people in Ambaca dropped sharply, contradicting the scenario that captives previously exported overseas were kept and put to work in local economies. Ambaca was part of the early Angolan coffee belt, but before the twentieth century, it barely attracted settlers of the estate-building kind. A visitor in 1846 noted that the local district officer kept a few young coffee trees near his residence, but that the old moradores mainly cultivated food crops to sell in local markets. Ambaca's economy was turning increasingly to supporting the caravan trade in wax and ivory, for which the officer drafted carriers from the nominally ‘free’ population.Footnote 69 Demographic data (Fig. 3) suggest that, from the mid-nineteenth century, large slave estates played an insignificant role in provisioning this caravan trade or in food and cash crop production generally.
The district of São José de Encoge, situated north of Ambaca, experienced an almost identical collapse of its slave population (Fig. 8). Encoge was a crucial node in the Angolan slave trade to Luanda and, from the 1820s, the nub of the colony's emerging coffee economy. From the late eighteenth century, enslaved people constantly made up a significant part of the district's population, with a sex ratio biased in most years towards women (Fig. 4). But after 1851, their number declined dramatically, which brings us back to the practice of warehousing. Like Ambaca, Encoge was an entrepôt where dealers kept people in captivity before dispatching them to the coast. In 1804, 1805, 1806, and 1807, for instance, the local administrator registered the transfer of respectively 379, 548, 900, and 986 captives to Luanda.Footnote 70 The records for 1817, 1818, 1821, 1823, and 1825 refer to movements of respectively 1,084, 1,232, 907, 758, and 597 captives.Footnote 71 These losses were usually compensated by the influx of new arrivals. When the Brazilian market closed in the 1850s, however, the practice of warehousing captives in the interior disappeared. Most captives were very likely sold to other parts of Angola, notably Luanda, where a growing urban economy was absorbing increasing numbers of enslaved workers, as the moradores of Encoge reduced their own labour reservoirs.Footnote 72
Remarkably few captives, it appears, were redeployed in the local coffee economy. More than in Golungo and Cazengo, African smallholders drove the expansion of cash crop agriculture in Encoge, as the region's location deeper inland kept foreign settlers at bay. The small number of enslaved people in the population during this transitional period suggests that these farmers, who initially included several moradores, were not overly dependent on coerced labour. An 1856 register of slave owners (senhores) in Angola indicates that by this time Encoge only counted nineteen senhores, who owned no more than 253 enslaved people (13.3 slaves per owner) — a number that would drop further in subsequent years.Footnote 73 By comparison, in Ambaca there were 1,459 senhores that year, who together owned 3,543 individuals (a ratio of 2.4 slaves per owner), which, as we have seen, was also a captive population in decline. The Golungo and Cazengo districts respectively counted 1,740 and 753 registered slave owners, together owning 6,522 people (2.6 slaves per owner). Thus, as the export slave trade wound down in the 1850s, in all four districts small-scale slave ownership was the norm and plantations with large, enslaved workforces were the exception.
Conclusion
In this essay, we have used a unique set of population counts from nineteenth-century Angola to examine a central argument in the literature on the Atlantic slave trade and African slavery. Analysing demographic data from several colonial districts in Portuguese Angola, the essay has challenged the widely accepted theory that the size and composition of slave populations in western Africa changed under the influence of the maritime slave trade. First, in two districts, Ambaca and Encoge, there is evidence that a sizeable segment of the population was enslaved during the last phase of the transatlantic slave trade. But we have argued that if this signalled an expansion of slavery in Angola — which is hard to measure in the absence of earlier data — this transformation was conditional upon the specific role both districts played in supplying captives to Brazilian slavers in Luanda. When the slave trade to Brazil and Cuba closed in the 1850s and 1860s, slave ownership in these colonial enclaves rapidly declined despite the labour needs of local agriculture. Meanwhile, in the Golungo district west of Ambaca, which did not have the same entrepôt function but was still central in the slaving networks supplying the coastal ports, enslaved people rarely formed more than a small segment of the total population. Second, the theory that enslaved populations were predominantly female is not consistently borne out by the demographic history of the districts examined here. In Encoge, the sex ratio was in most years biased to women, but in neither Ambaca nor Golungo did slave owners demonstrate a clear preference for female captives. We suggest that warehousing, with its focus on male captives for the export slave trade, was an important reason for the generally balanced sex ratios.
Finally, the transformation theory holds that slave labour became increasingly common during the agricultural transition following the abolition of the slave trade. Evidence from Golungo and Cazengo suggests that settlers and resident smallholders in these districts began to accumulate larger numbers of captives, especially women, for coffee growing in the late 1860s. By contrast, slave ownership in another important coffee-producing district, Encoge, plummeted according to colonial registers. While the demographic evidence is therefore inconclusive concerning this part of the transformation thesis, it is nonetheless clear that the Brazilian ban on African slave imports in 1850 contributed to a large-scale reconfiguration of the Angolan labour market. Initially there was a glut in supplies of enslaved labour, leading to falling prices and illicit transfers of labour to São Tomé and Cuba. In areas where foreign settlers played a role in production, the transition to commodity trading eventually led to growing slave populations, but in other regions the end of the slave trade had the opposite effect. This study has therefore highlighted different ways in which societies located several hundred kilometres inland from the Angolan coast were affected by changes in global flows of captive labour.
The historical population tables on which this article has drawn provide a basis for similar studies of other regions in the Portuguese seaborne empire. Indeed, the strength of the data collected by the Counting Colonial Populations project lies in their potential for comparative analysis.Footnote 74 An obvious next step would be to examine the development of slavery in a larger set of colonial districts in Angola during the 1800s, using wider documentary evidence to assess the often diverging effects of the export slave trade, food and commodity production, urban and rural economies, droughts, and internal migrations on population structures.Footnote 75 Another avenue for future research is to compare slave populations across the empire. The coffee economy of São Tomé and Príncipe, for instance, provides an interesting contrast to Angola. Coffee production expanded in São Tomé during the nineteenth century at a pace comparable to Angola, increasing from 100 tons in 1832 to nearly 2,000 tons in 1874. Replenished with supplies from West Africa and Angola, the enslaved population of the archipelago grew from approximately 2,000 persons to 12,000 during this time, which was years before the local cocoa boom created its own peculiar labour demands. Coffee solidified the archipelago's character of an American-style slave society, as almost half its population was enslaved when Portugal abolished servitude in 1875.Footnote 76 Beyond Africa, there are comparisons to be made with Brazil, a slave society with much larger segments of so-called white, mixed-race, and freed peoples than was common in the African colonies.Footnote 77 Our essay on the demographics of slavery in the Angolan coffee districts thus calls for more detailed comparative studies of different regions within the Portuguese Empire, to bring out the diverse historical trajectories of colonial slavery.
Appendix
Enslaved population of Ambaca, 1799–1869.

Enslaved population of Golungo, 1803–69.

Enslaved population of Cazengo, 1856–69.

Enslaved Population of São José de Encoge, 1797–1869.

Acknowledgements
This article had the support of the Leverhulme Trust and CHAM (NOVA FCSH/UAc), through the strategic project sponsored by FCT (UID/HIS/04666/2019). The authors thank the participants in the 3rd European Society of Historical Demography Conference and the Economic and Social History reading group at the University of Glasgow, notably George Alter and Hannah-Louise Clark, for their comments on earlier versions of this article. Special thanks go to Shane Doyle, Sarah Walters, Esteban Salas and three anonymous reviewers for their thorough feedback on the draft. Taiana Catharino helped with preparing the data and Maria João Pereira designed the map of Angola. The authors remain responsible for any flaws and errors.