

1 Introduction
Ultrafast laser sources in the 5.6–11 μm spectral region are of strong interest because this band overlaps the molecular fingerprint window and many intense vibrational resonances in gases and condensed-phase materials[ Reference Crowder, Smith, Vass and Keddie 1 – Reference Ilev and Waynant 3 ]. Femtosecond sources in this wavelength range therefore enable chemically selective spectroscopy and imaging, strong-field light–matter interaction and resonant laser processing or surgery with enhanced material selectivity[ Reference Walsh, Reddy and Bhargava 4 – Reference Vampa, Hammond, Thiré, Schmidt, Légaré, McDonald, Brabec and Corkum 7 ]. Recent demonstrations of selective mid-infrared femtosecond ablation of vascular tissues and dental enamel have further highlighted the practical value of high-performance long-wave mid-infrared sources for biomedical applications[ Reference Yang, Zhang, Wang, Tian, He, Guo, Hu, Pu, Li, Sun, Ding, Wu, Li, Peng, Li, Leng and Liang 8 , Reference Fu, Yang, Tian, Guo, Xiang, Zhang, He, Deng, Wang, Peng, Wu, Hu, Chang, Wang, Anderson and Liang 9 ].
Ultrafast mid-infrared pulses in this spectral region are commonly generated by optical parametric amplification (OPA)[
Reference Heiner, Petrov and Mero
10
–
Reference Sang, Gao, Li, Fang, Song, Tian and Li
12
], difference-frequency generation (DFG)[
Reference Gu, Ding, Hu, Yuan, Zhang, Wang, Xie, Ma and Qian
13
–
Reference He, Wang, Tian, Xiang, Wan, Hu, Li, Wu, Chen, Yang and Liang
15
] or intrapulse DFG (iDFG) driven by broadband few-cycle pulses[
Reference Pupeza, Sánchez, Zhang, Lilienfein, Seidel, Karpowicz, Paasch-Colberg, Znakovskaya, Pescher, Schweinberger, Pervak, Fill, Pronin, Wei, Krausz, Apolonski and Biegert
16
, Reference Chen, Nagy and Baum
17
]. Among these routes, DFG is particularly attractive for high-average-power operation, and the generated idler can be passively carrier-envelope-phase (CEP) stable when the pump and signal are derived from the same front-end laser[
Reference Cao, Kärtner and Chang
18
, Reference Liu, Bromberger, Cartella, Gebert, Först and Cavalleri
19
]. The rapid development of Yb-based ultrafast lasers has made 1 μm sources especially appealing for this purpose, as they simultaneously provide high average power, high pulse energy and robust industrial-level operation. In parallel, non-oxide nonlinear crystals such as LiGaS
${}_2$
 (LGS) have enabled 1-μm-pumped DFG deep into the long-wave mid-infrared region owing to their broad infrared transparency, relatively wide bandgap and high damage tolerance[
Reference Kato, Miyata, Isaenko, Lobanov, Vedenyapin and Petrov
20
].
Despite these advantages, the signal-generation stage remains a central bottleneck in most 1-μm-pumped long-wave mid-infrared DFG systems. In conventional architectures, the signal wave is usually produced through white-light generation followed by one or multiple OPA stages before the final DFG crystal. Although this approach is versatile, it introduces substantial energy loss, alignment complexity and additional sources of instability. For example, a representative 1-μm-pumped LGS-based 9 μm optical parametric chirped pulse amplification (OPCPA) system delivered 14 μJ pulses at 10 kHz, but the pump-to-mid-infrared efficiency was only approximately 0.9%[ Reference Qu, Liang, Liu, Zou, Li, Wang and Zhang 21 ]. In the undepleted DFG regime, the idler field scales with both the pump and signal fields; consequently, improving the efficiency and energy of the signal wave provides a direct route to higher idler efficiency while reducing the pump loading on the nonlinear crystal. This is beneficial for mitigating thermal effects and lowering the risk of optical damage.
The need for a more efficient signal arm is closely related to a broader performance gap in current long-wave mid-infrared ultrafast sources. Watt-level average powers have been achieved at high repetition rates, including multi-watt tunable systems in the 4–12 μm range operating from hundreds of kilohertz to megahertz[ Reference Yang, Zhang, Wang, Tian, He, Guo, Hu, Pu, Li, Sun, Ding, Wu, Li, Peng, Li, Leng and Liang 8 , Reference Seidel, Xiao, Hussain, Arisholm, Hartung, Zawilski, Schunemann, Habel, Trubetskov, Pervak, Pronin and Krausz 22 ]. Conversely, high pulse energies are more commonly obtained at low repetition rates, typically from 10 Hz to 1 kHz, with sub-mJ 9 μm pulses recently reported at 1 kHz[ Reference Gu, Ding, Hu, Yuan, Zhang, Wang, Xie, Ma and Qian 13 ]. Sources that simultaneously combine high-repetition-rate, microjoule-level pulse energy and efficient conversion in the 5.6–11 μm region remain comparatively rare. Overcoming the signal-generation bottleneck is therefore an important step toward bridging high-average-power and high-peak-field operating regimes.
Gas-filled multi-pass cells (MPCs) provide a promising platform for this purpose. MPCs have enabled nonlinear post-compression of ultrafast pulses to the kilowatt average-power and more than 100 mJ pulse-energy level, establishing them as one of the most scalable architectures in ultrafast nonlinear optics[ Reference Grebing, Müller, Buldt, Stark and Limpert 23 – Reference Su, Luo, Li, Chang and Liu 25 ]. Few-cycle pulses produced by MPC compression have also been used for iDFG, generating tunable 4.5–9.5 μm radiation with tens of milliwatts of output power and efficiencies around 0.16%[ Reference Bournet, Guichard, Natile, Zaouter, Joffre, Bonvalet, Pupeza, Hofer, Druon, Hanna and Georges 26 ]. However, in iDFG the pump and signal portions are different spectral components of the same broadband pulse; their energy ratio, temporal duration and chirp cannot be optimized independently. An alternative strategy is to use an MPC not merely for few-cycle compression but also as a high-efficiency wavelength shifter that directly generates an energetic long-wavelength signal for a separate DFG stage. This architecture remains largely unexplored for high-repetition-rate long-wave mid-infrared generation.
Molecular gases are particularly suitable for nonlinear frequency shifting in MPCs owing to the coexistence of instantaneous electronic Kerr and delayed Raman nonlinearities. In contrast to noble gases, where nonlinear broadening is dominated by the instantaneous Kerr effect, molecular rotational excitation can enhance red-shifted spectral broadening and modify the spatiotemporal nonlinear dynamics[
Reference Safaei, Fan, Kwon, Légaré, Lassonde, Schmidt, Ibrahim and Légaré
27
]. Air-filled MPCs have recently become useful testbeds owing to their simplicity, and pure N
${}_2$
 or N
${}_2$
 O has also been investigated for enhanced spectral broadening and frequency shifting in MPC platforms[
Reference Feng and Bromage
28
–
Reference Kadiwala, Kovalenko, Fritsch, Goncharov and Pronin
31
]. Gases with strong rotational Raman nonlinearity are especially attractive for maximizing the long-wavelength shift and the usable signal energy. From this perspective, CO
${}_2$
 offers a favorable balance of nonlinear response, availability and safe handling. In contrast, despite its strong delayed Raman response, the practical use of N
${}_2$
 O is more restricted due to its neurotoxicity[
Reference Beetar, Nrisimhamurty, Truong, Nagar, Liu, Nesper, Suarez, Rivas, Wu, Shim and Chini
32
, Reference Kinyaevskiy, Koribut, Grudtsyn and Ionin
33
].
Here we demonstrate an efficient and scalable 5.6–11 μm ultrafast mid-infrared source based on Raman-shifted signal generation in a molecular-gas MPC followed by DFG in LGS. The key element is a He–CO
${}_2$
 -filled MPC that converts 1025 nm Yb-laser pulses into a tunable 1.10–1.25 μm signal with 17%–32% filtered-signal conversion efficiency at repetition rates up to 40 kHz. Helium is introduced as a buffer gas to suppress repetition-rate-dependent thermal degradation while preserving the Raman-enhanced spectral shift. The generated signal is then combined with a synchronized pump beam and converted in a 5.6-mm-thick LGS crystal. The system delivers 179 mW at 6 μm and 168 mW at 7 μm, corresponding to 4.5 and 4.2 μJ pulse energies, respectively. The maximum energy conversion efficiency reaches 6.4%, and the quantum efficiency reaches 41%. By replacing the conventional OPA-based signal arm with a Raman-shifted molecular-gas MPC, this work establishes a compact route toward efficient, high-repetition-rate, microjoule-level long-wave mid-infrared ultrafast sources.
2 Experimental setup
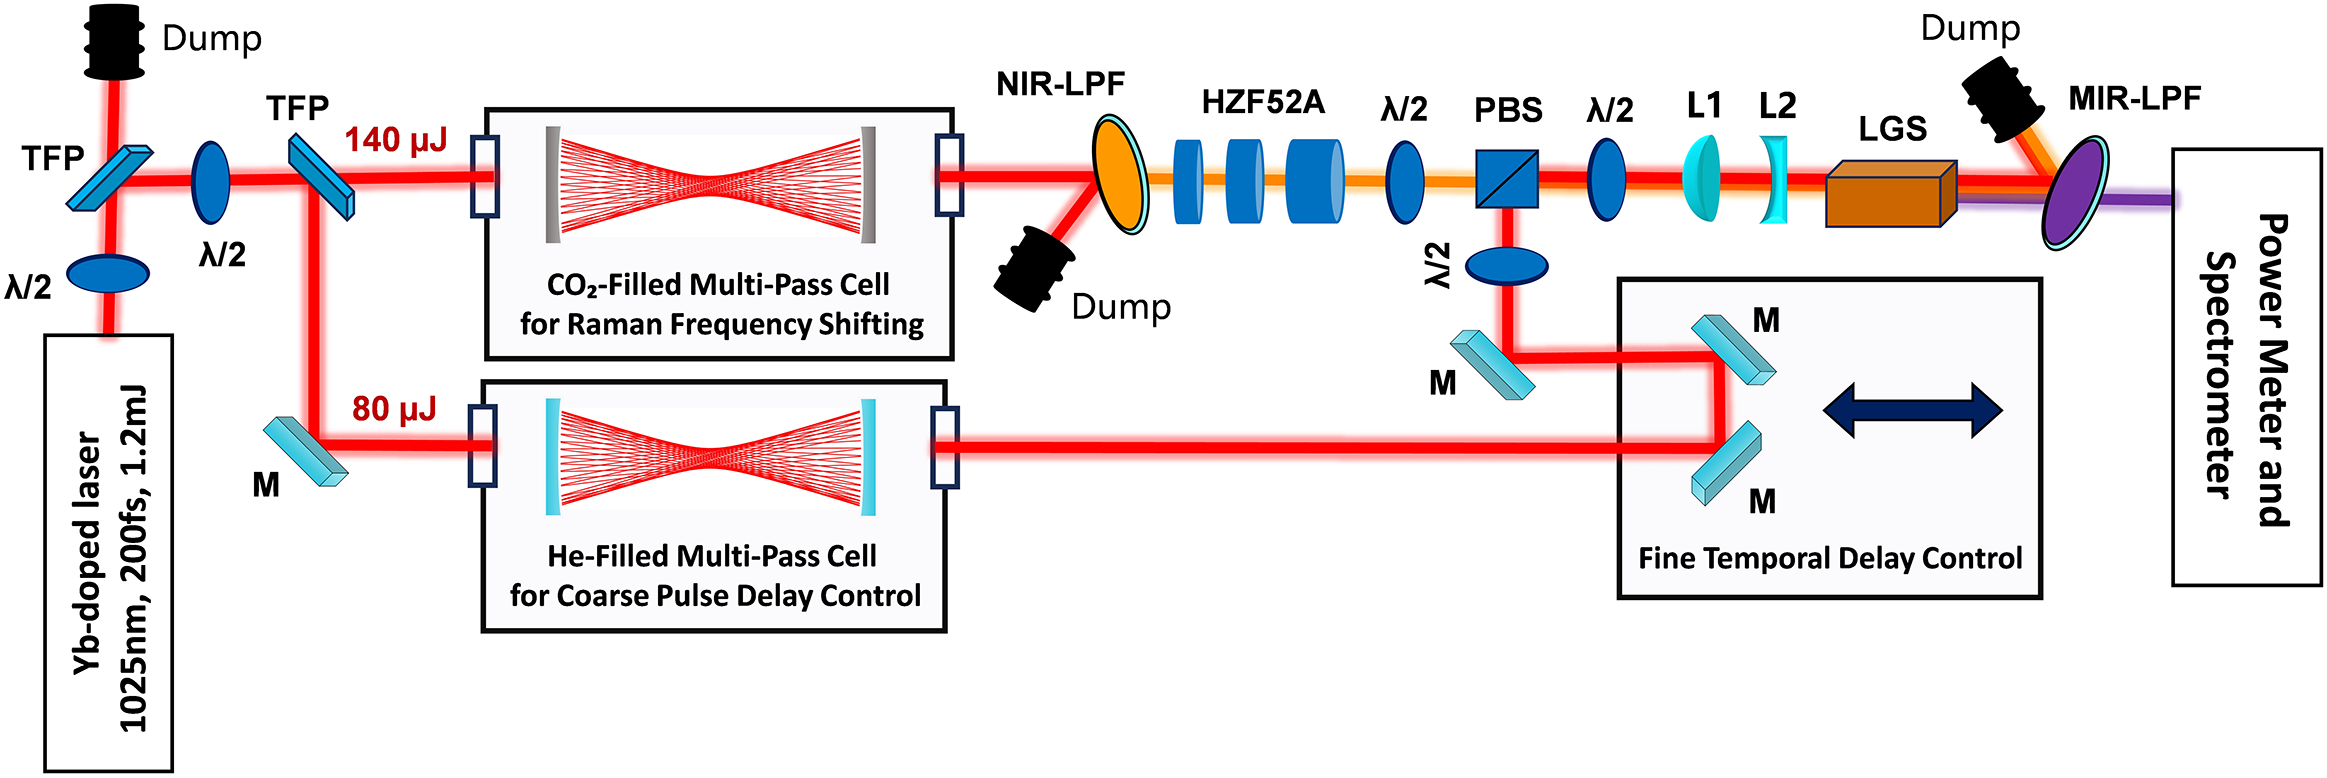
The experimental setup is shown in Figure 1. Both the pump and signal arms are derived from an Yb-laser source operating at 1025 nm, with a pulse duration of 200 fs, pulse energy up to 1 mJ and a repetition rate tunable from 1 to 120 kHz. The system is divided into three functional modules: Raman-shifted signal generation in a CO
${}_2$
 -based MPC, pump-arm delay control in a He-filled MPC and final DFG in an LGS crystal.
Experimental setup of the Raman-shifted MPC-driven mid-infrared DFG. TFP, thin-film polarizer;
$\lambda$
 /2, half-wave plate; LPF, long-pass filter; L, lens; PBS, polarizing beam splitter; M, mirror.

Figure 1 Long description
A technical schematic layout. Starting at the bottom-left, a Yb-doped laser (1025 nm, 200 fs, 1.2 mJ) emits a beam upward through a lambda / 2 plate and a T F P. The beam splits into two paths.
Upper path: The beam passes through another lambda / 2 plate and T F P, labeled 140 micro-Joules, into a C O sub 2-filled Multi-Pass Cell for Raman Frequency Shifting. The output passes through an N I R-L P F and a series of H Z F 5 2 A glass blocks, a lambda / 2 plate, and a P B S.
Lower path: The beam reflects off a mirror M, labeled 80 micro-Joules, into a He-filled Multi-Pass Cell for Coarse Pulse Delay Control. The output enters a Fine Temporal Delay Control box containing three mirrors M and a double-headed arrow indicating movement.
Recombination: The lower path beam reflects from the delay stage into the P B S, merging with the upper path. The combined beam passes through a lambda / 2 plate, lenses L 1 and L 2, an L G S crystal, and an M I R-L P F. The final output enters a Power Meter and Spectrometer. Several Dump components are positioned at T F P and filter reflection points to capture discarded light.
For Raman-induced signal generation, the 1025 nm pulses are coupled into a CO
${}_2$
 -filled MPC. Silver-enhanced mirrors with a reflectivity of approximately 99% are used to provide low dispersion over a broad spectral range. The cavity has a mirror radius of curvature of
$R=300$
 mm and a length of
${L=580}$
 mm, supporting 33 passes and a total propagation length of approximately 19 m. Mode matching is performed with mirrors of focal lengths
$f=-750$
 , 250,
$-750$
 and 2000 mm, yielding a beam waist of
${w}_0=165\ \unicode{x3bc}$
 m and a
$1/{e}^2$
 beam radius of
${w}_\mathrm{m}=730\ \unicode{x3bc}$
 m on the cavity mirrors. The beam waist is intentionally enlarged to increase the Rayleigh length and reduce local intensity, thereby mitigating ionization and thermal accumulation in the molecular gas. The MPC output is collimated to a beam diameter of 4.2 mm using a 1 m focal-length lens. Tunable signal pulses in the 1.10–1.25 μm range are obtained by filtering the Raman-induced red-shifted sidebands with long-pass filters having cut-on wavelengths of 1150, 1200 and 1250 nm. To improve temporal overlap with the 200 fs pump during DFG and to reduce the signal peak intensity in the nonlinear crystal, HZF52A glass plates with thicknesses of 1, 2 and 3 cm are inserted to positively chirp the signal pulses to approximately 300 fs.
A second MPC filled with He is placed in the pump arm. Its primary function is to provide a compact coarse optical delay that matches the propagation time of the Raman-shifted signal arm, while introducing a negligible nonlinear phase. This delay-line MPC has
$R=200$
 mm,
$L=392$
 mm and 46 passes, corresponding to a propagation length of approximately 18 m. Dielectric mirrors with reflectivity exceeding 99.9% provide a transmission efficiency of 96%. The cavity is filled with 0.5 bar He; the small nonlinear refractive index of He (
${n}_2=0.34\times {10}^{-24}{\,\mathrm{m}}^2/\left(\mathrm{W}\cdot \mathrm{atm}\right)$
 ) suppresses nonlinear broadening while improving thermal conduction[
Reference Bree, Demircan and Steinmeyer
34
]. A set of lenses with focal lengths of 600,
$-150$
 and 400 mm is used for mode matching, yielding a beam waist of
${w}_0=92\ \unicode{x3bc}$
 m. The beam exiting the MPC is collimated to 4.2 mm using a mirror group with focal lengths of
$f=-900$
 ,
$-1000$
 and 900 mm. Fine temporal adjustment between the pump and signal pulses is achieved using a pair of vertically mounted mirrors on a translation stage.
The pump and signal beams are spatially combined using a half-inch polarizing beam splitter (PBS). A half-wave plate placed before the PBS controls the relative pump and signal energies, whereas another half-wave plate after the PBS sets the polarization for type-I phase matching in LGS. The combined beam is reduced to a diameter of approximately 1.8 mm using a telescope with focal lengths of
$f=0.35$
 m and
$-0.15$
 m, and is then focused into a 5.6-mm-thick LGS crystal. The crystal features a
$5.5\ \mathrm{mm} \times 5.5\ \mathrm{mm}$
 aperture and is anti-reflection coated. The generated mid-infrared radiation is separated using a 4.5 μm long-pass filter and characterized by power and spectral diagnostics.
Near-infrared spectra are measured using a Yokogawa AQ6370 optical spectrum analyzer, and mid-infrared spectra are measured using an FTIRZZ spectrometer. Near-infrared pulse durations are characterized with an APE pulseCheck autocorrelator. Beam pointing and beam quality are measured using WinCamD-LCM and WinCamD-IR-BB cameras for the near- and mid-infrared beams, respectively. Power and energy measurements are performed using a PHORAS 10 W power meter for the near-infrared beams and a Thorlabs S401C detector for the mid-infrared output.
3 Results
3.1 Raman-induced spectral evolution in a CO
${}_2$
 -filled MPC at 1 kHz

Compared with noble gases, molecular gases possess additional rotational degrees of freedom that introduce a delayed nonlinear index change
$\Delta {n}_\mathrm{d}$
 in addition to the instantaneous electronic Kerr contribution
$\Delta {n}_\mathrm{i}$
 . The accumulated nonlinear phase can therefore be written as follows:

where
$L$
 is the effective propagation length. A strong delayed Raman contribution increases the effective nonlinearity and, more importantly, drives an asymmetric frequency shift toward long wavelengths. This property is directly useful for generating the 1.10–1.25 μm signal required for efficient 1-μm-pumped long-wave mid-infrared DFG.
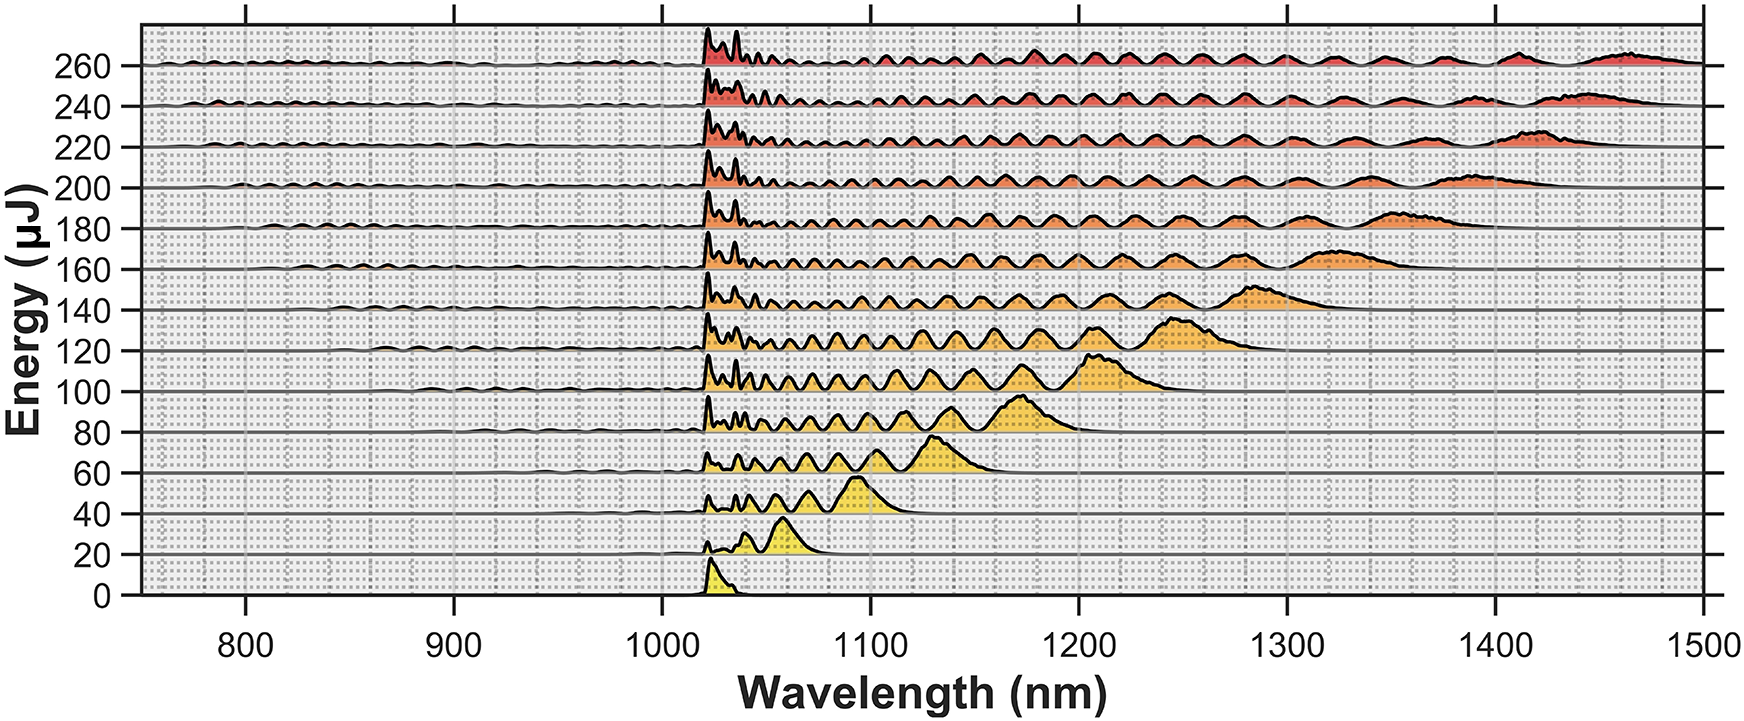
Figure 2 shows the output spectra of the 2 bar CO
${}_2$
 -filled MPC at 1 kHz as the input pulse energy is increased from 0 to 260 μJ. A pronounced Raman-dominated spectral evolution is observed, with strong asymmetry, a clear red shift and substantial enhancement of the long-wavelength sidebands. At an input energy of 260 μJ, the 20 dB bandwidth reaches 769 nm, corresponding to spectral coverage beyond one octave. To the best of our knowledge, this represents a record spectral bandwidth achieved from a 1 μm-driven MPC[
Reference Goncharov, Fritsch and Pronin
35
]. More importantly for the present work, a large fraction of the broadened spectrum is shifted into the 1.1–1.3 μm region, providing an efficient signal reservoir for subsequent DFG.
Evolution of the output spectrum from a 2 bar CO
${}_2$
 -filled MPC as a function of input pulse energy. The increasingly asymmetric red-shifted broadening indicates Raman-dominated nonlinear dynamics.

Figure 2 Long description
The line graph features a horizontal X-axis representing Wavelength in nanometers, ranging from 750 to 1500. The vertical Y-axis represents Energy in microjoules, with increments of 20 from 0 to 260.
At the bottom, at 0 microjoules, a single narrow peak is centered at approximately 1030 nanometers. As the energy increases vertically, the spectrum undergoes nonlinear broadening.
From 20 to 100 microjoules, the primary peak shifts toward longer wavelengths (red-shift) and develops a series of smaller oscillations to its left.
From 120 to 260 microjoules, the spectrum becomes increasingly asymmetric. The right-hand side of the signal extends significantly, reaching beyond 1450 nanometers at the highest energy levels. The color of the filled area under the curves transitions from yellow at lower energies to orange and finally red at the top. The broadening is predominantly toward the right (longer wavelengths), while the left edge remains relatively fixed near 1000 nanometers, with only minor low-intensity features appearing down to 800 nanometers at high energy.
3.2 Repetition-rate scaling in a He–CO
${}_2$
-filled MPC

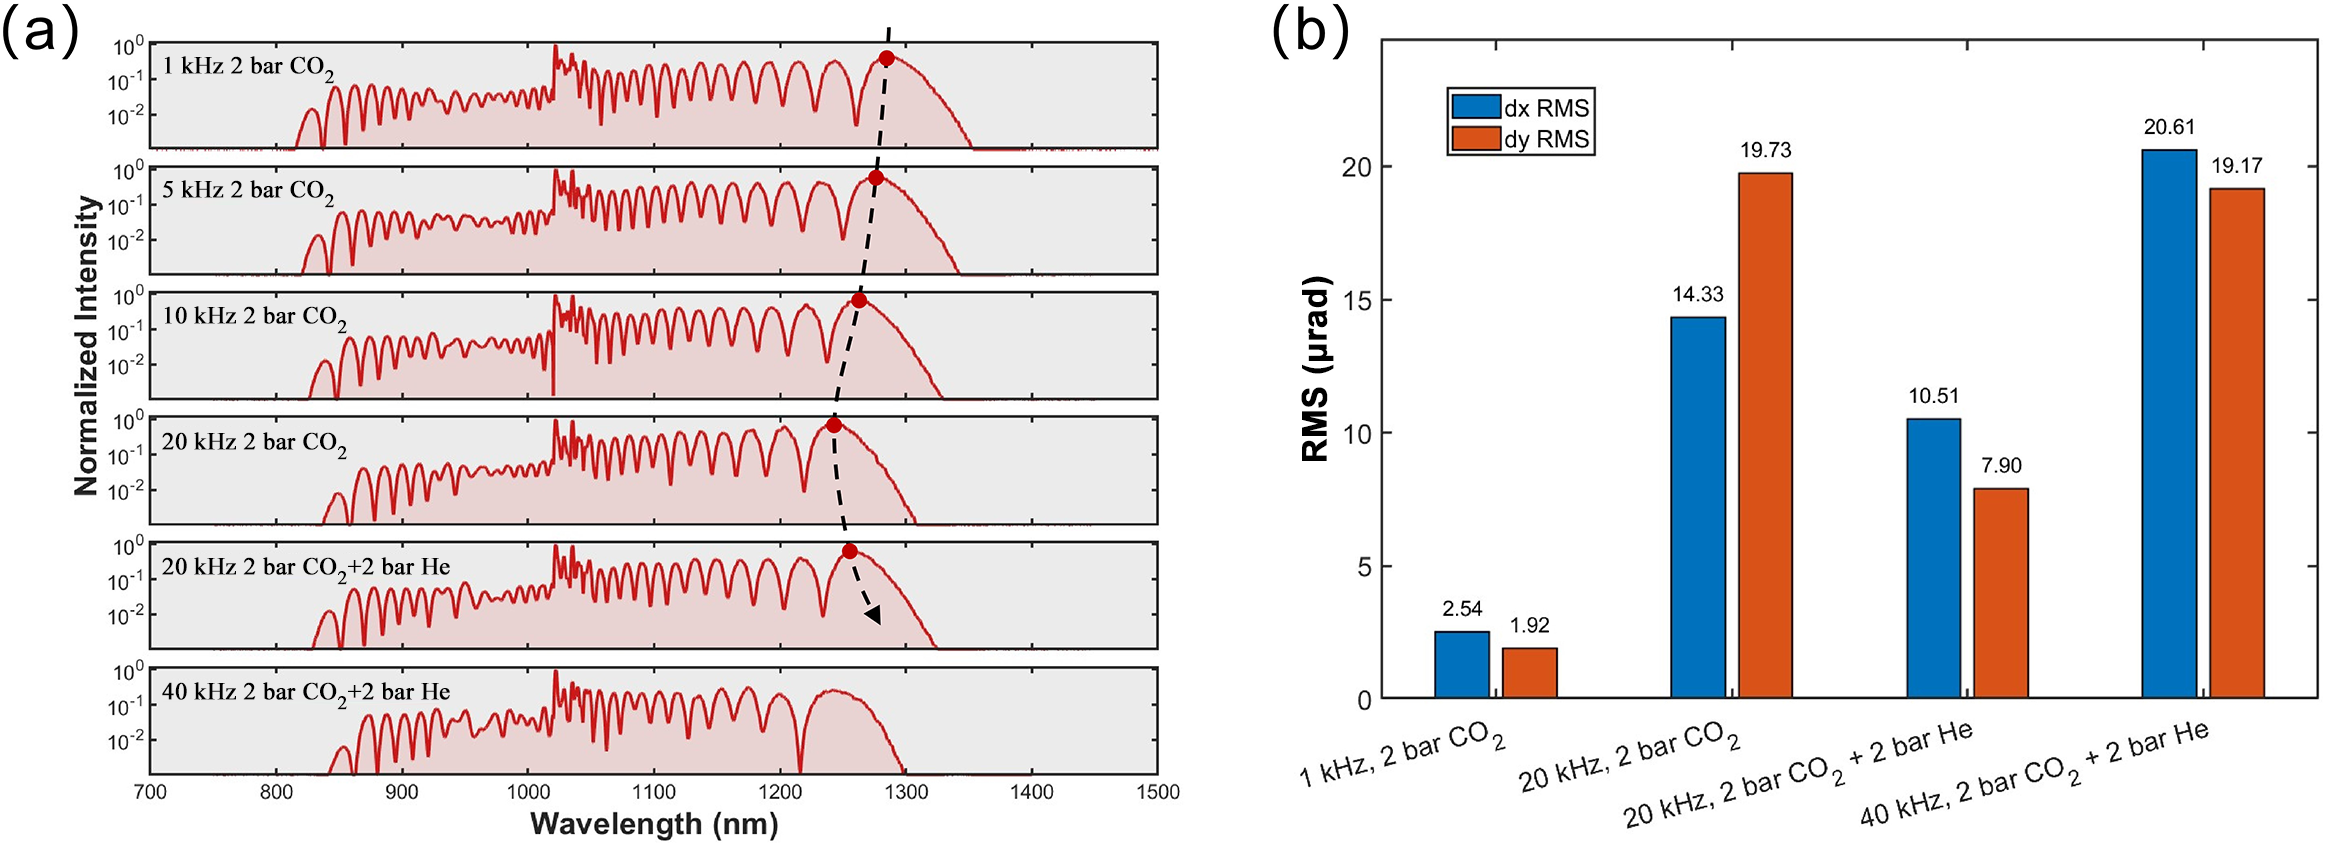
Under femtosecond excitation at elevated repetition rates, molecular gases with strong delayed Raman responses can suffer from thermal accumulation. As the average deposited heat increases, thermal effects weaken the rotational coherence and reduce the delayed nonlinear response. Figure 3(a) shows the spectral evolution of the pure CO
${}_2$
 -filled MPC as the repetition rate is increased from 1 to 20 kHz at a fixed input energy of 140 μJ and a pressure of 2 bar. The spectral broadening decreases monotonically with repetition rate: the 20 dB bandwidth decreases from approximately 513 nm at 1 kHz to 431 nm at 20 kHz. In contrast to hollow-core fibers, the transmission efficiency remains nearly constant at approximately 68% over this repetition-rate range, indicating the robustness of the MPC geometry against mode fluctuations and pointing perturbations[
Reference Beetar, Nrisimhamurty, Truong, Liu and Chini
36
, Reference Arias, Longa, Jargot, Pomerleau, Lassonde, Fan, Safaei, Corkum, Boschini, Ibrahim and Légaré
37
].
Repetition-rate scaling of the Raman-shifted MPC. (a) Spectral evolution in pure CO
${}_2$
 and in a He–CO
${}_2$
 mixture. (b) Beam pointing RMS fluctuations of the CO
${}_2$
 -based signal MPC.

Figure 3 Long description
Panel a consists of six vertically stacked line graphs. The x-axis represents Wavelength in nanometers from 700 to 1500. The y-axis represents Normalized Intensity on a logarithmic scale from 10 super minus 2 to 10 super 0. Each plot shows a red spectral curve with high-frequency oscillations. From top to bottom, the conditions are 1 k H z 2 bar C O sub 2, 5 k H z 2 bar C O sub 2, 10 k H z 2 bar C O sub 2, 20 k H z 2 bar C O sub 2, 20 k H z 2 bar C O sub 2 plus 2 bar H e, and 40 k H z 2 bar C O sub 2 plus 2 bar H e. A dashed black arrow points downward across the first five plots, tracking a red dot that shifts from approximately 1280 nanometers to 1250 nanometers as the repetition rate increases.
Panel b is a bar chart showing R M S fluctuations in microradians. The y-axis ranges from 0 to 20. The x-axis lists four conditions. Each condition has two bars: blue for d x R M S and orange for d y R M S.
1. 1 k H z, 2 bar C O sub 2: blue is 2.54, orange is 1.92.
2. 20 k H z, 2 bar C O sub 2: blue is 14.33, orange is 19.73.
3. 20 k H z, 2 bar C O sub 2 plus 2 bar H e: blue is 10.51, orange is 7.90.
4. 40 k H z, 2 bar C O sub 2 plus 2 bar H e: blue is 20.61, orange is 19.17.
To mitigate thermal degradation and extend the repetition rate, He is introduced as a buffer gas. The purpose of the He is not to provide additional nonlinearity, but rather to enhance thermal transport and accelerate collisional cooling while preserving the CO
${}_2$
 Raman contribution[
Reference Weitenberg, Vernaleken, Schulte, Ozawa, Sartorius, Pervak, Hoffmann, Udem, Russbüldt and Hänsch
38
]. Due to the safety pressure limit of the MPC (
$<4$
 bar), we use a 1:1 He–CO
${}_2$
 mixture to maximize the He fraction and thereby increase the gas collision rate, while maintaining a sufficient CO
${}_2$
 pressure to provide the required nonlinearity. This configuration is tested at 20 and 40 kHz. At 20 kHz, the mixed-gas MPC restores the spectral coverage to a level comparable to that obtained in pure CO
${}_2$
 at 10 kHz, as shown in Figure 3(a). The repetition rate is then increased to 40 kHz under mixed-gas conditions, where the spectral coverage remains comparable to that of the pure CO
${}_2$
 MPC at 20 kHz. The output power stability at 40 kHz exhibits a root-mean-square (RMS) fluctuation of only 0.12%, confirming that the mixed-gas MPC provides stable high-repetition-rate signal generation.
Beam pointing provides a sensitive indicator of residual thermal perturbations. As shown in Figure 3(b), the pointing fluctuations at the MPC output are measured over 10 min. In pure CO
${}_2$
 , the RMS pointing fluctuation increases from
$2.54\times 1.92\ \unicode{x3bc}$
 rad at 1 kHz to
$14.33\times 19.73\ \unicode{x3bc}$
 rad at 20 kHz. With the He–CO
${}_2$
 mixture, the 20 kHz pointing fluctuation is reduced to
$10.51\times 7.90\ \unicode{x3bc}$
 rad, whereas it increases to
$20.61\times 19.17\ \unicode{x3bc}$
 rad at 40 kHz. This degradation is attributed to residual thermally induced refractive-index fluctuations in the molecular gas, and additional thermal management generally improves the beam pointing stability of the MPC output at high repetition rates.
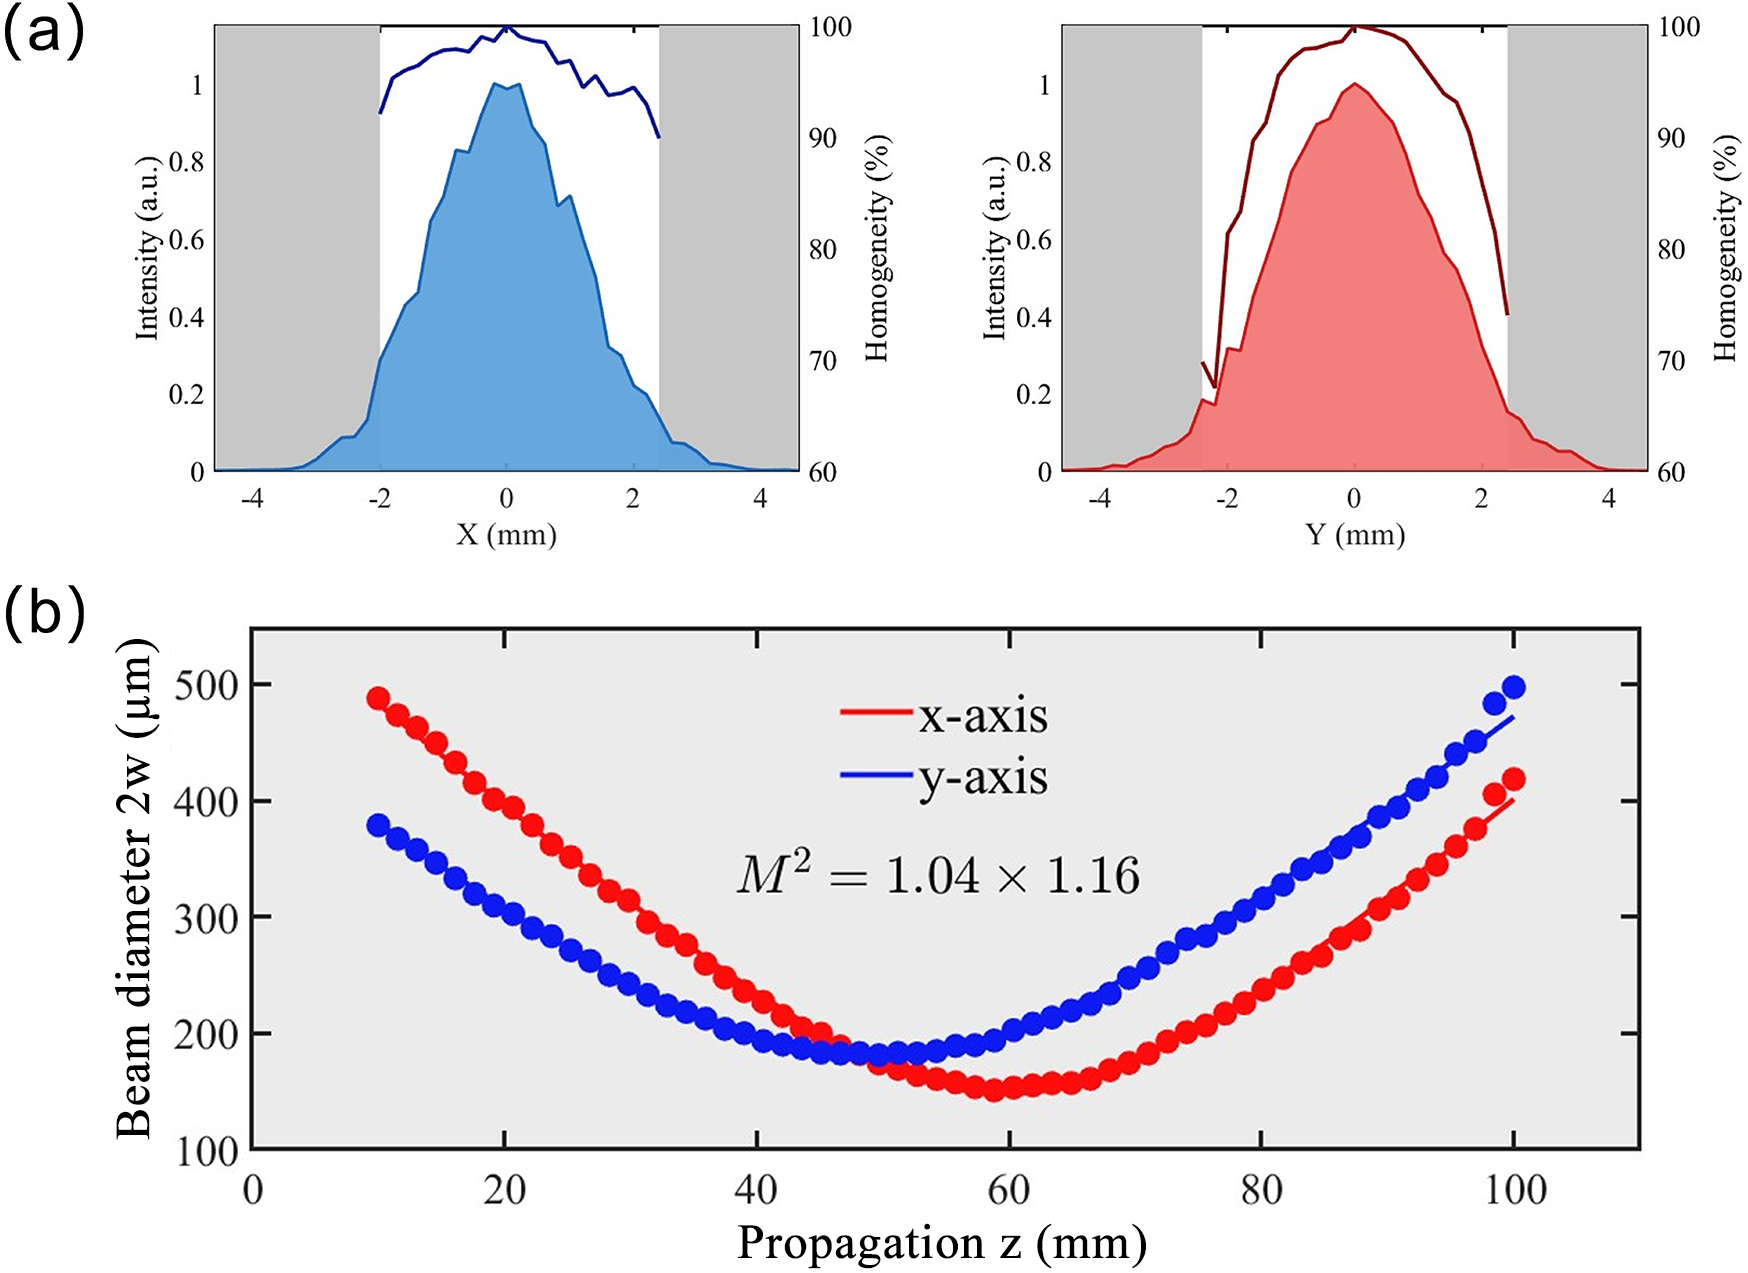
At 40 kHz, with 140 μJ input pulses and a gas mixture of 2 bar CO
${}_2$
 and 2 bar He, the spatial–spectral homogeneity and beam quality of the Raman-shifted MPC output are characterized. The spatial–spectral homogeneity is quantified by the following:

where
$I\left(x,\lambda \right)$
 is the local spectrum at transverse position
$x$
 and
${I}_0\left(\lambda \right)$
 is the on-axis spectrum[
Reference Arias, Longa, Jargot, Pomerleau, Lassonde, Fan, Safaei, Corkum, Boschini, Ibrahim and Légaré
37
]. A 100-μm-core multimode fiber is scanned across the collimated beam in both the
$x$
 and
$y$
 directions with a 200 μm step size. As shown in Figure 4(a), the homogeneity factors are
${V}_x=97\%$
 and
${V}_y=95\%$
 . The beam quality measurement in Figure 4(b) yields
${M}^2=1.04\times 1.16$
 . The high spatial–spectral homogeneity and near-diffraction-limited beam quality are essential because efficient DFG requires good spatial overlap, stable phase matching and a clean signal wavefront.
Signal-beam quality after the He–CO
${}_2$
 MPC at 40 kHz. (a) Spatial–spectral homogeneity and (b) beam quality factor
${M}^2$
 .

Figure 4 Long description
The image consists of two main sections labeled a and b.
Panel a contains two line graphs side-by-side.
* The left graph plots Intensity in a.u. on the left Y-axis and Homogeneity in percent on the right Y-axis against X in millimeters on the X-axis. A blue shaded area represents the intensity profile, peaking at 1.0 at X equals 0. A dark blue line above it shows homogeneity fluctuating between 90 and 100 percent across the central region from -2 to 2 millimeters.
* The right graph plots the same variables against Y in millimeters. A red shaded area shows the intensity profile, and a dark red line shows homogeneity, which also remains high between 90 and 100 percent in the central region.
Panel b is a single large scatter plot with fitted curves.
* The X-axis is Propagation z in millimeters, ranging from 0 to 100.
* The Y-axis is Beam diameter 2 w in micrometers, ranging from 100 to 500.
* Red dots and a red curve represent the x-axis data, showing a parabolic trend that reaches a minimum diameter of approximately 150 micrometers at z equals 60.
* Blue dots and a blue curve represent the y-axis data, showing a parabolic trend that reaches a minimum diameter of approximately 180 micrometers at z equals 50.
* Text in the center of the plot reads M super 2 equals 1.04 times 1.16.
3.3 Microjoule-level tunable 5.6–11
$\mu$
m mid-infrared generation

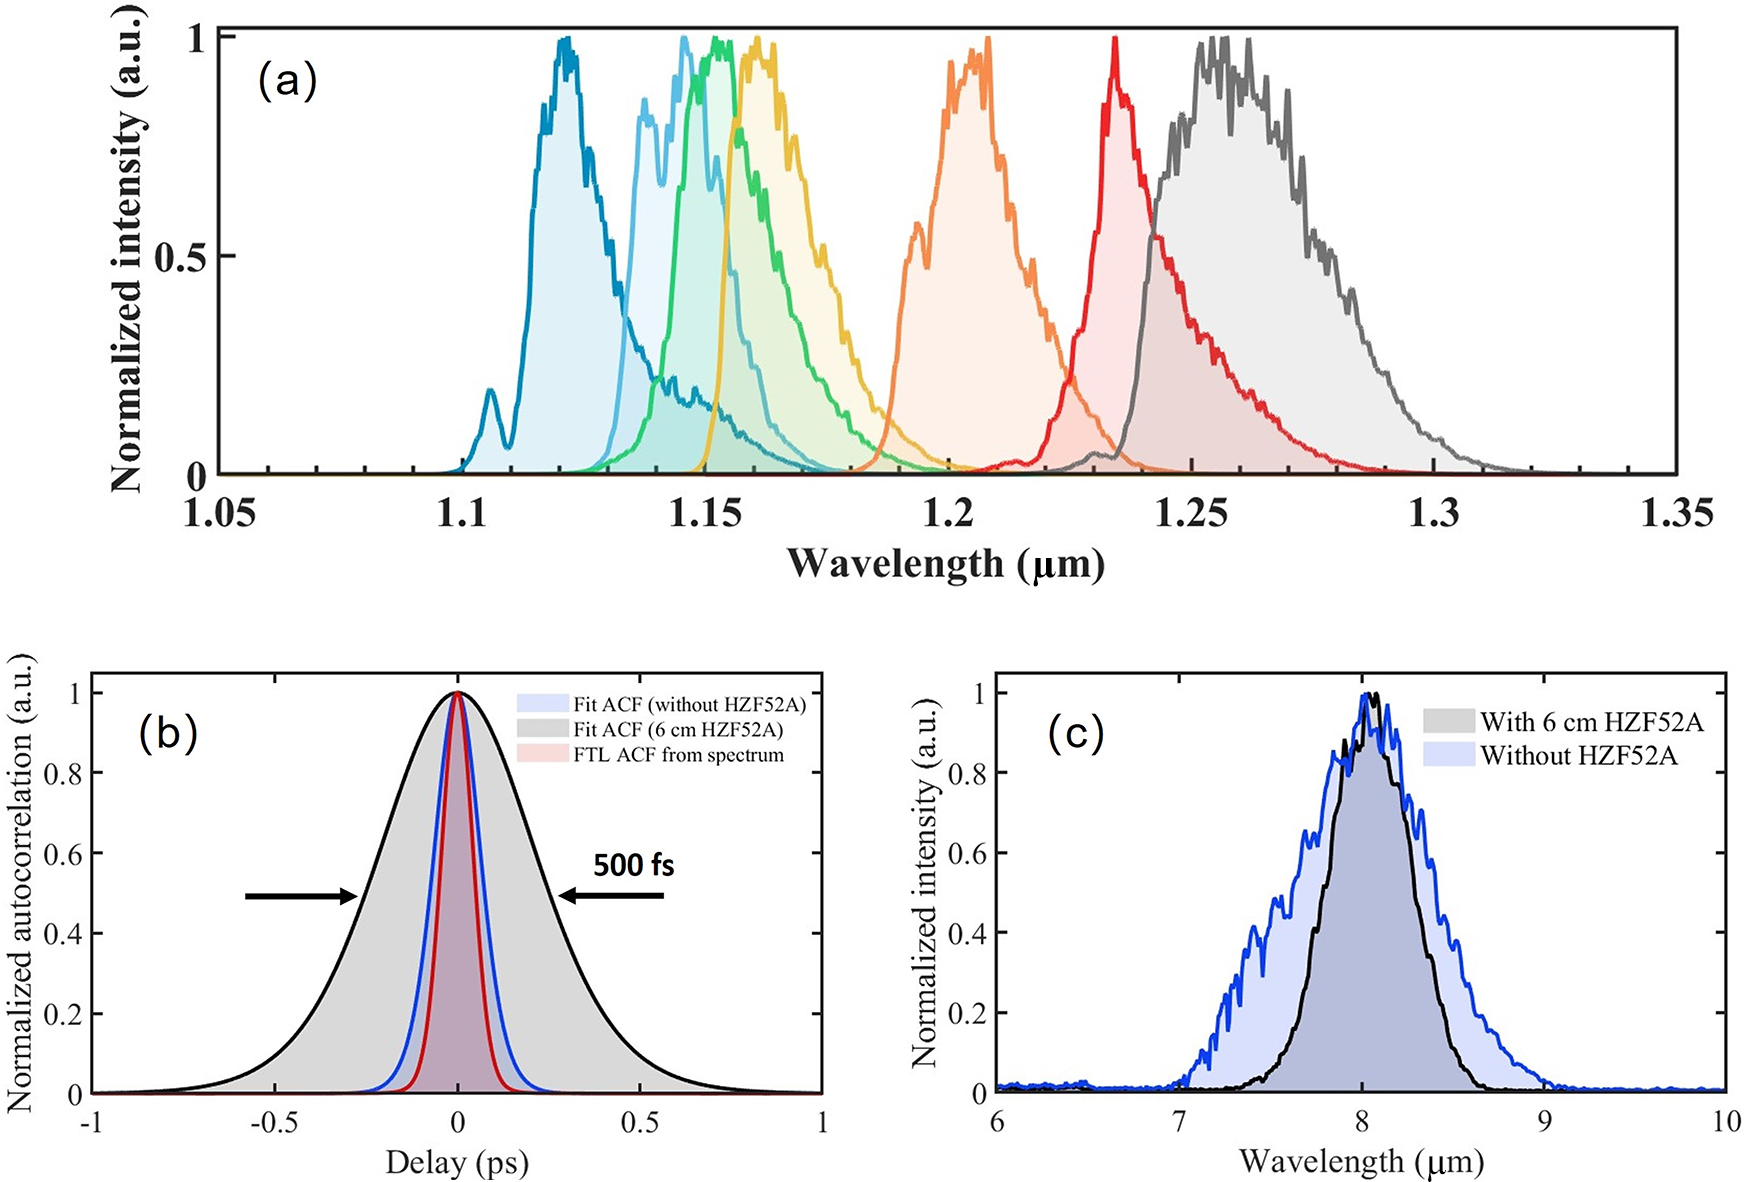
At a fixed input pulse energy of 140 μJ, tunable signal pulses in the 1.10–1.25 μm range are obtained by varying the gas pressure from 1.6 to 4 bar and filtering the Raman-shifted long-wavelength sidebands, as shown in Figure 5(a). The filtered-signal conversion efficiency is 17%–32% and decreases with increasing signal wavelength. The conversion efficiency is given by the product of the MPC transmission efficiency and the Raman frequency-shifting efficiency. This value is substantially higher than that typically achieved in white-light-seeded signal arms of OPA-based DFG systems. Further increasing the reflectivity of the MPC mirrors is expected to enhance the signal conversion efficiency in future work.
Tunable Raman-shifted signal generation and its influence on DFG. (a) Filtered-signal spectra obtained from the He–CO
${}_2$
 MPC by varying the gas pressure. (b) Autocorrelation traces of the filtered 1170 nm signal before and after HZF52A stretching. (c) DFG spectra centered at 8 μm measured with and without HZF52A glass.

Figure 5 Long description
Panel a is a line graph of Normalized intensity in arbitrary units versus Wavelength in micrometers from 1.05 to 1.35. It shows seven distinct, overlapping spectral peaks that shift toward longer wavelengths as gas pressure varies. The peaks are colored blue, cyan, green, yellow, orange, red, and gray, spanning from approximately 1.12 to 1.26 micrometers.
Panel b is a line graph of Normalized autocorrelation in arbitrary units versus Delay in picoseconds from minus 1 to 1. It compares three traces centered at zero. A broad gray shaded area labeled Fit A C F with 6 cm H Z F 5 2 A has a width of 500 femtoseconds indicated by two horizontal arrows. Inside this is a narrower blue trace labeled Fit A C F without H Z F 5 2 A, and the narrowest red trace labeled F T L A C F from spectrum.
Panel c is a line graph of Normalized intensity in arbitrary units versus Wavelength in micrometers from 6 to 10. It shows two D F G spectra centered at 8 micrometers. A light blue shaded area represents the spectrum Without H Z F 5 2 A, which is broader and more jagged. A gray shaded area with a solid black outline represents the spectrum With 6 cm H Z F 5 2 A, which is narrower and smoother.
The filtered signal exhibits a broader spectral bandwidth than the 1025 nm pump. For example, at a signal center wavelength of 1170 nm, the filtered bandwidth is approximately 24 nm, corresponding to a Fourier-transform-limited (FTL) pulse duration of approximately 70 fs, whereas the measured autocorrelation gives a sech
${}^2$
 -fitted pulse duration of approximately 97 fs, as shown in Figure 5(b). Although short signal pulses are beneficial for broadband DFG, they provide a limited temporal-overlap window in a millimeter-scale LGS crystal and can also increase the risk of optical damage due to their high peak power. Therefore, the signal pulses are positively chirped using highly dispersive HZF52A glass. HZF52A provides a group-delay dispersion of 92–131 fs
${}^2$
 /mm over the 1.1–1.3 μm range[
Reference Polyanskiy
39
]. After 6 cm of HZF52A, the autocorrelation broadens to approximately 500 fs, corresponding to a sech
${}^2$
 -fitted pulse duration of approximately 320 fs and reducing the signal peak power by approximately a factor of three.
Figure 5(c) compares DFG spectra centered at 8 μm with and without the HZF52A glass under a 2 W pump and a 0.4 W signal. Without chirping, the DFG output power is approximately 100 mW. With the chirped signal, the output power increases to approximately 108 mW despite the reduced peak power. This improvement indicates that temporal overlap over the 5.6 mm LGS crystal is more favorable for the chirped signal under the present energy-scaling conditions. The spectral bandwidth narrows from approximately 0.8 μm to approximately 0.5 μm because only the temporally overlapping spectral slice of the chirped signal contributes efficiently to DFG. Thus, near-FTL signals are preferable for broadband few-cycle mid-infrared generation, whereas chirped signals are advantageous here for improving the damage margin and energy scalability.
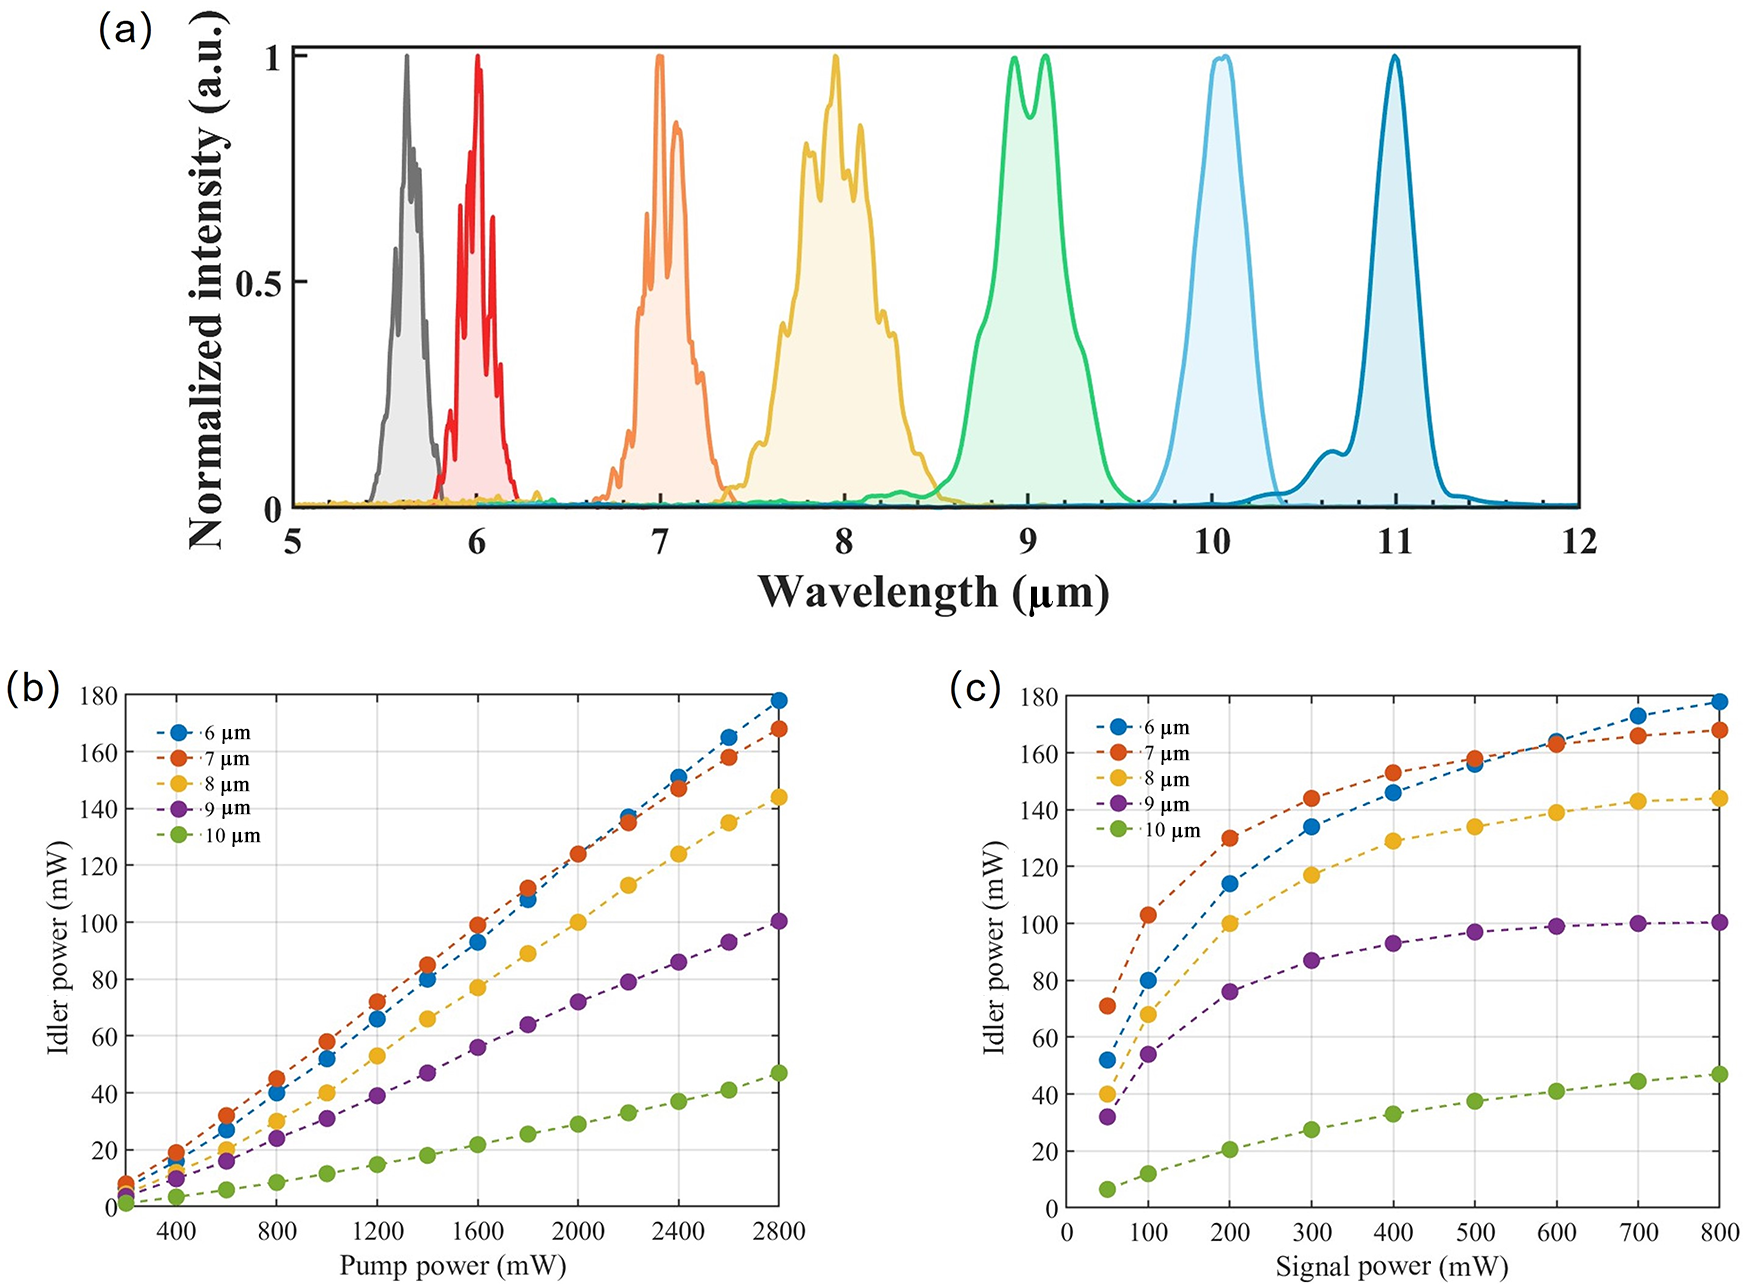
With a maximum signal energy of 20 μJ and a pump energy of 70 μJ, corresponding to a peak intensity of approximately 31 GW/cm
${}^2$
 in the LGS crystal, tunable mid-infrared spectra covering 5.6–11 μm are obtained by adjusting the signal central wavelength and the LGS phase-matching angle, as shown in Figure 6(a).
Tunable long-wave mid-infrared DFG output. (a) Representative spectra covering 5.6–11 μm. Output power at 6, 7, 8, 9 and 10 μm as a function of (b) pump power and (c) signal power.

Figure 6 Long description
Panel a is a line graph of Normalized intensity in arbitrary units versus Wavelength in micrometers. It displays seven distinct spectral peaks centered at approximately 5.6, 6, 7, 8, 9, 10, and 11 micrometers. The peaks vary in width and fine structure, with the 9 micrometer peak showing a double-lobed top.
Panel b is a line graph of Idler power in m W versus Pump power in m W ranging from 0 to 2800. Five data series representing wavelengths of 6, 7, 8, 9, and 10 micrometers show a linear increase in idler power as pump power increases. The 6 micrometer series reaches the highest power of nearly 180 m W, while the 10 micrometer series shows the lowest slope, reaching approximately 45 m W.
Panel c is a line graph of Idler power in m W versus Signal power in m W ranging from 0 to 800. The same five wavelength series are plotted. Each curve shows a steep initial increase that gradually levels off, indicating power saturation. The 6 micrometer series eventually surpasses the 7 micrometer series at high signal power, reaching nearly 180 m W.
Figures 6(b) and 6(c) show the mid-infrared output powers at 6, 7, 8, 9 and 10 μm as functions of pump power at a fixed signal energy of 20 μJ and signal power at a fixed pump energy of 70 μJ, respectively. The output power decreases toward a longer wavelength, primarily due to the photon-energy scaling governed by the Manley–Rowe relation. A more pronounced efficiency reduction is observed beyond 9 μm, which is likely caused by increased absorption in LGS in this spectral region. The signal-power dependence shows clear saturation as the signal energy approaches 20 μJ, suggesting that, under the current operating conditions, further idler scaling should rely mainly on increasing the pump energy while controlling the intensity in the crystal.
The maximum output power reaches 179 mW at 6 μm, corresponding to a pulse energy of 4.5 μJ, an energy conversion efficiency of 6.4% and a quantum efficiency of 37%. The energy conversion efficiency is calculated as the ratio of the generated mid-infrared power to the pump power incident on the LGS crystal. The spectral bandwidth is approximately 0.18 μm, corresponding to an FTL pulse duration of 208 fs. At 7 μm, the output power reaches 168 mW, corresponding to 4.2 μJ pulses, a conversion efficiency of 6% and a maximum quantum efficiency of 41%. The bandwidth is approximately 0.26 μm, corresponding to an FTL duration of 196 fs. The high efficiency is enabled by the large signal energy produced by the Raman-shifted MPC, together with its excellent beam quality and spatial–spectral homogeneity. For comparison, at a signal power of 50 mW, a level typical of many OPA-based signal arms, the 6 μm output power is only 52 mW. Raising the signal power through the Raman-shifted MPC therefore produces an approximately threefold increase in mid-infrared output power under otherwise similar pump conditions.
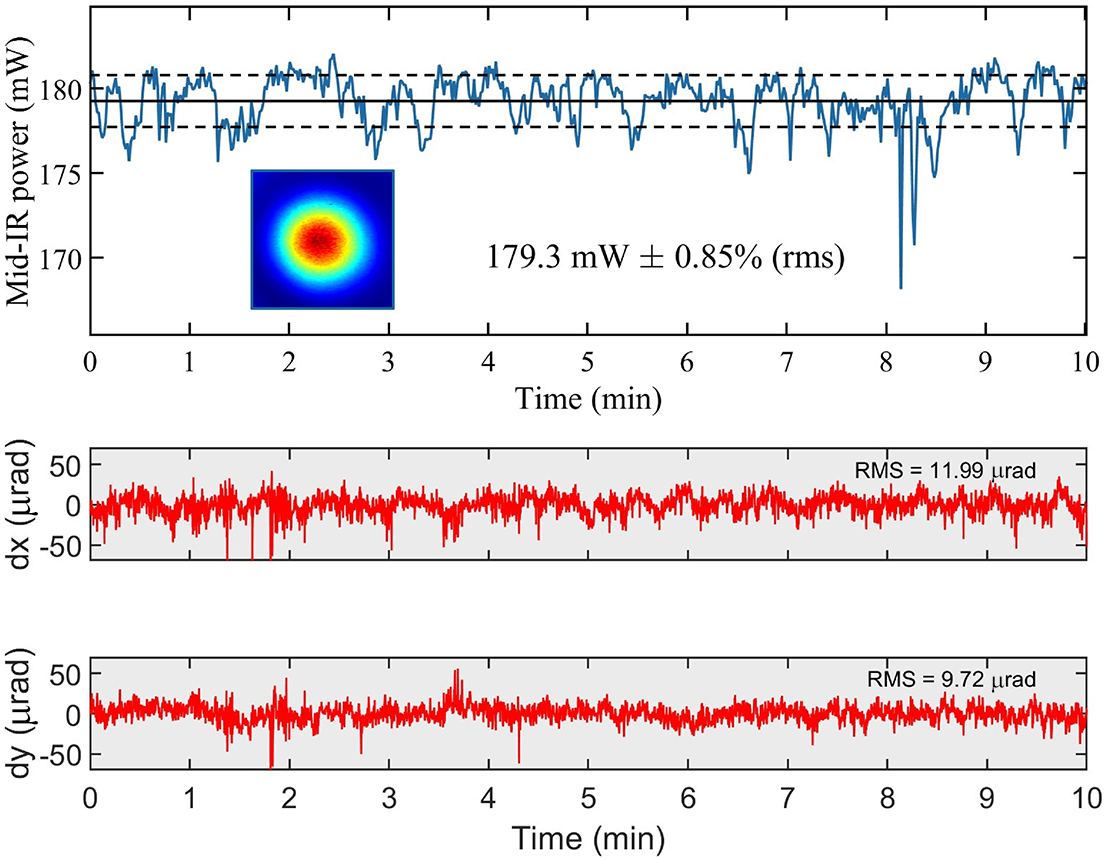
We measured the short-term power and pointing stability of the 6 μm mid-infrared output over 10 min, as shown in Figure 7. The RMS power fluctuation is 0.85%, indicating low-intensity noise for the DFG output. The RMS pointing fluctuations are 11.99 and 9.72 μrad in the
$x$
 and
$y$
 directions, respectively. These values are lower than those of the signal-generating He–CO
${}_2$
 MPC, which is reasonable since the DFG beam inherits pointing fluctuations from both interacting near-infrared beams. The pump-delay He-filled MPC, operating in a nearly linear regime, typically exhibits better pointing stability, with RMS pointing fluctuations of 10.58 and 6.89 μrad in the
$x$
 and
$y$
 directions, respectively.
Power and beam pointing stability of the 6 μm mid-infrared output measured over 10 min.

Figure 7 Long description
The figure consists of three vertically stacked panels with a shared X-axis representing Time in minutes from 0 to 10.
Top Panel: Mid-I R power in m W. The Y-axis ranges from 170 to 180 plus. A blue line fluctuates around a central horizontal solid line at approximately 179.3 m W, bounded by two dashed horizontal lines. A significant downward spike occurs at approximately 8.2 minutes. An inset shows a circular heat map of the beam profile with a red core and blue perimeter. Text reads 179.3 m W plus or minus 0.85% (r m s).
Middle Panel: Horizontal beam displacement d x in micro-radians. The Y-axis ranges from minus 50 to 50. A red line shows high-frequency noise centered at 0. Text in the top right corner reads R M S equals 11.99 micro-radians.
Bottom Panel: Vertical beam displacement d y in micro-radians. The Y-axis ranges from minus 50 to 50. A red line shows high-frequency noise centered at 0. Text in the top right corner reads R M S equals 9.72 micro-radians.
4 Discussion
The results show that the Raman-shifted molecular-gas MPC directly addresses the signal-arm bottleneck in 1-μm-pumped long-wave mid-infrared DFG. The physical chain is straightforward: rotational Raman nonlinearity in CO
${}_2$
 enhances red-shifted spectral broadening; filtering the long-wavelength sideband provides an energetic and high-quality 1.10–1.25 μm signal, and the large signal field then increases the DFG idler efficiency in LGS. Compared with an OPA-based signal chain, this scheme reduces the number of parametric stages while providing higher signal energy and excellent spatial quality. This is the primary reason why the system reaches 6.4% energy conversion efficiency and 41% quantum efficiency at 40 kHz.
The current output scaling is mainly limited by the pump intensity that can be safely applied to the LGS crystal. The signal-power dependence in Figure 6(c) already shows saturation near the maximum available signal energy, so increasing the pump energy is the most direct route to higher pulse energy and average power. Chirping both the pump and signal pulses, as well as increasing the beam diameter in a larger-aperture LGS crystal, can reduce the peak intensity while enabling higher pulse energy. According to Ref. [Reference Qu, Liang, Liu, Zou, Li, Wang and Zhang21], by expanding the beam diameter to approximately 3 mm and chirping the pulses to the picosecond regime, the input pump energy can be scaled to the millijoule level, enabling a several-fold increase in the mid-infrared pulse energy. At a repetition rate of 40 kHz, this projected operating point would enable both tens-of-microjoule pulse energy and watt-level average power in the long-wave mid-infrared region. Further improvements may be achieved by increasing the signal energy at higher pump levels, employing type-II phase matching in LGS to exploit a larger effective nonlinear coefficient, and using a thinner crystal to mitigate self-focusing and walk-off effects, thereby facilitating scaling toward higher average power pulse energy.
Repetition-rate scaling is the second route to higher average power. The present results identify thermal effects in the molecular gas as the main limitation. The He–CO
${}_2$
 mixture partly restores the Raman-shifted spectral coverage and enables stable operation at 40 kHz, but residual thermally induced index fluctuations still contribute to pointing noise. Future optimization should therefore focus on gases and gas-handling schemes that maintain a strong Raman response while improving heat removal. Possible strategies include optimizing the He/CO
${}_2$
 mixing ratio, increasing gas flow or refreshing it and applying differential pumping concepts that have been demonstrated in hollow-core-fiber systems[
Reference Beetar, Nrisimhamurty, Truong, Liu and Chini
36
, Reference Arias, Longa, Jargot, Pomerleau, Lassonde, Fan, Safaei, Corkum, Boschini, Ibrahim and Légaré
37
]. Given the intrinsically higher tolerance of MPC geometries to mode distortion compared with waveguides, these measures may enable further repetition-rate scaling without sacrificing transmission efficiency.
Finally, the trade-off between energy scalability and mid-infrared bandwidth should be considered. Chirping the signal improves temporal overlap and lowers peak intensity in the present long-crystal, high-energy DFG configuration, but it also narrows the idler bandwidth. Previous studies have shown that broadband few-cycle mid-infrared generation in DFG is governed by the nonlinear-crystal phase-matching bandwidth and the signal spectrum[ Reference Liu, Liang, Wang, Qu, Lang, Li, Wang and Zhang 40 , Reference Chen, Wittmann, Morimoto, Baum and Riedle 41 ]. For few-cycle long-wave mid-infrared generation, near-FTL broadband Raman-shifted signals combined with thinner LGS crystals may be more suitable. The demonstrated compressibility of Raman-broadened spectra in molecular-gas systems[ Reference Beetar, Nrisimhamurty, Truong, Nagar, Liu, Nesper, Suarez, Rivas, Wu, Shim and Chini 32 , Reference Légaré, Safaei, Barrette, Arias, Lassonde, Ibrahim, Vodungbo, Jal, Lüning, Jaouen, Tao, Baltuška, Légaré and Fan 42 ] suggests that Raman-shifted MPCs could also serve as front ends for broadband, CEP-stable few-cycle long-wave mid-infrared generation.
5 Conclusion
We have demonstrated an efficient Raman-shifted MPC-driven DFG scheme for tunable 5.6–11 μm ultrafast generation. A He–CO
${}_2$
 molecular-gas MPC produces a tunable 1.10–1.25 μm signal with 17%–32% filtered conversion efficiency at repetition rates up to 40 kHz. After DFG in LGS, the system delivers 4.5 μJ pulses at 6 μm with 179 mW average power and 6.4% energy conversion efficiency, and 4.2 μJ pulses at 7 μm with 168 mW average power and 41% quantum efficiency. The 6 μm output exhibits an RMS power fluctuation of 0.85% and beam pointing fluctuations of
$11.99\times 9.72\ \unicode{x3bc}$
 rad over 10 min. The high efficiency results from replacing the conventional OPA-based signal chain with an efficient Raman-shifted molecular-gas MPC that provides high signal energy, good spatial–spectral homogeneity and near-diffraction-limited beam quality. This approach provides a scalable path toward high-repetition-rate, high-energy and potentially few-cycle long-wave mid-infrared sources for spectroscopy, strong-field physics and resonant laser–matter interaction.
Acknowledgements
This work was supported by the National Natural Science Foundation of China (NSFC) (Grant No. 62427901).








 Open access

