

What role do African youth play in shaping politics across the continent? With a median age of 19 and roughly 70% of the population aged 30 years or younger, Africa is the youngest region in the world. Given this demographic reality, young people will be central to determining the future trajectory of democracy across the continent. Citizens’ political behaviour profoundly influences both the short- and long-term prospects for democratisation. While the political behaviour of all citizens matters, the behaviour of African youth is particularly consequential today and will remain so in the future.
Despite their status as the future torchbearers of the democratic flame, only a few studies have analysed African youth political participation. These studies observe that African youth are less likely to vote than older generations, similar to their peers in Europe and North America (Holbein and Hillygus Reference Holbein and Hillygus2020; Kuenzi and Lambright Reference Kuenzi and Lambright2011; Resnick and Casale Reference Resnick and Casale2014; Tambe and Kopacheva Reference Tambe and Kopacheva2024). At the same time, they often feature prominently in political protests and episodes of contentious politics (Branch and Mampilly Reference Branch and Mampilly2015; Mueller Reference Mueller2018). This apparent divergence of low formal participation and high levels of more informal engagement raises important questions about the factors shaping youth political behaviour.
Previous work on political participation in Africa has largely emphasised individual-level factors such as education, gender or socio-economic status. While these factors matter, a focus on individual-level characteristics alone overlooks two structural transformations that are reshaping political participation across African countries: the emergence of a large youth cohort and the rapid expansion of social media use. Demographic change alters the composition of the political community and might generate distinctive cohort-based socialisation processes, while social media could restructure access to political information, enhance exposure to mis- and disinformation, lower mobilisation costs or amplify peer influences. These forces are not independent. Young Africans constitute the overwhelming majority of social media users, suggesting that demographic and digital transformations may interact in shaping political behaviour.
This article examines how youth cohort size and social media usage, individually and jointly, affect political behaviour among African youth. Although both factors have been recognised as important in debates about Africa’s democratic trajectory, they have been studied largely in isolation. We argue that their interaction is theoretically consequential: large youth cohorts might enhance the salience of online networks, intensify shared perceptions of opportunity or deprivation, and produce socialisation effects that differ systematically from those of ageing societies. Integrating political demography with research on digital politics thus offers new insights for understanding variation in youth political behaviour.
Our contribution is threefold. First, we bring insights from political demography and political sociology into conversation by theorising how demographic structure and digital communication intersect to shape political participation. Second, we provide the first cross-national empirical test of the joint effects of youth cohort size and social media usage on political behaviour across African states. Third, by analysing Africa, a region that is simultaneously demographically exceptional and central to global debates about democratic backsliding and political change, we assess the scope conditions of prevailing theories of political participation and evaluate their generalisability beyond the high-income democracies in which many of these theories were developed.
We proceed as follows. The next section develops our theoretical framework and hypotheses; we then describe our data and methods, present our empirical findings and conclude by discussing the implications for research and policymaking.
Theoretical framework and hypotheses
Young people’s political participation has come under scrutiny in recent decades. Academic research focusing on Europe and North America concurs that compared with older generations, young people are relatively less engaged in institutionalised political behaviour such as voting and joining political parties (Foa and Mounk Reference Foa and Mounk2016; Fuchs and Roller Reference Fuchs, Roller and van Beek2018; Kimberlee Reference Kimberlee2002). By contrast, they demonstrate a penchant for non-institutionalised political activities such as protests and demonstrations (Dalton Reference Dalton2009) as part of the evolution of democratic citizenship from allegiance-focused loyalty to the political system to more assertive and authority-challenging expressions of participation (Dalton and Welzel Reference Dalton and Welzel2014; Norris Reference Norris2011).
The (still very limited) research on African contexts suggests that African youth, not too differently from their European and North American peers, are also reluctant to engage in formal democratic institutions such as elections (Resnick and Casale Reference Resnick and Casale2014; Kuenzi and Lambright Reference Kuenzi and Lambright2011; Tambe and Kopacheva Reference Tambe and Kopacheva2024). Conversely, analyses of African youth’s willingness to protest remain inconclusive. Some studies find that young people are similarly engaged in protests and demonstrations compared with the older generation (Resnick and Casale Reference Resnick and Casale2014). Others conclude that youth are more likely to protest (Tambe and Kopacheva Reference Tambe and Kopacheva2024), as evidenced by their disproportionate participation in the Arab Spring and the ‘third wave of protests’ (Branch and Mampilly Reference Branch and Mampilly2015; Mampilly Reference Mampilly2021; Mueller Reference Mueller2018).
Are these political expressions influenced by the interplay of young people’s cohort size in the population and the proliferation of social media use as a tool for socialisation and political information? If so, in what ways? Below, we theorise how broader societal trends such as the spread of social media usage and the emergence of a large youth cohort potentially influence political outcomes among young people and formulate three broad propositions for testing in the empirical section of the article.
Youth cohort size and youth political behaviour
Research on other world regions suggests that young people’s political behaviour is affected by whether they live in a country where they are surrounded by a large youth cohort. Some argue that a large youth cohort enhances young people’s support for democracy (Nkansah and Bartha Reference Nkansah and Bartha2023) and their propensity to participate in protests (Nkansah Reference Nkansah2022). Others are more sceptical and associate the experience of growing up in a society with many other young people with an increased risk of anti-democratic and extremist attitudes developing among young people (Weber Reference Weber2013) and a higher likelihood of disengagement from electoral participation (Nkansah and Papp Reference Nkansah and Papp2022).
The literature identifies two main mechanisms by which youth cohort size affects young people’s political behaviour. These mechanisms also amplify each other. The first relates to the increased risk of socio-economic deprivation. For any cohort of people within a population, the social and economic fortunes of the cohort decrease as their cohort size increases (Easterlin Reference Easterlin1987; Macunovich and Easterlin Reference Macunovich, Easterlin, Durlauf and Blume2008). Consistent with this hypothesis, several studies have shown that a large youth cohort is associated with fierce competition among youth and overcrowding in the labour market. Being surrounded by many other young people increases the risk of unemployment, underemployment and low wages for young people (Apolte and Gerling Reference Apolte and Gerling2018; Brunello Reference Brunello2010; Korenman and Neumark Reference Korenman, Neumark, Blanchflower and Freeman2000). Such socio-economic deprivations, in turn, can lead to increased political engagement through critical and authority-challenging political actions and engagement to address youth grievances (Asingo Reference Asingo2018; Gurr Reference Gurr1970; Muller Reference Muller1979). At the same time, the lack of economic resources due to joblessness or poor wages can also disempower youth from politics and divert their priorities to the biographical needs of their lives (Brady et al. Reference Brady, Verba and Lehman Schlozman1995; Quintelier Reference Quintelier2007; Teorell Reference Teorell2006).
The second theoretical mechanism governing the relationship between youth cohort size and political expression relates to the amplification effects of socialisation among young people. Peers are ubiquitous and ever-present agents in the lives of young people (Quintelier Reference Quintelier2015) and are important players in youth political socialisation. Young people’s political influence on each other can sometimes be even more pronounced than political socialisation through families or other social groups (Dostie-Goulet Reference Dostie-Goulet2009; Pilkington and Pollock Reference Pilkington and Pollock2015). Previous evidence suggests that peer influence can play a crucial role in informing, inspiring and mobilising young people for political participation (Bergan et al. Reference Bergan, Carnahan, Lajevardi, Medeiros, Reckhow, Thorson, Carnahan, Lajevardi, Medeiros, Reckhow and Thorson2021; Klofstad C Reference Klofstad C2011). From this perspective, a large youth cohort reflects a high concentration of young people who actively interact and influence one another, shaping patterns of political learning and engagement in both constructive and adverse ways (Nkansah and Papp Reference Nkansah and Papp2022; Weber Reference Weber2013). Research indicates that young people living in youth-saturated settings tend to socialise more frequently and experience stronger intra-generational influence than their counterparts in communities dominated by older adults (Hart et al. Reference Hart, Atkins, Markey and Youniss2004).
Following this line of argument, a large youth cohort can amplify the effects of peer influence within a large reservoir of peer socialising agents. If we assume that African youth are less willing to vote and more willing to protest compared with older generations, we would thus expect that a large cohort size further amplifies those effects. This leads us to our first hypothesis:
Hypothesis 1: The larger the cohort size of African youth, the less likely young Africans are to vote, but the more likely they are to protest.
Social media usage and youth political behaviour
Research on digital politics has increasingly highlighted social media as a restructuring force in contemporary political behaviour. The relationship between social media and political expression has been widely studied, particularly outside Africa, but increasingly within the African context as well. Whereas the relationship between social media use and political protests is well established, evidence of its effects on voter turnout remains more mixed (Persily and Tucker Reference Persily and Tucker2020).
A large body of research demonstrates that social media expands access to political information and offers a platform for collective action, thereby facilitating political mobilisation and protests. Moreover, social media use can amplify perceptions of shared grievances, while mis- and disinformation may enhance perceptions of threat and political outrage. During political uprisings against autocratic regimes in countries such as Egypt (Hassan et al. Reference Hassan, Kendall and Whitefield2016), Tunisia (Breuer et al. Reference Breuer, Landman and Farquhar2015), Sudan (Malik Reference Malik2022) or Zimbabwe (Nyoka and Tembo Reference Nyoka and Tembo2022), activists relied extensively on social media as a primary source of information, a platform for organising and coordinating protests, and a channel through which shared grievances could be articulated. More recently, the Gen Z protests, for instance in Kenya (Ngigi Reference Ngigi2024), Morocco and Madagascar or the #ENDSARS movement in Nigeria (Akerele-Popoola et al. Reference Akerele-Popoola, Azeez and Adeniyi2022), likewise leveraged social media to mobilise supporters and coordinate activism campaigns.
The relationship between social media usage and African citizens’ voting behaviour, in turn, is more controversially debated (Cheeseman et al. Reference Cheeseman, Fisher, Hassan and Hitchen2020, Reference Cheeseman, Lynch and Willis2018). On the positive side, social media can broaden access to political information and public discourse. Prior studies find positive associations between online political engagement and both the expression of political views and various forms of political participation (Boulianne Reference Boulianne2020, Reference Boulianne2019; Margetts et al. Reference Margetts, Hale, Peter John, Graham, Dutton and Castells2019; Skoric et al. Reference Skoric, Zhu, Goh and Pang2015). Scholars note similar dynamics across several African countries (Ndlela and Mano Reference Ndlela and Mano2020). On the negative side, the same digital platforms can also diffuse mis- and disinformation, polarising rhetoric and anti-democratic values (Tucker et al. Reference Tucker, Theocharis, Roberts and Barberá2017). Exposure to mis- and disinformation may weaken support for democratic processes, reduce satisfaction with democracy and erode trust in democratic institutions (Ochieng et al. Reference Ochieng, Grabe, Ireri and Mudavadi2026; Valenzuela et al. Reference Valenzuela, Halpern, Katz and Miranda2019; Wasserman and Madrid-Morales Reference Wasserman and Madrid-Morales2019). The case of Kenya, for instance, highlights how disinformation can foster political apathy and reduce individuals’ motivation to engage through electoral channels (Agbele Reference Agbele2023).
In sum, prior work suggests that social media may simultaneously strengthen citizens’ propensity to protest while dampening their inclination to vote. For African youth, who are often digitally connected yet politically marginalised, the effects of social media engagement on protest-based and electoral participation might be particularly pronounced. We therefore propose the following hypothesis:
Hypothesis 2: The more African youth rely on social media for political information, the more likely they are to protest and the less likely to vote.
Interaction of youth cohort size and social media usage
Previous research has examined the effects of youth cohort size and social media use on political participation largely separately. Yet the two factors are empirically intertwined and theoretically mutually reinforcing.
Empirically, social media usage is heavily concentrated among young Africans. Afrobarometer Round 9 data (2021–2023) indicate that nearly 40% of Africans aged 18–35 access political information via social media daily, compared with about 15% among those aged 56 years and older. As radio and television have declined in relevance for younger citizens, social media has become their primary channel for political information, mirroring global trends towards digitalised political communication. This pattern suggests that social media use is particularly consequential for young African citizens. Its effects are likely to vary across contexts, however, because internet access and the platforms used differ across countries and shape how political information, grievances and mis- or disinformation circulate.
Conceptually, youth cohort size and social media usage interact through mechanisms of political socialisation, grievance formation and collective mobilisation. Large youth cohorts shape the social environment in which individuals develop political attitudes, particularly where labour market overcrowding strengthens perceptions of socio-economic exclusion. Social media can amplify these cohort-based experiences in various ways: On the one hand, social media serves as a key arena of political socialisation. Exposure to political influencers, peer networks, issue-specific content and mis- or disinformation may reinforce existing attitudes and, in some cases, shift political preferences and voting decisions (Peter and Muth Reference Peter and Muth2023). On the other hand, social media increases the salience of economic and social comparisons. Studies in social psychology show that social media use is associated with upward social comparison, linked to lower self-worth (Irmer and Schmiedek Reference Irmer and Schmiedek2023). In addition, in large youth cohorts where competition for jobs, education and political representation is intense, mis- and disinformation circulating on social media may enhance perceptions that formal democratic institutions are unfair, manipulated or unresponsive to young citizens’ demands. Previous studies, for instance, identify an association between social media usage and satisfaction with democracy (Ochieng et al. Reference Ochieng, Grabe, Ireri and Mudavadi2026).
We therefore expect that social media conditions the relation between cohort size and both voting and protests. Among young Africans living in large youth cohorts, regular social media usage should increase the likelihood of protest participation. Grievances associated with socio-economic exclusion are likely to be amplified in online networks, while social media lowers coordination costs and facilitates collective action. In addition, the interaction between cohort size and social media may further reduce electoral participation. If large youth cohorts generate frustrations with formal political institutions, social media may reinforce such sentiments by exposing young people to content and peer networks that amplify distrust and promote disillusionment with formal democratic institutions and democratic values. Regular social media usage may therefore intensify the negative relation between large youth cohorts and voting. We summarise our argument in the following hypothesis:
Hypothesis 3: The use of social media for political information strengthens the negative association between youth cohort size and voting, while amplifying the positive association between youth cohort size and protest participation among young Africans.
Data and methods
We utilise a large-N research design to test the outlined propositions empirically. We analyse 40 African states sampled by the Afrobarometer survey between 2016 and 2023. This period covers Rounds 6–9 of the survey. We excluded the first five rounds from the analysis because social media, one of our key explanatory variables, was first measured in Round 6. Admittedly, the relatively short timeframe of the study (2016–2023) presents potential limitations to claims of causal–effect relationships, particularly for time-series cross-sectional datasets such as the Afrobarometer data. Our analysis and discussions therefore acknowledge these temporal limitations of the dataset. The Supplementary Material provides further information on the list of countries included in the study’s sample.
We compiled a multilevel dataset by pooling individual-level data from the Afrobarometer survey focusing on young people’s political values, attitudes, participation, socio-demographic and socio-economic characteristics, urban/rural residence and social media use. The Afrobarometer survey is a nationally representative continental survey that, since its inception in 1999, has sampled data from 42 African states over nine survey rounds. We combined the Afrobarometer survey data with country-level data. The World Bank provided contextual variables such as the percentage of individuals using the internet, youth unemployment rates (for ages 15–24) and gross domestic product (GDP) per capita (in purchasing power parity). The United Nations Population Division contributed data on each country’s youth cohort size, while V-Dem’s Liberal Democracy Index supplied information on the quality of democracy across the sampled countries. Table 1 shows the distribution of observations across countries for Rounds 6–9.
Sample Size Distribution Across Countries in Afrobarometer Rounds 6–9

Table 1 Long description
Country sample sizes are listed as number of observations per survey round for 2016, 2019, 2022, and 2023, plus a Total column. Column totals are 19,317 in 2016, 16,960 in 2019, 16,548 in 2022, and 17,204 in 2023. Highest country totals include Kenya 3,395, Nigeria 3,358, Ghana 3,323, Mozambique 3,316, Tanzania 3,060, and Uganda 2,896. Other large totals include Malawi 2,547, South Africa 2,451, Sudan 2,365, Cameroon 2,362, Gabon 2,013, Zambia 2,012, and Zimbabwe 2,025. Countries with observations in only one year include Algeria 389 in 2016, Burundi 402 in 2016, Egypt 473 in 2016, Angola 596 in 2023, Congo, Republic 409 in 2023, and Mauritania 386 in 2023. Some countries have zeros in one or more rounds, such as Ethiopia with 935 in 2022 and 1,055 in 2023 and zeros in 2016 and 2019, and Gambia with 506 in 2019 and 502 in 2022 and zeros in 2016 and 2023. Sao Tome and Principe has 498 in 2016 and 491 in 2019 and zeros in 2022 and 2023, totaling 989.
Note: Some countries were consistently sampled across all survey rounds (6–9), while others were not, hence the difference in total sample sizes across countries.
Variable operationalisation: dependent variables
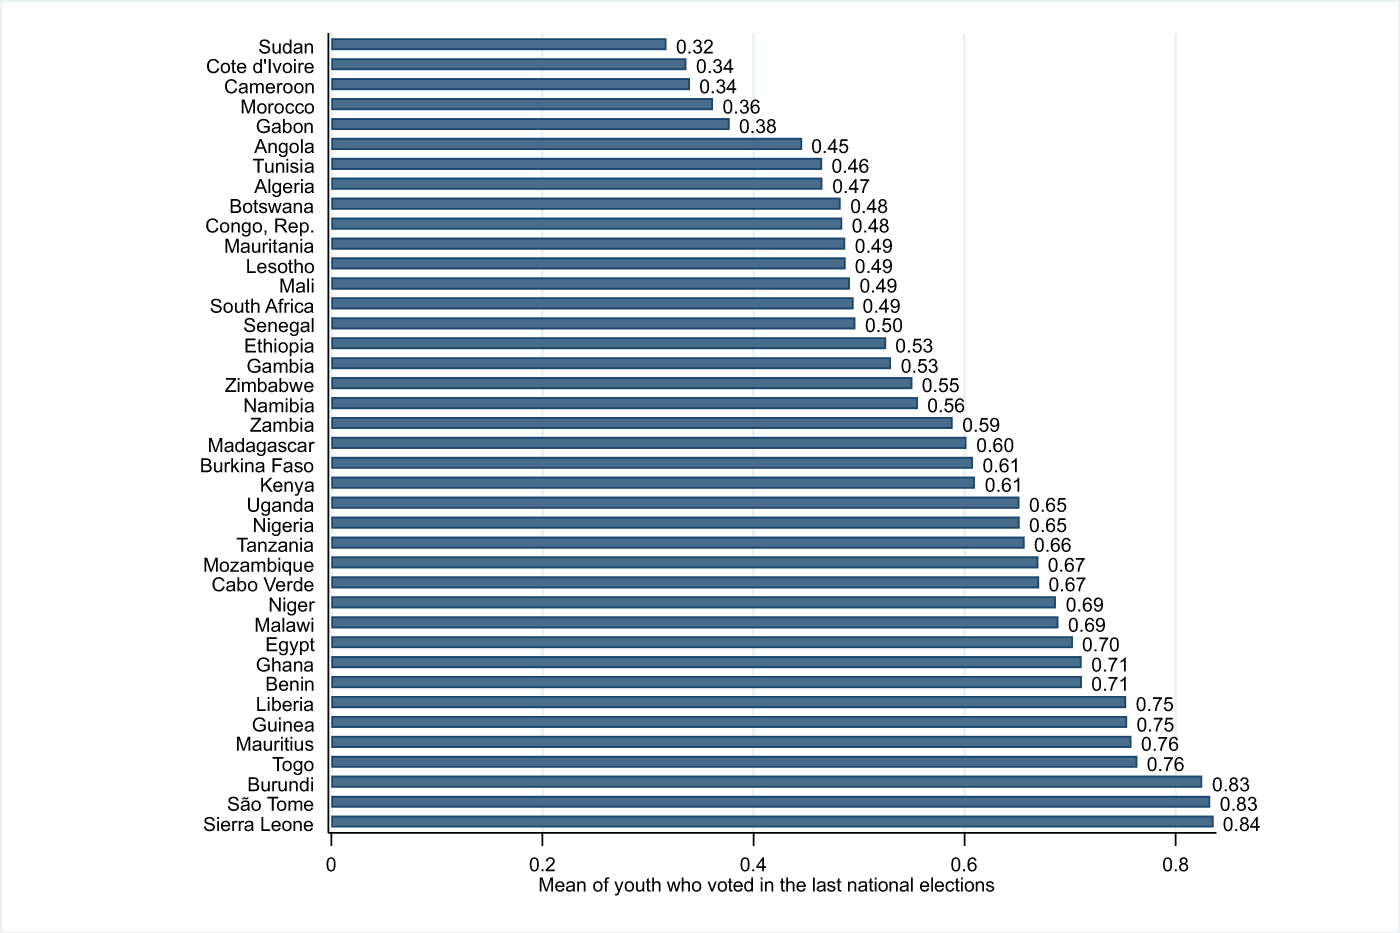
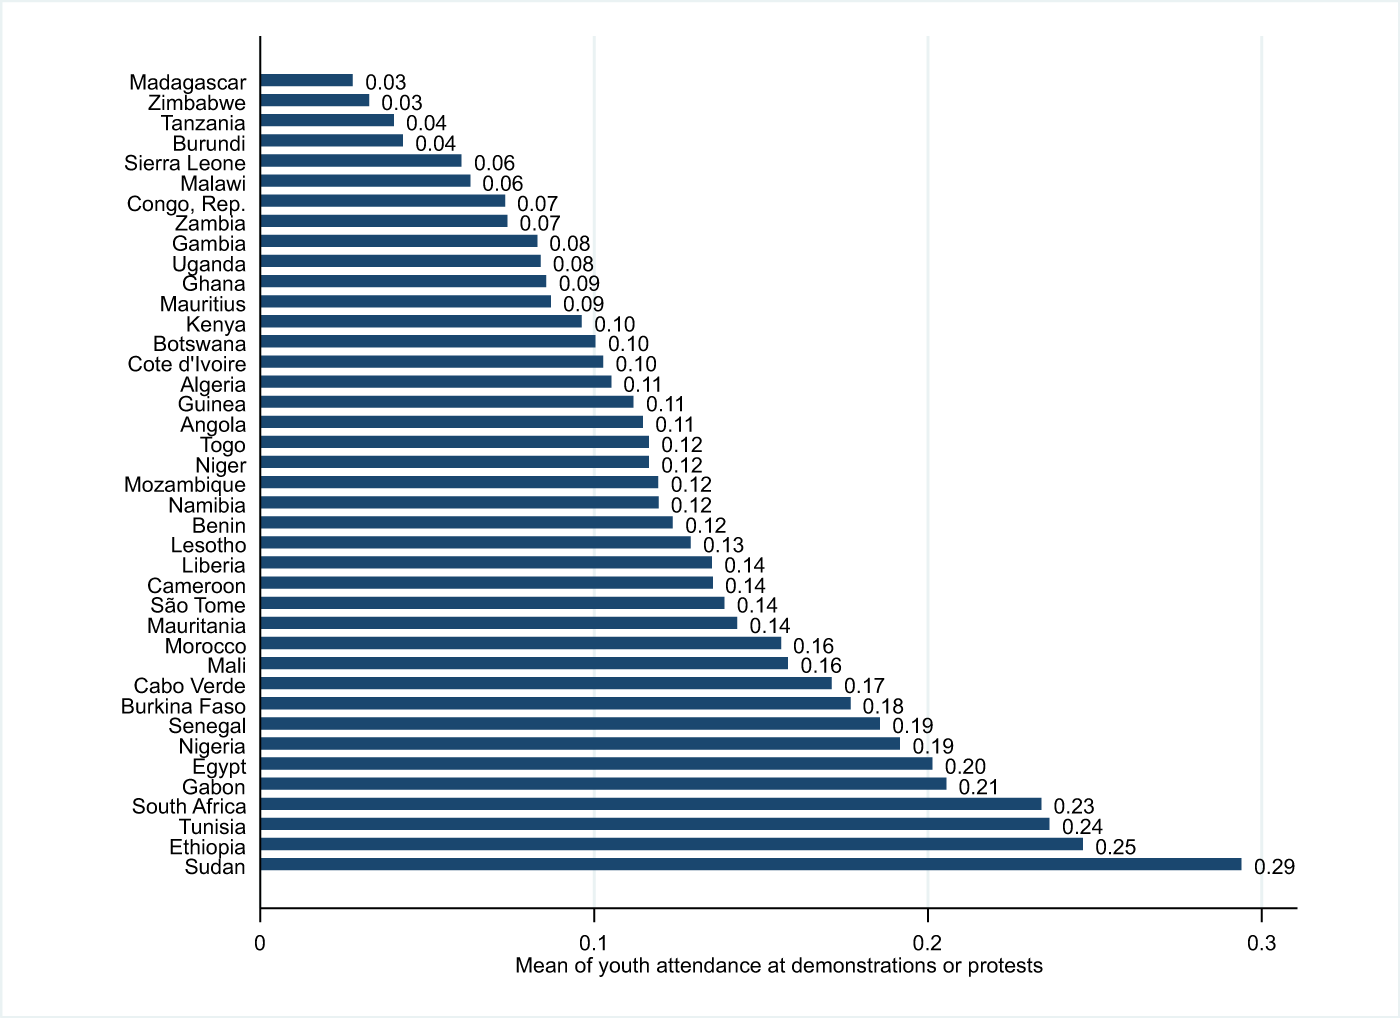
We used two dependent variables as proxies for two dimensions of political participation. To capture institutionalised political participation, we used voting in the last national election. For non-institutionalised political participation, we used attendance at demonstrations or protest marches. Both variables are drawn from Afrobarometer survey questions that elicit categorical responses, which we recoded into binary outcomes for analysis: responses indicating engagement in the activity were coded as 1 and those indicating non-engagement were coded as 0. Across the four rounds of survey data used in this study, the average proportion of youth (African citizens aged 18–29) who reported voting in the last national election was 59%, while 13% reported having ever participated in a demonstration or protest. This means that approximately 41% had not voted, and about 87% had never taken part in a protest. Further details on the operationalisation of the dependent and independent variables are provided in the Supplementary Material. Figures 1 and 2 illustrate the mean distribution of the two dependent variables across countries.
Proportion of Youth Across Countries Who Voted in the Last National Elections (0–1)

Figure 1 Long description
Country labels listed top to bottom: Sudan, Cote d Ivoire, Cameroon, Morocco, Gabon, Angola, Tunisia, Algeria, Botswana, Congo comma Rep comma, Mauritania, Lesotho, Mali, South Africa, Senegal, Ethiopia, Gambia, Zimbabwe, Namibia, Zambia, Madagascar, Burkina Faso, Kenya, Uganda, Nigeria, Tanzania, Mozambique, Cabo Verde, Niger, Malawi, Egypt, Ghana, Benin, Liberia, Guinea, Mauritius, Togo, Burundi, Sao Tome, Sierra Leone. Horizontal axis label, Mean of youth who voted in the last national elections. Horizontal axis tick labels: 0, 0.2, 0.4, 0.6, 0.8. Bar end values shown for each country in the same order: Sudan 0.32; Cote d Ivoire 0.34; Cameroon 0.34; Morocco 0.36; Gabon 0.38; Angola 0.45; Tunisia 0.46; Algeria 0.47; Botswana 0.48; Congo comma Rep comma 0.48; Mauritania 0.49; Lesotho 0.49; Mali 0.49; South Africa 0.49; Senegal 0.50; Ethiopia 0.53; Gambia 0.53; Zimbabwe 0.55; Namibia 0.56; Zambia 0.59; Madagascar 0.60; Burkina Faso 0.61; Kenya 0.61; Uganda 0.65; Nigeria 0.65; Tanzania 0.66; Mozambique 0.67; Cabo Verde 0.67; Niger 0.69; Malawi 0.69; Egypt 0.70; Ghana 0.71; Benin 0.71; Liberia 0.75; Guinea 0.75; Mauritius 0.76; Togo 0.76; Burundi 0.83; Sao Tome 0.83; Sierra Leone 0.84.
Proportion of Youth Across Countries Who Have Ever Attended a Demonstration (0–1)

Figure 2 Long description
Horizontal bar graph with country names on the vertical axis and, x axis label, Mean of youth attendance at demonstrations or protests. The x axis shows tick labels 0, 0.1, 0.2, 0.3. Bar labels by country, top to bottom: Madagascar 0.03. Zimbabwe 0.03. Tanzania 0.04. Burundi 0.04. Sierra Leone 0.06. Malawi 0.06. Congo, Rep. 0.07. Zambia 0.07. Gambia 0.08. Uganda 0.08. Ghana 0.09. Mauritius 0.09. Kenya 0.10. Botswana 0.10. Cote d′Ivoire 0.10. Algeria 0.11. Guinea 0.11. Angola 0.11. Togo 0.12. Niger 0.12. Mozambique 0.12. Namibia 0.12. Benin 0.12. Lesotho 0.13. Liberia 0.14. Cameroon 0.14. Sao Tome 0.14. Mauritania 0.14. Morocco 0.16. Mali 0.16. Cabo Verde 0.17. Burkina Faso 0.18. Senegal 0.19. Nigeria 0.19. Egypt 0.20. Gabon 0.21. South Africa 0.23. Tunisia 0.24. Ethiopia 0.25. Sudan 0.29.
Variable operationalisation: explanatory variables
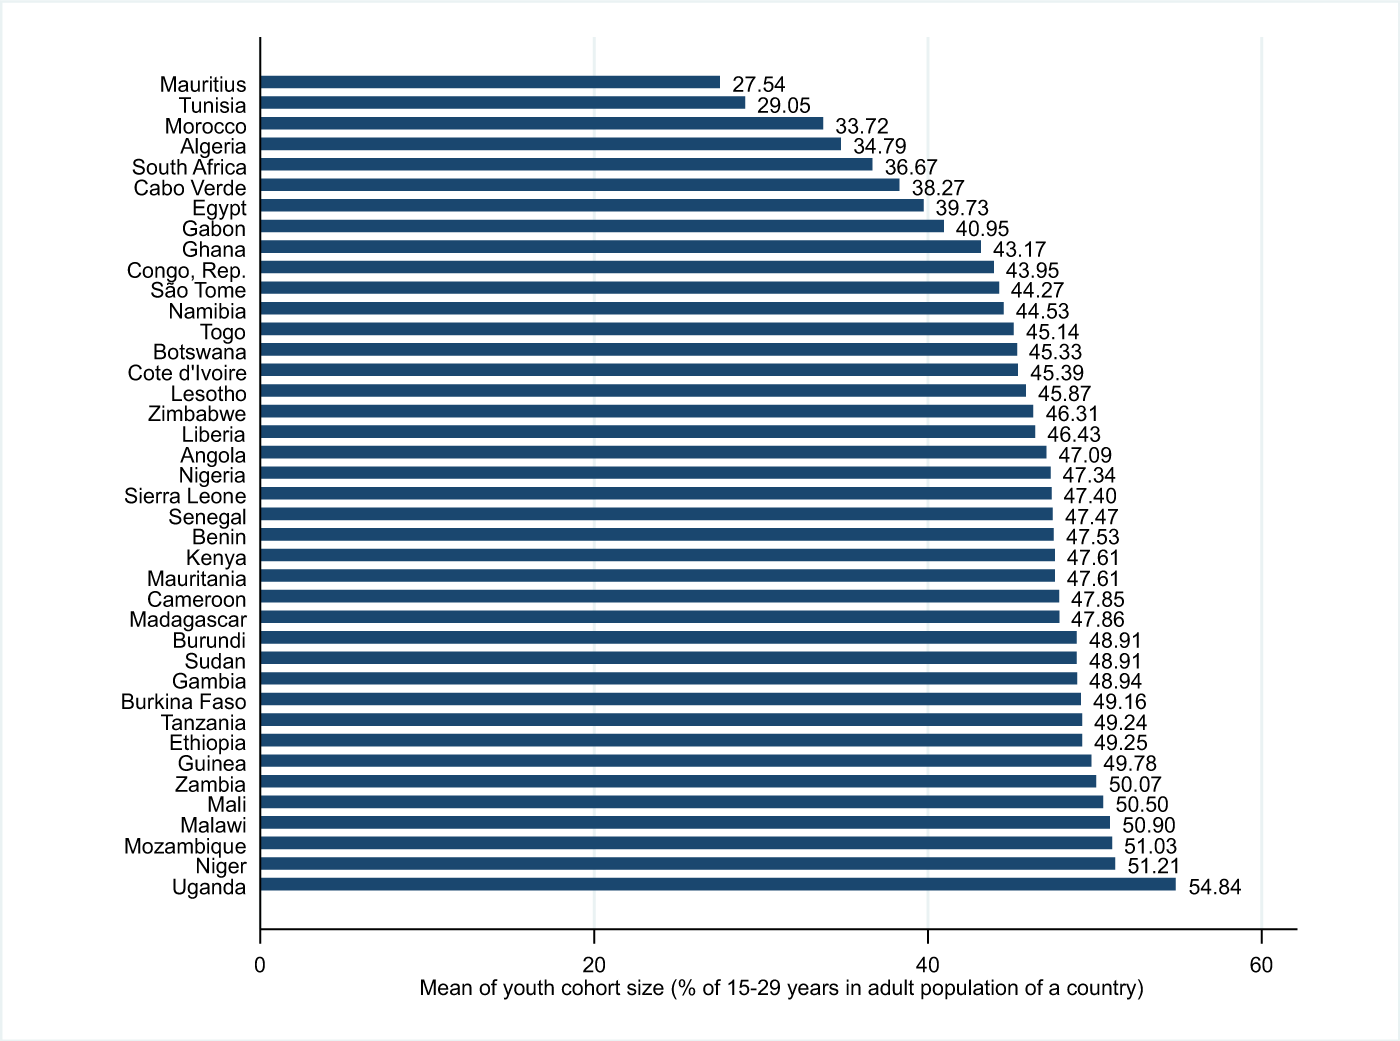
The main explanatory variables in the study were the youth cohort size and social media usage by African youth. We operationalised youth cohort size as the percentage ratio of individuals aged 15–29 to the total adult population (15 years and older) in a country. This measure, widely used in prior research, is considered more effective in capturing the demographic dynamics of youth than narrower definitions with lower age cut-offs, such as 15–24 years (Korotayev et al. Reference Korotayev, Romanov, Zinkina and Slav2022; Nkansah and Bartha Reference Nkansah and Bartha2023; Weber Reference Weber2013). As a country-level variable, the youth cohort size value was applied uniformly to all respondents within each country. Across the sample, the mean youth cohort size was 46%, with a standard deviation of 5.5. Averaging across all survey rounds, Mauritius had the lowest mean youth cohort size (27.5%), while Uganda had the highest (54.8%), meaning that in Mauritius only 27% of the adult population were between 15 and 29 years old between 2016 and 2023, whereas in Uganda, more than half of the population was in the same age range. Figure 3 presents the average size of youth cohorts across all rounds for each of the 40 countries included in the analysis.
Mean Youth Cohort Size Across Countries (%)

Figure 3 Long description
Horizontal bar graph with country names on the vertical axis and the horizontal axis labeled, Mean of youth cohort size left parenthesis percent of 15 minus 29 years in adult population of a country right parenthesis. Horizontal axis range 0 to 60. Bar values by country, as labeled at bar ends: Mauritius 27.54. Tunisia 29.05. Morocco 33.72. Algeria 34.79. South Africa 36.67. Cabo Verde 38.27. Egypt 39.73. Gabon 40.95. Ghana 43.17. Congo, Rep. 43.95. Sao Tome 44.27. Namibia 44.53. Togo 45.14. Botswana 45.33. Cote d′Ivoire 45.39. Lesotho 45.87. Zimbabwe 46.31. Liberia 46.43. Angola 47.09. Nigeria 47.34. Sierra Leone 47.40. Senegal 47.47. Benin 47.53. Kenya 47.61. Mauritania 47.61. Cameroon 47.85. Madagascar 47.86. Burundi 48.91. Sudan 48.91. Gambia 48.94. Burkina Faso 49.16. Tanzania 49.24. Ethiopia 49.25. Guinea 49.78. Zambia 50.07. Mali 50.50. Malawi 50.90. Mozambique 51.03. Niger 51.21. Uganda 54.84.
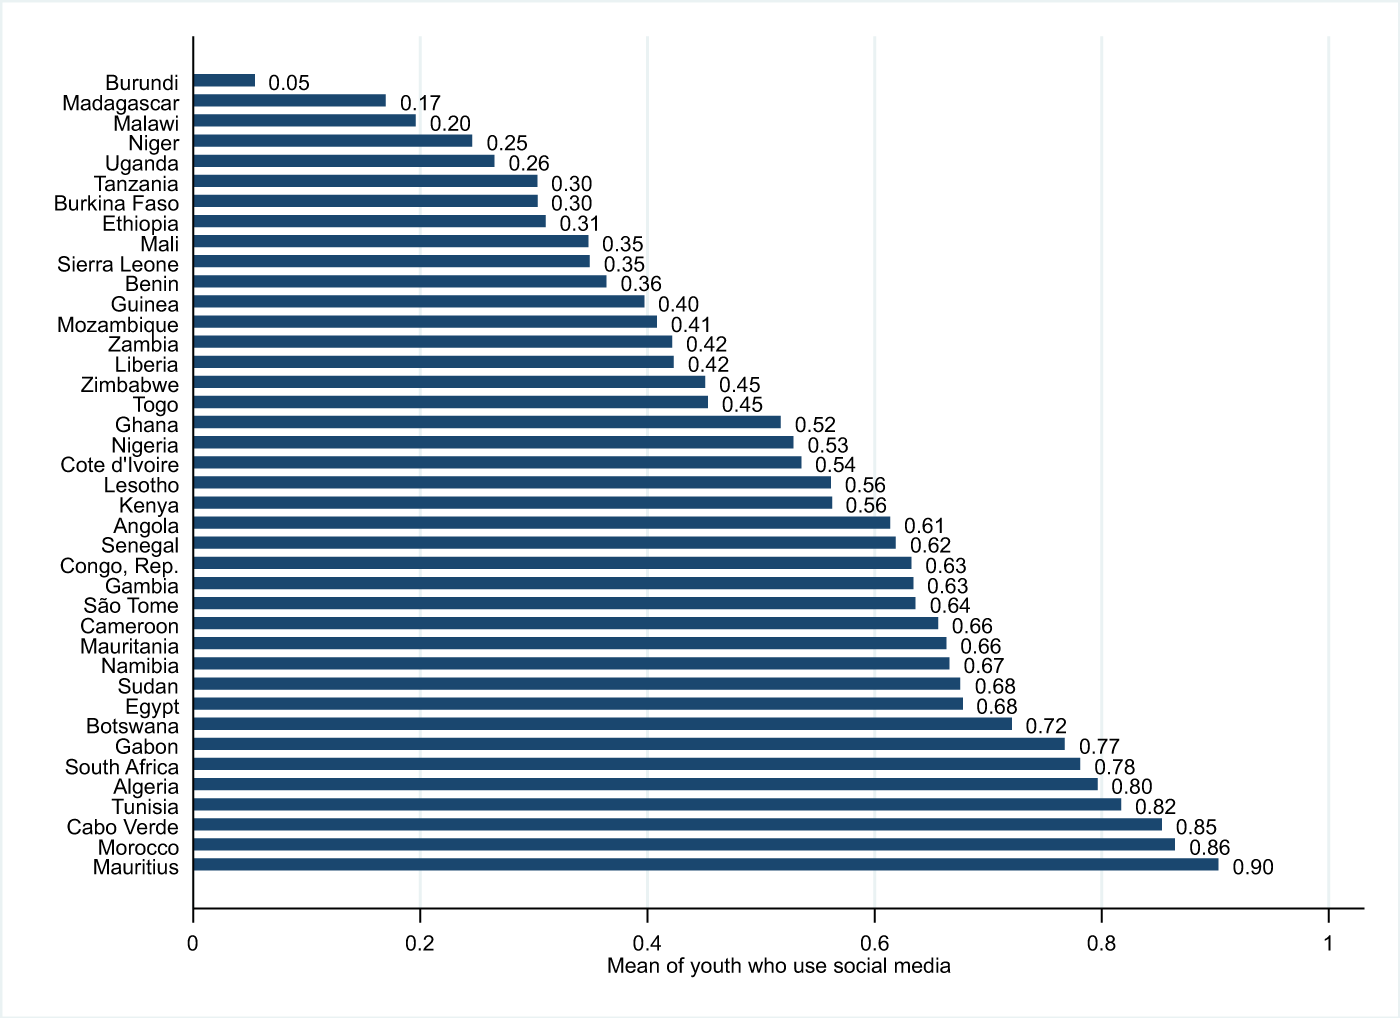
We operationalise social media use with a focus on the frequency of usage. Social media use was recoded into a three-category variable representing three groups: 0 for those who never use social media, 1 for those who use it sometimes/occasionally and 2 for those who use it every day. A total of 48.96% of African youth reported that they never use social media, while 20.50% use it sometimes, and 31.54% use it every day. Figure 4 shows the distribution of youth respondents who use social media, either occasionally or every day, across all four survey rounds. Additionally, Table 2 shows the trends in social media usage per survey round.
Proportion of Youth Across Countries Who Use Social Media Occasionally or Daily (0–1)

Figure 4 Long description
The horizontal bar graph lists countries on the vertical axis and, mean of youth who use social media, on the horizontal axis. The horizontal axis ranges from 0 to 1 with tick labels at 0, 0.2, 0.4, 0.6, 0.8 and 1. Bar values by country from top to bottom: Burundi 0.05. Madagascar 0.17. Malawi 0.20. Niger 0.25. Uganda 0.26. Tanzania 0.30. Burkina Faso 0.30. Ethiopia 0.31. Mali 0.35. Sierra Leone 0.35. Benin 0.36. Guinea 0.40. Mozambique 0.41. Zambia 0.42. Liberia 0.42. Zimbabwe 0.45. Togo 0.45. Ghana 0.52. Nigeria 0.53. Cote d Ivoire 0.54. Lesotho 0.56. Kenya 0.56. Angola 0.61. Senegal 0.62. Congo, Rep 0.63. Gambia 0.63. Sao Tome 0.64. Cameroon 0.66. Mauritania 0.66. Namibia 0.67. Sudan 0.68. Egypt 0.68. Botswana 0.72. Gabon 0.77. South Africa 0.78. Algeria 0.80. Tunisia 0.82. Cabo Verde 0.85. Morocco 0.86. Mauritius 0.90.
Social Media Usage per Survey Round

Table 2 Long description
Social media use is reported by survey round, with counts and percentages for never, sometimes, and every day, plus totals. Round 6 in 2016 lists never 11,349 at 59.79 percent, sometimes 3,596 at 18.94 percent, and every day 4,038 at 21.27 percent, total 18,983 at 100.00 percent. Round 7 in 2019 lists never 8,834 at 52.65 percent, sometimes 3,357 at 20.01 percent, and every day 4,589 at 27.35 percent, total 16,780 at 100.00 percent. Round 8 in 2022 lists never 6,741 at 41.11 percent, sometimes 3,676 at 22.42 percent, and every day 5,981 at 36.47 percent, total 16,398 at 100.00 percent. Round 9 in 2023 lists never 6,939 at 40.81 percent, sometimes 3,548 at 20.87 percent, and every day 6,517 at 38.33 percent, total 17,004 at 100.00 percent. The total across all rounds is never 33,863 at 48.96 percent, sometimes 14,177 at 20.50 percent, and every day 21,125 at 30.54 percent, total 69,165 at 100.00 percent.
Table 2 indicates that the share of African youth who have never used social media declined by 19 percentage points, falling from 60% in 2016 to 41% in 2023. Over the same period, the proportion of daily social media users rose by 17 percentage points, increasing from 21% to 38%. This trend suggests that an increasing number of young Africans are engaging actively on social media over time – a development that may have significant implications for their political behaviour, as theorised in this article.
Control variables
We control for variables that were previously identified as strongly predictive of voting and participation in demonstrations. Individual-level socio-demographic variables such as age, education and gender have all been reported in previous research to significantly influence political participation (Bratton et al. Reference Bratton, Mattes and Gyimah-Boadi2004; Kitanova Reference Kitanova2019). A person’s religion is also believed to significantly influence political engagement such as voting (Kotler-Berkowitz Reference Kotler-Berkowitz2001).
Well-documented predictors of political participation, such as employment status, civic engagement including participation in community groups and meetings, and interest in political issues, all of which are cardinal components of the Civic Voluntarism Model of political participation, were duly controlled for (Brady et al. Reference Brady, Verba and Lehman Schlozman1995; Dalton Reference Dalton2009; Verba et al. Reference Verba, Lehman Schlozman and Brady1995). The study also accounted for a person’s satisfaction with democracy, given the long-standing debate on the influence of satisfaction with democracy on people’s political participation (Claassen and Magalhães Reference Claassen and Magalhães2022; Doorenspleet Reference Doorenspleet2012; Magalhães Reference Magalhães2014).
Given that social media usage is inherently linked to internet access and infrastructure, we also controlled for internet use, as self-reported by respondents in the Afrobarometer survey. This ensured that our analysis properly accounted for the usage of internet services, which could influence the relationship between social media and political behaviour. Overall, our approach aimed to isolate the net effects of our two explanatory variables on our two dependent variables while controlling for individual-level confounding factors. To enhance interpretability, all categorical variables were recoded appropriately. The Supplementary Material provides a detailed breakdown of the recoding process for all variables.
At the country level, the analysis accounted for the quality of democracy using V-Dem’s Liberal Democracy Index as a proxy for the political context of countries (Kitanova Reference Kitanova2019). We also accounted for economic development, measured by GDP per capita at purchasing power parity (log-transformed to reduce residual variance) (Dalton and van Sickle Reference Dalton and van Sickle2005; Dalton and Welzel Reference Dalton and Welzel2014). As an innovative addition, we controlled for internet coverage at the country level, measured by the proportion of the population using the internet. This variable was considered theoretically relevant due to its role in shaping social media usage among youth across Africa. By incorporating this measure, we aimed to capture the broader structural factors that influence digital access and engagement. Further details on the nature and distribution of all country-level variables are available in the Supplementary Material.
Methods
Our analysis utilised random-intercept multilevel binary logistic regression modelling with country-clustered standard errors. We controlled for survey round-fixed effects for the main models in order to capture time-related shocks (period effects), changes in measurement, and other secular trends that could confound the relationship between the explanatory and dependent variables. This helps to reduce omitted-variable bias from unobserved time effects that are common to all countries or respondents in a given year. We also estimated country-fixed effects for our robustness checks for the main results.
Due to the hierarchical structure of the dataset with individuals nested within countries, and the binary nature of the dependent variables, we opted for random-intercept models. The intra-class correlation (ICC) tests showed that the variance between countries was 8% and 3% for the models for voting and demonstrations, respectively. While the ICC for the model for demonstrations was below the 5% threshold recommended for multilevel modelling, which would suggest using standard binary logistic regression, we nevertheless decided to use the random-intercept multilevel modelling approach for both dependent variables due to the theoretical interest of the article on variations between countries and the empirical structure of the dataset. Admittedly, given the low ICC values, especially for the model for demonstrations, variations in the dependent variables will likely be due more to individual-level characteristics of the youth respondents than our selected country-level variables. In other words, we acknowledge that individual-level attributes may play a more substantial role in explaining the voting and protest behaviour of African youth than country-level characteristics. Consequently, our interpretation of the results carefully considers the potentially limited influence of youth cohort size and other country-level variables in the estimations.
For the interaction hypotheses, the analysis compared results from both standard interaction plots and non-linear marginal effect estimations using the kernel estimation technique (Hainmueller et al. Reference Hainmueller, Mummolo and Xu2019). This approach ensures more reliable predicted probability plots for significant interactions. Our modelling followed a sequential approach, beginning with additive models and progressively incorporating interaction terms to assess their effects on the two dependent variables.
Relatedly, we report a variance inflation factor (VIF) of 2.01, indicating a low likelihood of multicollinearity among the independent variables, implying that the variances of the estimated regression coefficients are not substantially inflated in the models. Detailed results of the correlation matrix are provided in the Supplementary Material of the study.
Results
Descriptive statistics
Table 3 shows the trend in voting and protest participation among African youth in the study since 2016. While electoral participation was notably high among the youth by 2016 (71%), participation sharply declined by 2023 (50%). Participation in demonstrations, however, remained constant at around 13%, except for a spike in 2022. We reflect on these findings in our discussions.
Proportion of Youth Engagements Across Dependent Variables

Table 3 Long description
Proportion of respondents in percent is reported for two activities across 2016 Round 6, 2019 Round 7, 2022 Round 8, 2023 Round 9, and a mean for 2016 to 2023. For voting in elections, values are 70.87 in 2016 Round 6, 71.64 in 2019 Round 7, 50.18 in 2022 Round 8, and 50.26 in 2023 Round 9, with a mean of 59.33. For attending protests, values are 11.00 in 2016 Round 6, 12.12 in 2019 Round 7, 18.47 in 2022 Round 8, and 10.36 in 2023 Round 9, with a mean of 12.89.
Additive models: direct effect of youth cohort size and social media usage
The two explanatory variables demonstrated important differences in their direct effects on voting and participation in demonstrations by African youth. Youth cohort size, contrary to theoretical expectations, showed a marginal but highly significant positive effect on young people’s propensity to vote in national elections (β = 0.074, p < 0.001), but surprisingly did not significantly influence young people’s likelihood of attending demonstrations. By contrast, social media usage by youth showed a more consistent and strong effect on both voting and protest behaviour. Compared to peers who do not use social media, young people who either occasionally use social media (β = −0.169, p < 0.001) or always use social media (β = −0.108, p < 0.01) were significantly less likely to vote in elections. Both occasional users of social media (β = 0.226, p < 0.001) and daily users of social media (β = 0.211, p < 0.001) were, however, significantly more likely to join a protest compared with their peers who do not use social media. In summary, using social media increases the likelihood of young Africans engaging in protests and demonstrations while simultaneously reducing their likelihood of voting in elections. Conversely, being part of a large youth cohort increases the likelihood of electoral participation by African youth.
Interaction effects of youth cohort size and social media usage
Following our theoretical expectations in H3, we interacted the two explanatory variables to assess whether their combination produces unique or amplified effects on the dependent variables. We found a statistically significant negative effect for the interaction between social media usage and youth cohort size on voting. The analysis shows that young people who live in a country with a large youth cohort and who use social media every day are less likely to vote in elections (β = −0.022, p < 0.01). Moreover, occasional users of social media who live in a country with a large youth cohort are more likely to participate in demonstrations (β = 0.021, p < 0.01). Both interactions can be described as marginal in their effect sizes, which is not surprising given the relatively limited overall effects of youth cohort size in the analysis. Table 4 presents the results of the analysis.
Results of Random-Intercept Multilevel Binary Logistic Analysis

Table 4 Long description
Four multilevel binary logistic models report coefficients with clustered standard errors for two outcomes: voting in national elections and attending demonstrations, each with a main model and an interaction model. For voting, youth cohort size is 0.074 with standard error 0.013 in the main model and 0.095 with standard error 0.015 in the interaction model. For demonstrations, youth cohort size is minus 0.023 with standard error 0.014 in the main model and minus 0.030 with standard error 0.015 in the interaction model. Social media use sometimes is minus 0.169 with standard error 0.034 for voting and 0.226 with standard error 0.043 for demonstrations in the main models; in the interaction models it is 0.227 with standard error 0.286 for voting and minus 0.729 with standard error 0.345 for demonstrations. Social media use every day is minus 0.108 with standard error 0.038 for voting and 0.211 with standard error 0.048 for demonstrations in the main models; in the interaction models it is 0.888 with standard error 0.245 for voting and minus 0.037 with standard error 0.290 for demonstrations. Interaction terms in the interaction models are minus 0.008 with standard error 0.006 and minus 0.022 with standard error 0.005 for youth cohort size with social media use sometimes and every day in the voting model, and 0.021 with standard error 0.007 and 0.005 with standard error 0.006 in the demonstrations model. Selected controls include age at 0.155 with standard error 0.003 for voting and minus 0.019 with standard error 0.004 for demonstrations in both model types, and discuss politics at about 0.256 with standard error 0.027 for voting and about 0.508 with standard error 0.029 for demonstrations. Model characteristics list 53,745 observations for voting models and 61,911 for demonstrations models, with 40 countries in all models, and mean variance inflation factor of 2.01 in all models.
Notes: Entries are the logistic regression coefficients and standard errors clustered at the country level (in parentheses) for multilevel binary logistic models. Models were estimated using individual-level data on young people’s political attitudes and participation, drawn from Afrobarometer Rounds 6–9. Reference category: 1 = never use social media; 2 = male; 3 = rural; 4 = no education; 5 = unemployed; 6 = do not discuss politics; 7 = never use internet; 8 = do not attend community meetings; 9 = no religion; 10 = country is not democratic; 11 = Round 6 (2016).
*** p ≤ 0.001,
** p ≤ 0.01,
* p ≤ 0.05.
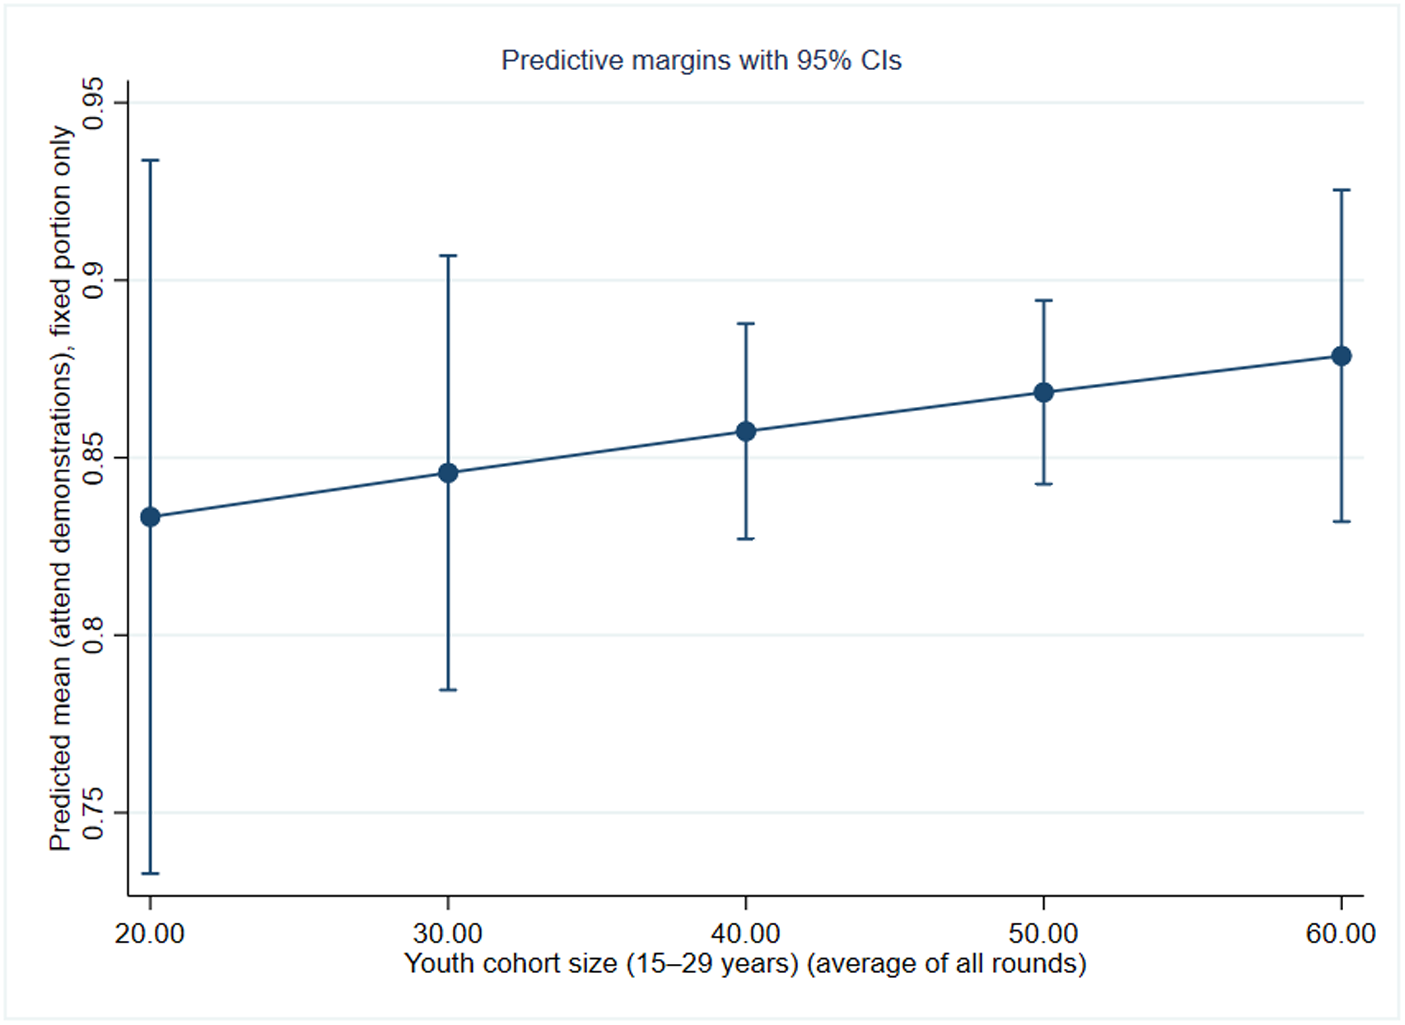
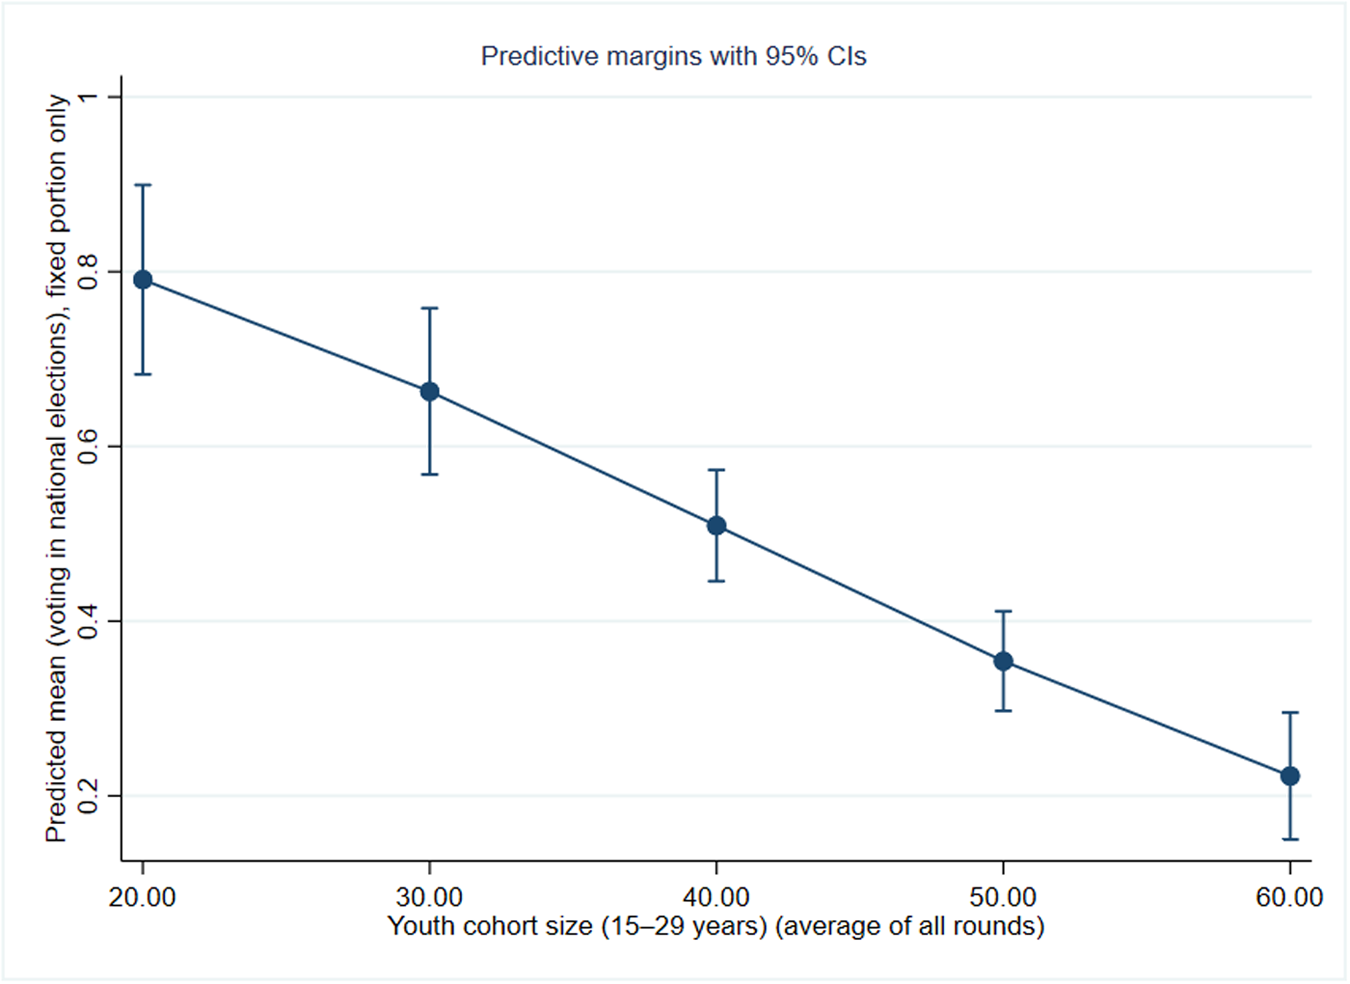
The standard multiplicative predicted probability plot for the two significant interaction effects of youth cohort size and occasional or daily social media use on the propensity of young Africans to join demonstrations and to vote in elections, respectively, are seen in Figures 5 and 6.
Predicted Standard Probability Plot of the Interaction Between Youth Cohort Size and Occasional Use of Social Media on the Likelihood of Young People Participating in Demonstrations (0–1)

Predicted Probability Plot of the Interaction Between Youth Cohort Size and Daily Use of Social Media on the Likelihood of Young People Voting in Elections (0–1)

Figure 5 illustrates a positive linear marginal effect resulting from the interaction between social media use and the youth cohort size on young people’s likelihood of engaging in demonstrations or protests. Essentially, as the youth population increases and social media is used even occasionally by young people, their inclination to protest or demonstrate rises. Conversely, Figure 6 shows that a growing youth cohort combined with daily social media use is linked to a higher likelihood of voter apathy among youth.
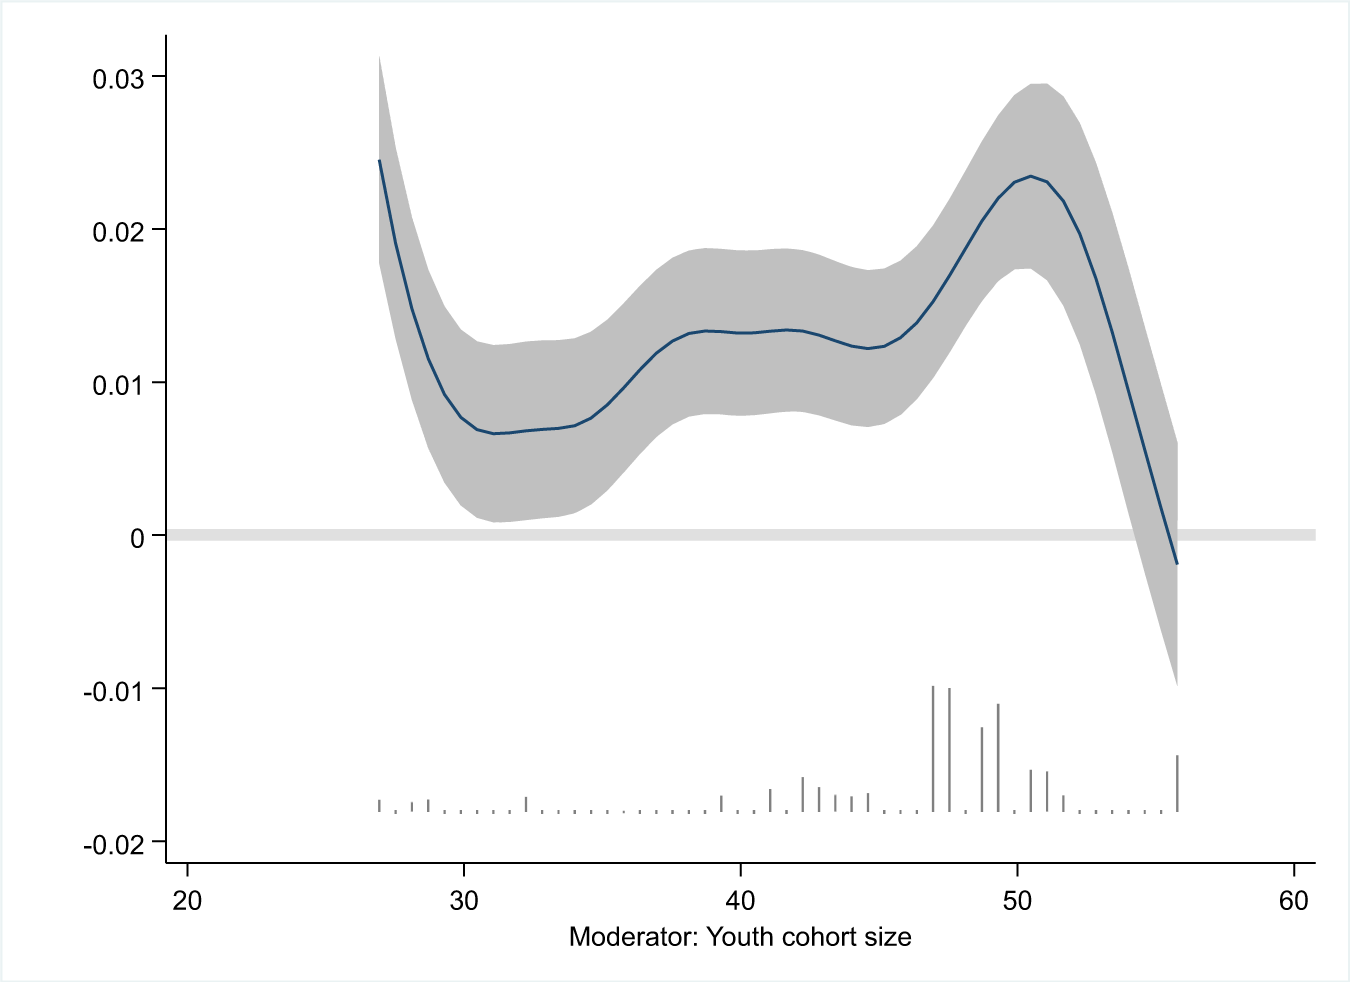
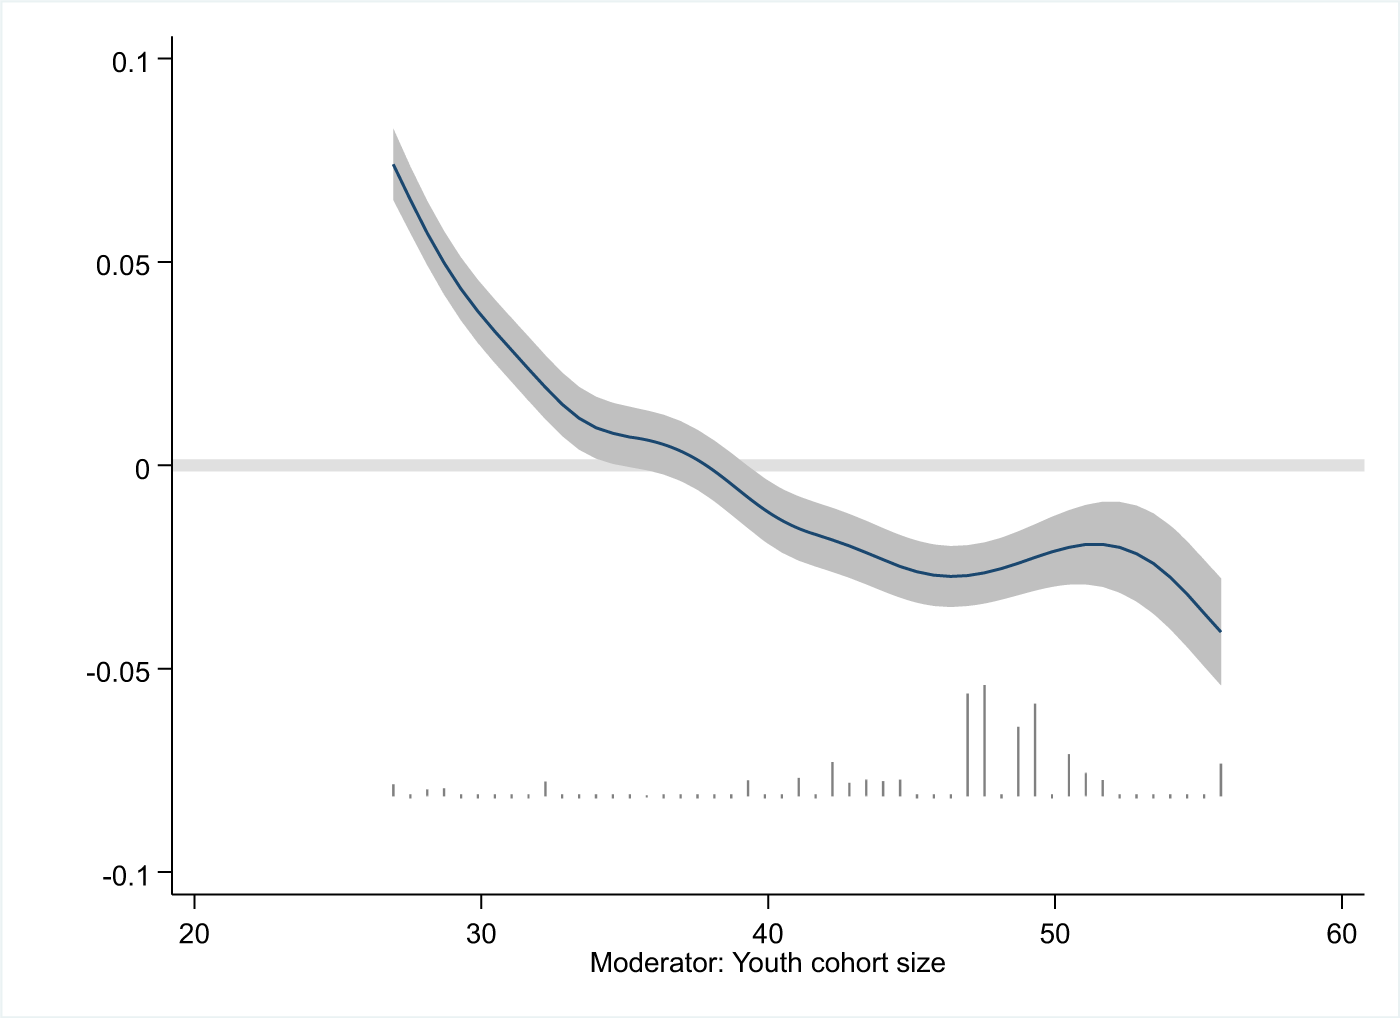
In light of recent criticisms of standard multiplicative interaction plots, which often assume linearity in marginal effects, as illustrated in Figures 5 and 6, we tested the possibility that the underlying data distributions of the interaction variables might not satisfy this assumption. To address this, we re-estimated the marginal effects for the two interactions using non-linear estimation techniques, as recommended by Hainmueller et al. (Reference Hainmueller, Mummolo and Xu2019), specifically employing kernel-based methods. Figures 7 and 8 present the non-linear marginal effect plots for the interaction between occasional social media use and youth cohort size on demonstrations, and between daily social media use and youth cohort size on voting, respectively.
Non-linear Marginal Effect Estimation for the Interaction of Occasional Social Media Use and Youth Cohort Size on Young People’s Likelihood of Participating in Demonstrations

Non-linear Marginal Effect Estimation for the Interaction of Daily Social Media Use and Youth Cohort Size on Young People’s Likelihood of Voting in Elections

Figure 7 reveals that the positive interaction effect between occasional social media use and youth cohort size on the likelihood of participating in demonstrations is non-linear, contradicting the linear pattern observed in Figure 5. This non-linearity appears to be sensitive to the uneven distribution of youth cohort sizes across African countries. Notably, the joint effect of these two variables is positive only when the youth cohort size is between 30% and 50% of the total adult population. Put differently, young people who live in a society where the youth cohort is larger or smaller and use social media occasionally are less likely to engage in demonstrations.
In contrast, Figure 8 aligns closely with the findings in the standard multiplicative plot in Figure 6, indicating strong consistency. This suggests that the data distribution underlying the interaction between daily social media use and youth cohort size generally supports the conclusion that young people in countries with a large youth cohort who use social media daily are significantly less likely to vote in elections compared with their peers who are regular social media users in countries with a relatively smaller youth cohort size.
Direct effects of control variables
The control variables reveal several additional patterns. Older respondents within the youth cohort were more likely to vote, whereas younger individuals were more likely to participate in protests or demonstrations. Women were significantly less likely than men to vote or engage in protests. Urban youth were less likely to vote, but more likely to protest than their peers in rural areas. Education also mattered, with secondary education being the most consistent predictor of participation. Surprisingly, employment status was not significantly associated with protesting, but employed youth were more likely to vote. Discussing politics and attending community meetings both increased the likelihood of youth participating in both voting and protests. By contrast, both daily and occasional use of the internet by young people did not significantly affect their likelihood of voting or of joining a demonstration. Religion played a minimal role in shaping behaviours, with only Christianity affecting the likelihood of voting. Importantly, young people living in democratic African countries were more inclined to vote in elections, whether or not they were satisfied with democracy, compared with their peers in non-democratic countries.
At the country level, the quality of a country’s democracy emerged as the most consistent predictor of political participation. The results suggest that as a country becomes more democratic, the youth demonstrate a stronger proclivity to protest, but a lower propensity to vote in elections. Expanding internet access, however, does not significantly affect young people’s tendency to vote or protest. A higher level of economic development was positively and significantly associated with voting, but not with the likelihood of young people protesting. Table 4 provides the summary findings for all the control variables in the models.
Robustness checks for additive and interaction models
To assess the robustness of both the additive and interaction models, we re-estimated all models by incorporating country-fixed effects in addition to the survey round-fixed effects already controlled for in the models. This approach allowed us to account for both period-related shocks and unobserved, time-invariant, country-specific characteristics. Our focus was to determine whether the primary explanatory variables – youth cohort size and social media use – retain their effects under these stricter conditions. The results indicate that the direct effects of the two explanatory variables, as well as their interaction effects, remain robust across all models under such stricter conditions, with the net effect of youth cohort size even increasing marginally in the case of voting in national elections. We present the summary of these results in Table 5, and the full details in Tables 6–9 in the Supplementary Material. Additionally, we conducted robustness tests using parsimonious models to examine the sensitivity of the interaction results when only individual-level control variables are included. The analysis shows that the results of the interaction effects are robust even under such parsimonious conditions. The results are presented in Tables 10 and 11 of the Supplementary Material.
Robustness Checks with Country-Fixed Effects for Additive and Interaction Models

Table 5 Long description
Coefficients with standard errors in parentheses are reported for two outcomes, vote in national elections and attend demonstrations, each shown for a main effects model and an interaction model. Youth cohort size is 0.096 with standard error 0.015 for voting and minus 0.014 with standard error 0.017 for demonstrations; in the interaction model it is 0.119 with standard error 0.016 for voting and minus 0.021 with standard error 0.018 for demonstrations. For social media use, sometimes is minus 0.169 with standard error 0.034 for voting and 0.222 with standard error 0.043 for demonstrations; in the interaction model it is 0.256 with standard error 0.286 for voting and minus 0.704 with standard error 0.350 for demonstrations. Social media use every day is minus 0.107 with standard error 0.038 for voting and 0.207 with standard error 0.050 for demonstrations; in the interaction model it is 0.929 with standard error 0.250 for voting and minus 0.028 with standard error 0.292 for demonstrations. Interaction terms are listed only in the interaction model: youth cohort size with occasional social media use is minus 0.009 with standard error 0.006 for voting and 0.020 with standard error 0.007 for demonstrations, and youth cohort size with daily social media use is minus 0.023 with standard error 0.005 for voting and 0.004 with standard error 0.006 for demonstrations. Rows at the bottom indicate that all individual level and country level control variables are included, and that survey round fixed effect and country fixed effect are included.
Note: Reference category: 1 = never use social media.
Discussion and conclusions
Young Africans will shape the trajectory of politics across the continent in one way or another for decades to come. Yet despite the demographic and political significance of this group, we still know little about the factors that shape their political behaviour. Existing research has largely focused on individual-level predictors such as education, gender and socio-economic status. Complementing this work, our study examined how broader structural transformations, specifically youth cohort size and social media use, independently and jointly affect young citizens’ political expression.
Our findings underscore both continuity and change in youth political participation. Young Africans do participate in elections, with an average turnout of 59% between 2016 and 2023. This figure obscures a substantial decline, however, from about 70% in 2016 to 50% in 2023 (Table 3). Protest participation, by contrast, remained relatively constant at 13%. Whether this declining engagement with elections reflects behavioural change, disillusionment with the performance and socio-economic dividend of democratic institutions, or a deeper erosion of trust that voting will contribute to political change remains an open question. Although our analysis does not seek to explain this broader decline of youth electoral participation as such, the downward trend raises concerns about the long-term legitimacy and stability of formal democratic institutions across African countries.
Consistent with earlier studies, our results show that individual-level socio-demographic factors remain important predictors of participation (Resnick and Casale Reference Resnick and Casale2014; Tambe and Kopacheva Reference Tambe and Kopacheva2024). Yet our analysis also reveals that structural contexts such as cohort size and social media use play an additional and independent role in shaping African youth political expressions. Although the effect sizes are marginal, both youth cohort size and social media use influence voting and protest behaviour, and their interaction further conditions the likelihood of different forms of participation.
Contrary to conventional expectations, larger youth cohorts are associated with higher probabilities of voting, but not with protest participation. These findings challenge previous studies’ assumptions that youthful populations inherently fuel political unrest (e.g. Nkansah Reference Nkansah2022; Weber Reference Weber2013) and suggest that a large youth cohort may, under certain conditions, still trust and participate in formal political systems. One explanation for the divergence of our finding from previous research is that incorporating previously unmeasured confounders, such as internet coverage at the individual level and social media use, may have affected the net effect of youth cohort size on voting behaviour and the inclination to protest. Another possibility is that our study’s shorter timeframe (2016–2023), during which digital communication expanded rapidly, captures a different historical moment than earlier demographic analyses.
Importantly, however, the results of the robustness checks with country-fixed effects show that although the additive and fixed-effects models indicate a positive and significant association between youth cohort size and the likelihood of voting, country-specific estimates reveal that this association is negative in most countries. We think that this likely suggests a cross-level divergence: while countries with larger youth populations tend to exhibit higher aggregate levels of electoral participation, within countries, young Africans remain less likely to vote. In other words, the overall positive relationship may reflect between-country differences rather than a universal individual-level mechanism. Future research employing longitudinal designs could help disentangle the micro- and macro-dynamics and explore potential contextual moderators such as regime type, economic performance and political opportunity structures to illuminate mechanisms linking youth cohort size to electoral participation.
In line with our expectation, social media use is associated with greater protest activity and lower likelihood of voting. This pattern supports arguments that social media platforms can facilitate non-institutional forms of political expression while sometimes eroding trust in electoral processes, whether through exposure to disinformation, heightened political cynicism or the perceived inefficacy of elections (Agbele Reference Agbele2023; Valenzuela et al. Reference Valenzuela, Halpern, Katz and Miranda2019). These dynamics are consistent with arguments that digitally connected youth may be more inclined to participate in visible and direct forms of political expression.
The interaction between digital behaviour and demographic structure further refines this picture. Daily social media use in societies with a large youth cohort is associated with reduced electoral participation, while occasional use in contexts with medium-sized youth cohorts (30%–50%) increases the probability of protest participation (Figure 7). Although statistically marginal, these interaction effects suggest that political socialisation and protest behaviour do not increase linearly with larger youth populations. Instead, socialisation and mobilisation dynamics appear to be contingent on demographic thresholds, possibly related to saturation of peer influence, social constraints or political opportunity structures.
First, in contexts where the youth cohort dominates (i.e. more than 50%), structural constraints, including high unemployment rates or state repression, might dampen the ability or motivation to protest. Second, there might be selective socialisation. Occasional social media users may represent a more diverse and balanced cohort, potentially engaging with both offline and online civic spaces. In countries where the youth cohort remains moderate (30%–50%), this group may be most responsive to peer influence and mobilising content. Third, in countries with very large youth cohorts, youth may become overwhelmed, alienated or disengaged, limiting the effect of social media unless paired with strong offline organising structures.
Overall, these findings deepen theoretical debates in political demography and digital politics by highlighting how the political implications of social media use cannot be fully understood in isolation from demographic contexts. At the same time, our findings should be interpreted with caution, as we analyse the frequency of social media exposure and cannot distinguish between different social media platforms or between the kinds of political content to which users are exposed. Future work should therefore consider how demographic composition shapes exposure to, interpretation of and responsiveness to digital political cues, and how digital infrastructures alter traditional cohort-based socialisation processes. In particular, future studies could investigate more explicitly the role of peer-based socialisation, effects of different social media platforms and exposure to different forms of online content, including dis- and misinformation.
Finally, our findings warn of a deepening disengagement from electoral processes among African youth, particularly those embedded in societies with a large youth cohort and frequently using social media. If democratic legitimacy is to be maintained, political systems must find new ways to engage young citizens in offline and online spaces and address the ways in which digital culture is reshaping their political orientations and expectations. Strengthening youth inclusion therefore requires attention not only to socio-economic conditions but also to the broader demographic and digital environments in which political socialisation now unfolds.
Supplementary material
The supplementary material for this article can be found at https://doi.org/10.1017/gov.2026.10069.
Data availability
Replication data for the article are available at: https://doi.org/10.5281/zenodo.21931020.
Acknowledgements
The authors would like to thank two anonymous reviewers and the editors for their valuable feedback and suggestions.
Financial support
This study was supported by the German Federal Foreign Office, the German Federal Ministry of Defence and the German Federal Ministry of Economic Cooperation and Development
Disclosure statement
The authors report that there are no competing interests to declare.





 Open access

