INTRODUCTION
Theileria parva is a tick-transmitted intracellular protozoan parasite that causes the fatal lymphoproliferative disease of cattle known as East Coast Fever (ECF). ECF is prevalent in eastern, central and southern Africa and with a yearly estimated 24 million cattle at risk of infection, the annual costs directly attributable to the disease and associated control measures have been estimated at $169 million (Mukhebi et al. Reference Mukhebi, Perry and Kruska1992). Infective sporozoites of the parasite are inoculated into the dermis by infected ticks, and rapidly invade host lymphocytes (Fawcett et al. Reference Fawcett, Doxsey, Stagg and Young1982), where they differentiate to multinucleate schizonts and transform the infected cell to a state of uncontrolled proliferation. The parasite divides synchronously with the cell during mitosis, so that each daughter cell retains the infection. Disease arises from invasion of lymphoid and non-lymphoid tissues with parasitized lymphoblasts and results in death of susceptible cattle within 3 weeks of infection.
Cattle can be immunized against ECF by inoculation with sporozoites and simultaneous treatment with long-acting formulations of oxytetracycline (Radley, Reference Radley, Irvin, Cunningham and Young1981). Large-scale deployment of this infection and treatment vaccine requires preparation of bulk sporozoite stabilates, which are derived from triturated infected ticks (GUTS or ground up tick stabilate). Sporozoite dose is an important factor in the success of the vaccine since too high a dose can result in severe disease or necessitate further antibiotic treatment. The dose of individual stabilates has traditionally been determined on the basis of in vivo titrations in cattle. This relatively inefficient and time-comsuming process requires large groups of animals because of individual variation in susceptibility to infection (Pipano et al. Reference Pipano, Morzaria, Spooner and Shkap2004).
Cultures of schizont-infected cells are readily established from aspirates of infected lymph nodes or peripheral blood mononuclear cells infected with sporozoites in vitro (Malmquist et al. Reference Malmquist, Nyindo and Brown1970; Brown et al. Reference Brown, Stagg, Purnell, Kanhai and Payne1973). Tissue culture-based titration methods alternative to in vivo titration have also been described (Brown, Reference Brown, Taylor and Baker1987; Wilkie et al. Reference Wilkie, Kirvar and Brown2002), although these are labour-intensive and lengthy procedures that can require up to 3 weeks for the assessment of the stabilate titre.
We have recently provided evidence for substantial attrition of parasitized cells in newly infected T. parva cultures (Rocchi et al. Reference Rocchi, Ballingall, MacHugh and McKeever2006), which suggests that culture-based titration provides an underestimate of sporozoite infectivity. We have therefore investigated the utility of intracellular staining and flow cytometry for quantification of the infectivity of sporozoite stabilates as an alternative to a tissue culture-based titration method.
MATERIALS AND METHODS
Source of animals and cells
Blood was collected in Alsever's solution by jugular venipuncture from healthy cattle free from ticks and tick-borne diseases and housed either at the International Livestock Research Institute of Nairobi (Kenya) campus or at the Moredun Research Institute of Edinburgh (UK). Peripheral blood mononuclear cells (PBMC) were prepared according to standard techniques and resuspended in culture medium (RPMI 1640 supplemented with 10% heat inactivated fetal calf serum (FCS), 2 mm L-glutamine, 100 units/ml penicillin, 50 μg/ml streptomycin and 5×10⁻⁵ m 2-mercaptoethanol) at density of 2×10⁶ cells/ml. The same donor animal was used for the same set of experiments. T. parva infected cell lines (TpL) were obtained by in vitro infection of PBMC with the Muguga stabilate of the parasite as described by Morrison (Morrison et al. Reference Morrison, MacHugh and Lalor1996) and subsequently propagated in vitro. Freshly isolated sporozoites of T. parva were used to infect PBMC for optimization of the cytoplasmic staining methodology, while PBMC infected with cryopreserved stabilates were used to evaluate the sensitivity of the method in comparison with the in vitro titration assay.
Sporozoites and stabilates
T. parva sporozoites of the ILRI stabilate (St) 3087, derived from the Muguga isolate of the parasite, were harvested from salivary glands dissected from infected nymphal Rhipicephalus appendiculatus ticks that had been pre-fed on rabbits for 5 days as described previously (Buscher et al. Reference Buscher, Morrison and Nelson1984). Infection levels in tick batches were assessed by counting infected acini in methyl green and pyronine-stained salivary gland smears (Walker et al. Reference Walker, McKellar, Bell and Brown1979) and sporozoite numbers were calculated assuming an average of 104 sporozoites per infected acinus. Sporozoites were resuspended at a density of 2×10⁶/ml in tissue culture medium and kept on ice until employed to infect PBMC.
Ground up sporozoite stabilates (GUTS), were prepared from infected R. appendiculatus ticks as described by Brown (Reference Brown, Taylor and Baker1987). Stabilates were cryopreserved in 7·5% glycerol as described by Cunningham et al. (Reference Cunningham, Brown, Burridge and Purnell1973). Stabilate 80 is also derived from the Muguga isolate of the parasite, while St72 was prepared from the Marikebuni isolate. Stabilate 64 is of indeterminate origin, but is genotypically distinct from both St80 and St72 (F. Katzer, personal communication). Initial concentrations were 2·5, 2·5 and 2 tick-equivalents (TE)/ml for stabilates (St) 64 and 72 and 80 respectively. Abundance (mean number of infected salivary gland acini per tick examined) was 8·5 and 78 respectively for stabilates 64 and 72 and prevalence (percentage of ticks infected), was 30 and 95% respectively. Abundance and prevalence data were unavailable for stabilate 80. Abundance and prevalence data were obtained counting 50 ticks for each stabilate.
In vitro infection of PBMC
One millilitre of PBMC suspension was mixed with an equal volume of freshly isolated T. parva sporozoites or 1 ml of equilibrated cryopreserved stabilates diluted 1:4 in culture medium and incubated at 37°C for 1 or 2 h respectively. Cells were then washed by centrifugation to remove salivary gland and other tick-related debris, resuspended in 2 ml of culture medium and transferred to a single well of a 24-well plate. Infected cultures were maintained at 37°C in a humidified atmosphere of 5% CO2 in air until harvested for immunofluorescence staining and flow cytometry. Established TpL were maintained by passage (1:5) every 3–4 days. Uninfected control cultures established by adding an equal volume of tissue culture medium to PBMCs were maintained under identical conditions.
Cytoplasmic staining
Intracytoplasmic staining of parasite schizonts was conducted using mAb IL-S40.2, which recognizes a conserved epitope in the amino-terminal of the Polymorphic Immunodominant Molecule (PIM), an abundant schizont surface antigen (Toye et al. Reference Toye, Nyanjui, Goddeeris and Musoke1996). Staining was preceded by fixation and permeabilization. Briefly, cells were harvested from 24-well plates, washed once in Dulbecco's PBS and fixed in PBS containing 4% paraformaldehyde (PFA) for 10 min at room temperature (RT). Fixed cells were washed once in PBS and permeabilized for 30 min at RT in permeabilization buffer (FACS buffer [PBS, 5% FCS, 0·02% NaN3], 0·1% Saponin) supplemented with 20% heat-inactivated goat serum. After permeabilization, cells were stained for 30 min at 4°C with mAb IL-S40.2 (mouse IgG2a) diluted 1:2000 in permeabilization buffer, washed twice and incubated in anti-mouse Ig-FITC conjugate (1:1000 in permeabilization buffer; Southern Biotech) for 30 min at 4°C. After 2 additional washes in permeabilization buffer and a final wash in PBS, cells were fixed in PBS-1% PFA and analysed on the flow cytometer within 24 h. Staining was performed in duplicate.
Flow cytometry
Sample data were acquired using a FACSCalibur flow cytometer equipped with a 488 nm argon-ion laser and analysed using the CellQuest (Becton Dickinson) software. Data from a minimum of 10 000 cells were acquired for each sample, with the exception of the samples used to investigate stabilate infectivity, where a minimum of 50 000 cells were analysed. A live gate was applied on forward (FSC) and side scatter (SSC) to eliminate debris and dead cells from the analysis. All fluorescence parameters were recorded with logarithmic amplification.
Flow cytometric evaluation of stabilate infectivity
To assess infectivity of cryopreserved stabilates of T. parva, PBMC were infected in vitro as previously described and stained for intracytoplasmic PIM at 48 and 72 h post-infection. For the 48 h staining we employed the same cell sample used for the LDA analysis (see below), where dead cells were removed by gradient centrifugation prior to staining. For the 72 h analysis cells were harvested from the plate and stained without removing dead cells. Negative control samples were prepared by staining the cells with an isotype-matched primary antibody (mouse IgG2a, clone X39, Becton Dickinson), while the positive control was an established TpL line stained with mAb IL-S40.2.
Limiting dilution analysis (LDA)
Limiting dilution analysis of stabilate infectivity was performed 48 h after infection. Cells were harvested from the 24-well plate and viable cells recovered by centrifugation over Ficoll-Paque (GE Healthcare UK, Chalfont St Giles) for 20 min at 550 g. Separated cells were assessed for viability by Trypan blue exclusion and suspended at a density of 3×10⁵ viable cells/ml in culture medium. This suspension was used to seed 96-well plates in aliquots of 100 μl/well, with 1 plate each at 3000 cells/well, 1000 cells/well, 300 cells/well, 100 cells/well, 30 cells/well and 10 cells/well. Each well then received 5×10⁴ irradiated (50 Gy) autologous PBMC filler cells in 100 μl of culture medium supplemented with 50% conditioned medium derived from an established T. parva-infected lymphoblast culture. Plates were incubated for 2–3 weeks at 37°C in a humidified atmosphere of CO2 in water and screened for the presence of positive wells of proliferating cells. The frequency of precursor infected cells was calculated by fitting the proportion of non-responding cultures to the zero order term of the Poisson distribution, as described by Teh et al. (Reference Teh, Harley, Philips and Miller1977).
RESULTS
Intracytoplasmic staining analysis
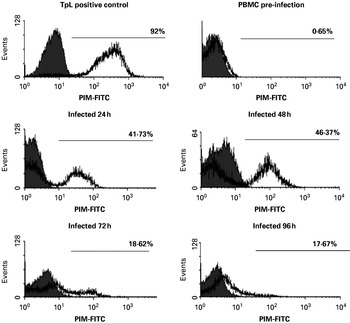
Intracytoplasmic staining analysis of an established TpL line using mAb IL-S40.2 revealed an average of 92% of cells staining positive for the presence of PIM (see Fig. 1). The background isotype control value was 0·03%.
Intracellular PIM staining in PBMC infected with freshly isolated sporozoites. Histograms of fluorescence of cells stained intracellularly with anti-PIM antibody IL-S40.2 and corresponding isotype control. PBMC were analysed over time after in vitro infection with freshly isolated sporozoites. Pre-infection negative control and positive control (TpL line) are also shown. Filled histogram (grey): isotype control. Open histogram: anti-PIM antibodies. Positive populations are identified by the horizontal marker and the corresponding percentage of positive cells is indicated.

The staining procedure was then tested on PBMCs infected with freshly isolated sporozoites, at different times after infection, to follow the appearance of the newly formed schizont and to confirm the suitability of the method for analysis of stabilate infectivity. As is shown in Fig. 1, PIM+ve cells were observed as soon as 24 h post-infection as a separate and clearly identifiable peak representing 41·73% of viable cells. The percentage of PIM+ve cells fluctuated during the following 3 days, with an increase at 48 h followed by a decrease at 72 and 96 h post-infection. However, the percentage of PIM+ve cells at 21 days p.i. reached values of 70·41% (data not shown) with the positive population showing levels of antigen expression similar those observed in the positive control cell line.
Flow cytometric evaluation of stabilate infectivity
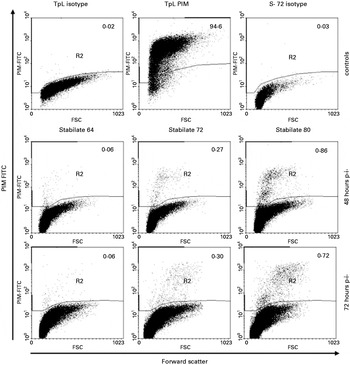
Having confirmed the suitability of the staining method to detect parasitized cells very soon after infection, we tested the detection sensitivity of the method in PBMC infected with cryopreserved stabilates, at 48 and 72 h post-infection. As shown in Fig. 2, acquisition of at least 50 000 events/sample and very low background staining of the negative controls (top row, left and right) allowed us to identify discrete clusters of PIM-positive cells at extremely low frequencies very early after infection. The isotype control values of the infected cells matched the background values observed in the TpL line.
Flow cytometric evaluation of stabilate infectivity. Representative dot plots of forward scatter versus fluorescence of PBMC infected in vitro with cryopreserved stabilates and tested for PIM positivity at 48 and 72 h post-infection as well as negative and positive controls. A minimum of 50 000 cells were acquired for each dot plot. The percentages of PIM+ve cells in each population are reported on each dot plot. The percentage of positive cells in the FACS analysis represents the percentage of PIM positive cells over the live cell population. This was calculated applying a forward and side-scatter gate to eliminate dead cells and debris from the analysis. The average background value for the isotype staining of stabilate-infected cells was 0·04±0·03%. S, Stabilate.

In all cultures, positive cells were identified both at 48 and 72 h p.i. but with different degrees of positivity. Stabilate 64 presented the lowest values of PIM positive cells (average 0·06% at both 48 and 72 h p.i.); stabilate 72 gave average values of 0·27 and 0·30% at 48 and 72 h p.i respectively whereas stabilate 80 showed the highest percentage of positive cells at both time-points (average 0·82 and 0·79% respectively). With the exception of stabilate 64, all the cultures and time-points showed clear clusters of positivity. Notably, at 48 h p.i. and only in the two stabilates with highest positivity, we observed the presence of 2 different populations of positive cells (dim and bright). This phenomenon was still present but less clear at 72 h p.i.
Limiting dilution analysis for evaluation of stabilate infectivity
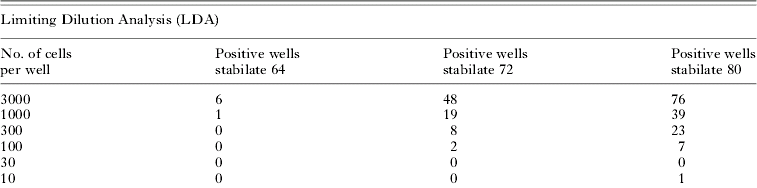
Table 1 shows the results of the limiting dilution analysis. Reported are the number of wells that scored positive for all 96 wells seeded and the corresponding frequencies and percentages of positive cells. Stabilate 80 gave rise to the highest proportion of infected wells, followed by stabilate 72, then stabilate 64. The precursor frequency of infected cells detected by the limiting dilution analysis was of 1/46034 for stabilate 64, 1/4337 for stabilate 72 and 1/1063 for stabilate 80.
Limiting dilution assay to evaluate stabilate infectivity and comparison with FACS analysis
(PBMC were infected in vitro and seeded for the LDA assay 48 h p.i. Cells/well indicate the number of cells initially seeded in each well of the two 96-well plates. Positive wells represent the number of wells where at least a positive cluster of growing cells was observed. In the LDA assay the precursor frequency and the percentage of infected cells (in parentheses) were calculated from the zero term of the Poisson distribution derived from the ln of the percentage of non-responding cultures plotted against the number of input cells. Percentage of infected cells in the LDA assay was calculated as follow=(1/n)×100. The lower part of the table reports the average percentages of infected cells obtained by FACS analysis at 48 and 72 h p.i. respectively.)
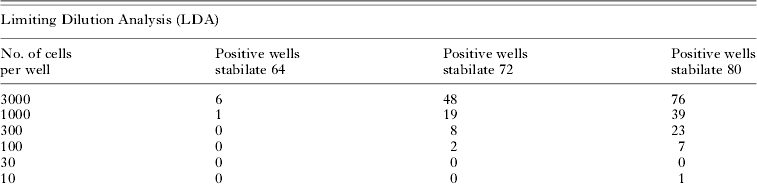

A comparison of the flow cytometric results with the LDA assay (as reported in Table 1) indicated a direct proportionality between the results obtained with the two assays and that the difference observed between the precursor frequencies of the two less potent stabilates and stabilate 80 in the LDA assay is also observed during the FACS analysis. The FACS analysis appeared more sensitive than the LDA assay, detecting at least 10 times more infected cells at both time-points.
The clearer visualization of a discrete cluster of PIM-positive cells by FACS analysis, combined with the correspondence between percentages of infected cells analysed by FACS and LDA suggests that FACS analysis at the 48 h time-point is appropriate for the evaluation of stabilate infectivity.
DISCUSSION
We describe a flow cytometric method that allows detection of intracellular schizonts of T. parva at the early stages of infection. The protocol allows rapid identification and precise quantification of parasitized cells with a high degree of specificity and sensitivity. It also provides a useful indicator of the infectivity of sporozoite stabilates; although in vivo titration data are unavailable for the stabilates evaluated in the study, their relative infectivities in vitro are consistent with the doses required to generate clinical infections in vivo (data not shown).
Using a similar method, Goullin et al. (Reference Goullin, Belloc, Duiman, Masseron, Lacombe and Floch1992) described an analysis of Leishmania amastigotes in macrophages. However, their fixation and permeabilization protocol resulted in overlapping fluorescence signals between infected and non-infected populations, making the quantification of infected cells very difficult. On the contrary, the signal we obtained using anti-PIM mAb IL-S40.2 was completely distinguishable from background, allowing the unequivocal identification of infected cells. Antibody IL-S40.2 was selected because it gave marginally better separation between negative and positive populations compared to other antibodies tested (data not shown). MAb IL-S40.2 recognizes a conserved epitope in the amino terminal region of the Polymorphic Immunodominant Molecule (PIM). The conservation of the epitope recognized by the antibody rules out the possibility of staining variations due to allelic diversity of PIM among stabilates.
Using freshly isolated sporozoites we are able to detect a separate peak of PIM positivity as soon as 24 h post-infection. Whereas we have previously reported detection of parasite-infected cells as early as 6 h p.i. (Rocchi et al. Reference Rocchi, Ballingall, MacHugh and McKeever2006), here we have chosen to concentrate on a signal that is easily distinguishable from background and gives a distinct cluster of positive fluorescence. Using cryopreserved stabilates we were able to detect a signal of similar intensity in the infected cells, despite the lower frequency of positive events. The lower percentage of positive cells observed after infection with cryopreserved stabilates compared to freshly isolated sporozoites could be explained by higher sporozoite mortality during cryopreservation or by the fact that glycerol-cryopreserved stabilates must be equilibrated by dilution before addition to the cells for infection, giving a lower MOI per volume of inoculum.
The acquisition of 50 000 or more cells per sample allowed the identification of positive cells present at a very low frequency that would not have been recognized by classical microscopical examination methods. This allows an evaluation of the quality of the cryopreserved stabilate as early as 48 h p.i.
The concordance with the results of the limiting dilution cloning assay indicates that the percentages of PIM+ve cells observed at the FACS at 48 h post-infection reflect the fate of the culture. The detection of a higher percentage of infected cells by the FACS assay when compared with the LDA assay could be explained by its detection of positive cells in the culture before the attrition of parasitized cells reported by us previously (Rocchi et al. Reference Rocchi, Ballingall, MacHugh and McKeever2006) takes place, thus reflecting more closely the real infective capability of the stabilate. In addition, the tissue culture-based methods may underestimate the infective capability of the stabilates, since their results are influenced by the cellular selection that takes place in cultures at later stages and since the wells that are scored as positive could have arisen from more than a single starting infected cell. Therefore, in comparison with the limiting dilution assay, the flow cytometry test appears to be quicker, more sensitive, more accurate and less labour-intensive.
In summary, using a flow cytometric approach, we have developed a precise quantitative method for the analysis of Theileria-infected cells and demonstrated that our approach can be successfully employed to evaluate stabilate infectivity in vitro. This assay could be employed in in vitro screening of stabilates to identify the most infectious before in vivo titration testing, reducing both the labour time and the number of tested animals. Because this method gives such a robust quantification of the percentage of infected cells it could also be optimized to follow in vivo infections during vaccine trials, where a small variation in parasitaemia could influence the outcome of the infection. Finally, it has potential applications in rapidly assessing the infective capability of T. parva sporozoite stabilates used as live vaccines (Mbassa et al. Reference Mbassa, Kweka and Dulla1998; Marcotty et al. Reference Marcotty, Berkvens, Besa, Losson, Dolan, Madder, Chaka, Van den and Brandt2003) and in high throughput testing of anti-parasitic compounds.
We are grateful to the ILRI Tick Unit for provision of sporozoites. We also thank Dr Frank Katzer for his helpful comments. Part of this work was conducted with the support of the Italian Council for Research (CNR) at the International Livestock Research Institute of Nairobi, Kenya.