Introduction
The concept of frailty represents an attempt to move beyond simple disease-based measures of health, and to focus more broadly on the complex interaction of factors in multiple domains (Bergman et al., Reference Bergman2007). There are numerous definitions of frailty and numerous theoretical models. The “accumulation of deficits model” proposes that frailty reflects multi-system physiological change which is age associated. These physiological changes do not always achieve disease status, so that some people are frail without having life-threatening illness. Rather, the cumulative effect of factors results in an individual who is more likely to experience adverse outcomes (Mitnitski et al., Reference Mitnitski, Mogilner, MacKnight and Rockwood2002). Frailty is a strong predictor of mortality (Rockwood et al., Reference Rockwood2004; Klein et al., Reference Klein, Klein, Knudtson and Lee2005; Kane et al., Reference Kane, Shamliyan, Talley and Pacala2012), institutionalization (Rockwood et al., Reference Rockwood, Mitnitski, Song, Steen and Skoog2006), falls, and fractures (Ensrud et al., Reference Ensrud2007). The epidemiology of frailty has received increasing attention in the last decade (Fried et al., Reference Fried, Ferrucci, Darer, Williamson and Anderson2004; Walston et al., Reference Walston2006; Collard et al., Reference Collard, Boter, Schoevers and Oude Voshaar2012), and risk factors for developing frailty have been examined (Newman et al., Reference Newman2001). There is also increasing interest in the prevention and management of frailty. Most of this research has focused on the medical and physiologic factors that may lead to frailty or on its medical and health system consequences. There is less research into the psychological and social antecedents and consequences of frailty (Mezuk et al., Reference Mezuk, Edwards, Lohman, Choi and Lapane2012).
The concepts of life satisfaction (LS) and subjective well-being have also received increased attention. These concepts refer to contentment or happiness derived from optimal functioning. Well-being can be assessed in many domains: physical, emotional, social, and spiritual. Subjective well-being is perceived through social, psychological, cognitive, and emotional filters (McDowell, Reference McDowell2010). LS appears to be related to, but distinct from, depressive symptoms (Nes et al., Reference Nes, Czajkowski, Roysamb, Orstavik, Tambs and Reichborn-Kjennerud2012) and positive and negative affect, and to independently predict death (Collins et al., Reference Collins, Glei and Goldman2009). Increasingly, attention is turning to the importance of overall LS. Indeed, some advocate measuring LS and subjective well-being in general surveys to produce happiness measures for nations and societies (Fox, Reference Fox2012).
There has been some attention paid to the association between psychosocial factors and frailty. Lower levels of income security and education are associated with frailty (Szanton et al., Reference Szanton, Seplaki, Thorpe, Allen and Fried2010). Depressive symptoms are also strongly associated with frailty (Mezuk et al., Reference Mezuk, Edwards, Lohman, Choi and Lapane2012). Fillit et al. postulated a “frailty identity crisis” where the onset of frailty may be marked by impairments in LS (Fillit and Butler, Reference Fillit and Butler2009). Affected individuals are said to experience a crisis of identity and a decline in psychological well-being as they acquire health problems and disability. Fillit et al. argued for more research into the psychosocial aspects of frailty. Since then, some research has been conducted into LS and frailty. In their analysis of data from the Canadian Study of Health and Aging (CSHA), Andrew et al. Reference Andrew, Fisk and Rockwood(2012) found that poor psychological well-being and frailty were strongly associated. Within the general construct of psychological well-being, most subdomains (i.e., growth, mastery, positive relations, and self-acceptance) although not all (i.e., autonomy and purpose in life) were associated with frailty. Others have also reported an association between quality of life and frailty (Masel et al., Reference Masel, Graham, Reistetter, Markides and Ottenbacher2009; Lin et al., Reference Lin2011). Many of these studies are in specific disease states, such as heart failure (Buck and Riegel, Reference Buck and Riegel2011), dementia (Mhaolain et al., Reference Mhaolain2012), and Parkinson's disease (Roland et al., Reference Roland, Jakobi, Jones and Powell2012); others are in clinical settings (Chang et al., Reference Chang2012). In addition, most of these analyses are cross-sectional, making causality harder to ascertain. We therefore sought to clarify the association between frailty and LS in a prospective study of community-dwelling older adults. Specifically, we conducted an analysis of these secondary data to determine:
1. If frailty was associated with LS in community-dwelling older adults in cross-sectional analyses;
2. If frailty predicted LS five years later; and
3. If specific domains of LS were preferentially associated with frailty.
Methods
Sample
Manitoba is a province in the prairie region of Canada. It had a stable population of 1,091,940 in 1991 with 13.4% aged 65+ years (Statistics Canada, 1992). Data in this study are from the Manitoba Study of Health and Aging (MSHA), a prospective cohort study of aging and cognition conducted in conjunction with the CSHA (CSHA Working Group, 1994). The primary objectives of the MSHA were to estimate the prevalence and incidence of dementia in Manitoba and to examine issues related to informal caregiving. The MSHA received ethics approval from the Research Ethics Committee of the University of Manitoba and adhered to the Helsinki Declaration. Informed consent was obtained from the participants or from the appropriate proxy.
Older adults (65+ years) who were living in the community were randomly selected from a list provided by Manitoba Health. Since healthcare is universal in Manitoba, this is one of the most complete listings of residents available. The sampling frame excluded those living in institutions (nursing homes, correctional facilities, and chronic hospitals) and active-duty members of the Royal Canadian Mounted Police and military. The original sampling frame was stratified by health region and age, with stratified sampling within each health region by age group. There was an oversampling of the oldest old (>85 years), in order to increase the likelihood of obtaining adequate numbers of individuals with cognitive impairment. All health regions were represented, including rural areas. Those living in extremely remote regions were not included. Initially, 2,890 persons were selected. Of these, 443 refused to participate, 480 were not eligible (had died, entered a nursing home or were too ill), 162 could not be located, and 54 did not complete the screening questionnaire. This resulted in a sample of 1,751 participants. The sample was followed five years later, at which time 988 were still alive, living in the community, and had complete data available. The flow of participants is shown in Appendix Figure 1, available as supplementary material attached to the electronic version of this paper at www.journals.cambridge.org/jid_IPG).
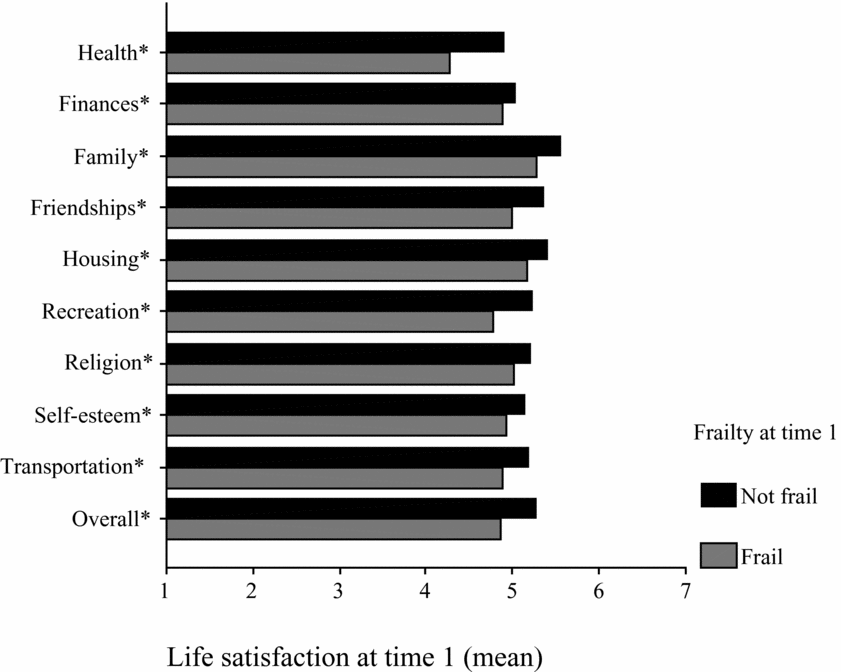
The association between time 1 frailty status and time 1 life satisfaction in community-dwelling older adults (n = 1751; *p < 0.05).

Measures
Interviews were conducted in person by trained interviewers. Cognition was measured using the modified Mini-Mental State Examination (3MS; Teng and Chui, Reference Teng and Chui1987). Those who scored below 78 on this screening test were invited to participate in a clinical examination to confirm their cognitive impairment and to determine a diagnostic classification (e.g., Alzheimer's disease; cognitive impairment, no dementia (CIND)). Dementia was diagnosed using DSM-IIIR and NINCDS-ARDRA criteria. Those who scored below the cut-off point of 78 on the 3MS, but did not meet the criteria for dementia, were categorized as CIND.
Functional status was measured using the Older Americans Resource Survey (OARS; Fillenbaum, Reference Fillenbaum1988), which consists of seven activities of daily living (ADLs) and seven instrumental ADLs (IADLs). Urinary incontinence was self-reported with the item: “Do you ever lose control of your bladder? (By that I mean do you ever pass water when you don't intend to?)” Age, gender, education, and marital status were self-reported. Marital status was categorized as never married, married, separated/divorced, and widowed.
frailty
We considered two measures of frailty. For our primary analysis, we used the brief frailty measure derived from the CSHA (Rockwood et al., Reference Rockwood, Stadnyk, MacKnight, McDowell, Hebert and Hogan1999). This measure is based on the classification scheme of the Geriatric Status Scale (GSS), which was used to target patients in hospital eligible for a specialized geriatric intervention. Patients were classified into four levels:
• Not frail: “Those who walk without help, perform basic activities of daily living (eating, dressing, bathing, bed transfers), are continent of bowel and bladder, and are not cognitively impaired”;
• Incontinent: “bladder incontinence only”;
• Mild frailty: “one (two if incontinent) or more of needing assistance with mobility or activities of daily living, has CIND [cognitive impairment, no dementia], or has bowel or bladder incontinence”; and
• Moderate to severe frailty: “two (three if incontinent) or more of totally dependent for transfers or one or more activities of daily life, incontinent of bowel and bladder, and diagnosis of dementia” (Rockwood et al., Reference Rockwood, Stadnyk, MacKnight, McDowell, Hebert and Hogan1999).
As a sensitivity analysis, we also considered the Frailty Index (Mitnitski et al., Reference Mitnitski, Mogilner and Rockwood2001; Reference Mitnitski, Song and Rockwood2004). This is a simple tally of deficits derived from items in the CSHA. Forty deficits in multiple domains were considered, and each was considered as present or absent. The number of deficits was summed and divided by the number of possible deficits to yield a score from 0 to 1. We considered this score as a continuous variable, and as a dichotomous variable, using a cut-off point of 0.25. The Frailty Index and the brief frailty measure were correlated (Spearman's correlation coefficient 0.42, p < 0.001).
life satisfaction
LS was assessed using the terrible–delightful scale (Andrews, Reference Andrews1974; Andrews and Crandall, Reference Andrews and Crandall1976; Michalos, Reference Michalos1980). This is a series of questions assessing satisfaction with various aspects of a person's life. There are 12 questions, each rated on a seven-point Likert-like scale, scored from 0 (terrible) to 7 (delightful). The items were health (“The present state of your general health (relatively free of common chronic illnesses)”); finances (“Your income and assets (including investments, property, etc.)”); family relations (“Kind of contact and frequency of contact with your family. This includes personal contact, phone calls and letters.”); paid employment (“Any work for wages, salary, or fees”); friendships (“Kind of contact and frequency of contact with your friends. This includes personal contact, phone calls and letters.”); housing (“The present type, atmosphere and state of your home (e.g., apartment, house, farm, room, etc.”)); living partner (included marriage partner and partner sharing intimate relations); recreation activity (“Personal recreation activities you engage in for pure pleasure when you are not doing normal daily living chores or some type of work. This includes relaxing, reading, TV, regular get togethers, church activities, arts and crafts, exercise, trips, etc.”); religion (“Your spiritual fulfillment”); self-esteem (“How you feel about yourself; your self-respect”); and transportation (“Public and private transportation (e.g., including convenience and expense).”). Two items (paid employment and living partner) were not considered because there were many missing responses. As well, one item measured general LS: “Now, using the same scale, how do you feel about your life as a whole right now? Is your life generally dissatisfying, satisfying, etc.?”
Analyses
Categorical variables were compared using χ2 tests and continuous variables were compared using Student's t-tests (assuming unequal variance) or one-way analysis of variance (ANOVA). Linear regression models were constructed for each domain of LS and for overall LS. First, unadjusted models for time 1 LS domains were constructed. Age, gender, education, and marital status were all then included in the model. Continuous variables were entered directly into the model, and categorical variables entered as dummy variables. Linear regression models were then constructed for each domain of LS at time 2. For these analyses, the outcome was time 2 LS while the predictor variables were measured at time 1. Standard regression diagnostics (e.g., multicollinearity and influential outliers) were conducted. Some domains of LS were skewed. These domains were log transformed, and responses also dichotomized as satisfied/not satisfied. While the model fit improved with the log transformation, the model produced results similar to original models. We therefore present the untransformed data for greater ease of interpretation. We also conducted a sensitivity analysis with a change in LS as the outcome. For this outcome, we subtracted the time 1 LS from the time 2 LS in each domain. This change in the LS score was then considered as the outcome for further regression models. Data manipulation, bivariate analyses, and graphs were conducted in SPSS version 10 (SPSS Inc., Chicago, IL), and statistical models were constructed using Stata version 10 (Statacorp, College Station, TX).
Results
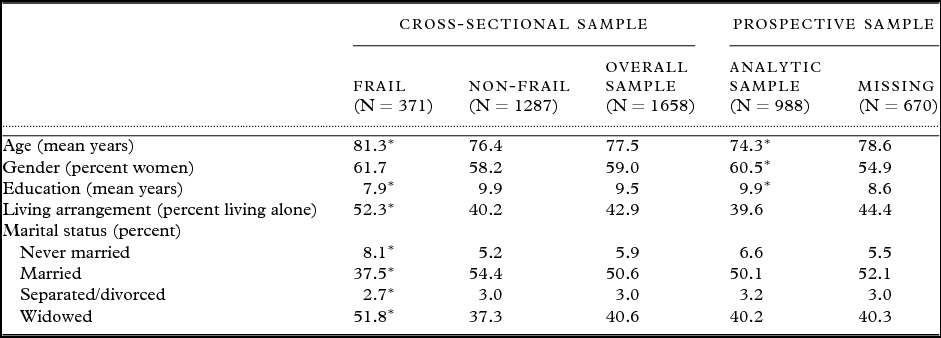
Baseline characteristics are shown in Table 1. Those who were frail were older, had lower educational levels, and were more likely to be unmarried. Those who survived to time 2 and had no missing data were younger, had higher levels of education, and were more likely to be women.
Baseline characteristics of frail and non-frail participants
*p < 0.05.
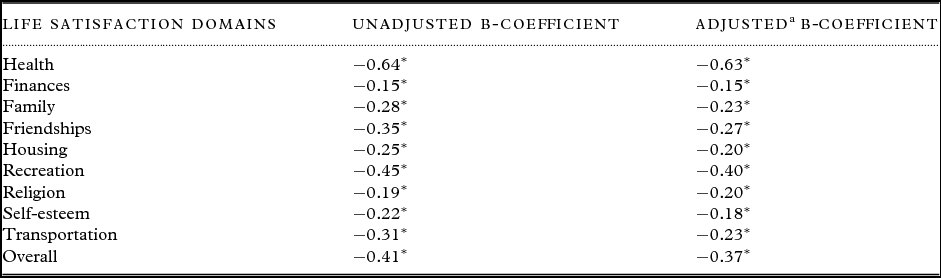
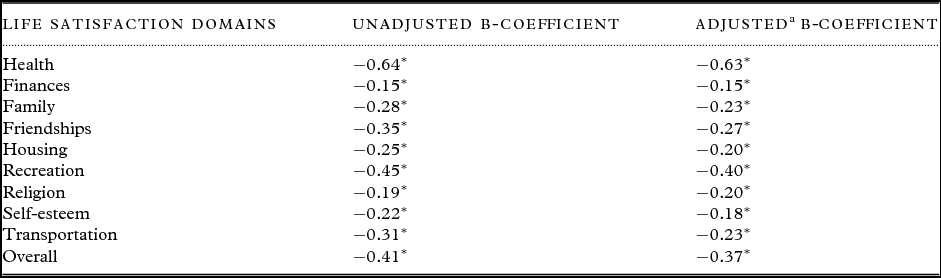
Most people, even those who were frail, had fairly high levels of LS (Figure 1). The brief measure of frailty was strongly linked to LS. The health domain was particularly strongly related to frailty. Other LS items were also associated with frailty, but the effect was smaller. We also observed very similar findings with the Frailty Index, whether we considered it as a continuous or as a categorical factor The only difference was that LS-finances was associated with the brief frailty measure, but not with the Frailty Index. In linear regression models, LS was lower for frail individuals across all LS domains (Table 2). The associations persisted after accounting for age, gender, education, and marital status. Again, the effect was strongest for the LS health domain.
Association of frailty at time 1 (brief frailty measure) with life satisfaction domains at time 1
aAdjusted for age, gender, education, and marital status.
*p < 0.05.
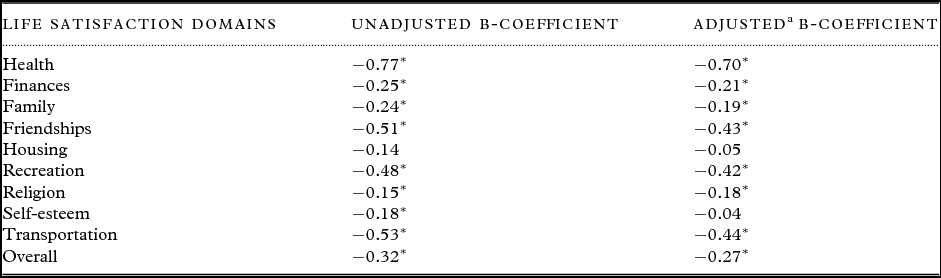
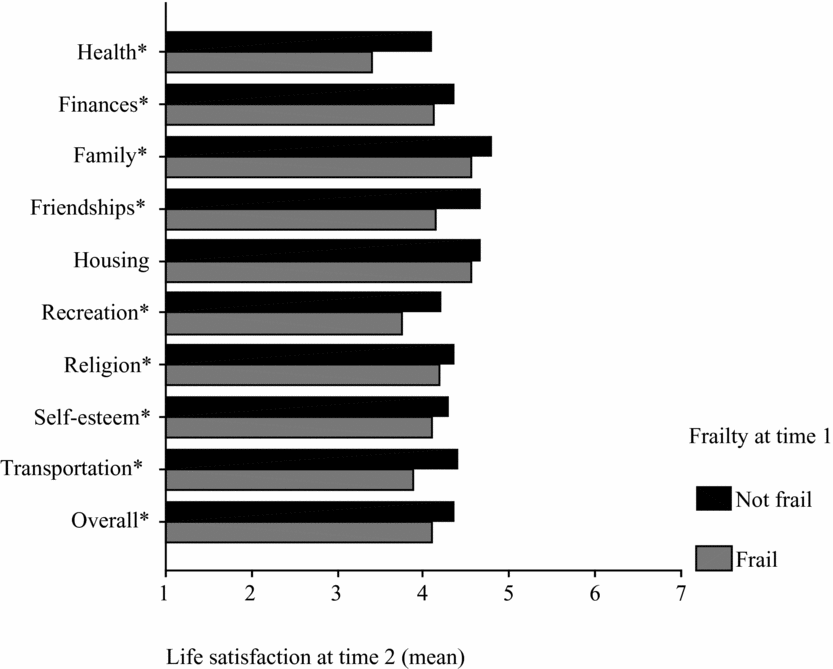
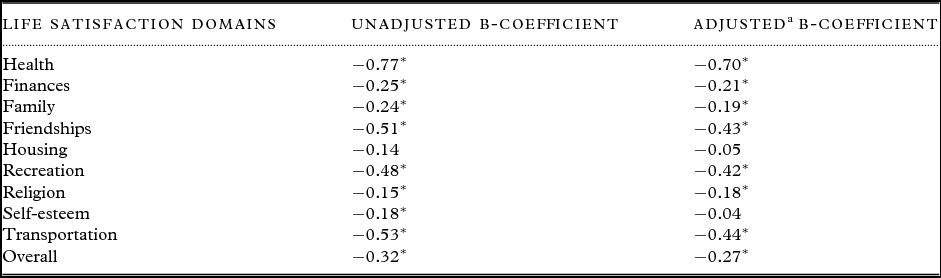
Frailty at time 1 also predicted LS at time 2 (Figure 2): the brief frailty measure was strongly predictive of LS in the domain of health. This strong effect in the health domain was also seen in multivariate models. In these adjusted models (Table 3), frailty was associated with LS in most domains, but not all (i.e., self-esteem and housing). The results of a sensitivity analysis using the Frailty Index were also similar, with the Frailty Index at time 1 predicting all domains of LS at time 2, except for religion. The association was particularly strong for health. For most other domains, however, the association was weaker. When we considered the change in the LS score between time 1 and time 2, the results were similar to the main analyses (Appendix Figure 1). Indeed, in these analyses, the Frailty Index only predicted a decline in LS for health and transportation, and in overall LS.
Association of frailty at time 1 (brief frailty measure) with life satisfaction domains at time 2
aAdjusted for age, gender, education, and marital status.
*p < 0.05.
The association between time 1 frailty status and time 2 life satisfaction in community-dwelling older adults (n = 988; *p < 0.05).
Discussion
We observed an association between frailty and LS in a cross-sectional analysis of a population-based epidemiologic study of older adults. Moreover, frailty predicted LS five years later. Both these associations were more pronounced for the domain of health than for other domains. The association between frailty and LS was seen using two different measures of frailty.
There are some strengths and limitations to our approach. One limitation is the measures we used. The definition and theoretical model of frailty are matters of some discussion. We used two measures of frailty, both of which are based upon the “frailty as an accumulation of deficits” (Mitniski et al., Reference Mitnitski, Mogilner and Rockwood2001) model. Other models of frailty, such as the “frailty as a phenotype” (Fried et al., Reference Fried2001; Reference Mitnitski, Song and Rockwood2004) model, may show different associations. The terrible–delightful scale may also have limitations. It was intended for use in populations of all ages, and some of the items were not appropriate to include because of large numbers of missing variables. As well, the minimal clinically important differences have not been established for the overall score, or for individual items. We have also made multiple comparisons of the outcomes, and some associations may have arisen by chance. A second limitation is that the data are somewhat old. There may be cohort and period effects in both frailty and LS, which may have changed since the study was conducted. It is less likely, however, that the association between LS and frailty has changed substantially over time. A third limitation is that we considered relatively few potential confounding factors. The frailty measures themselves were broad and multidimensional, encompassing a number of potential confounding factors (e.g., living alone and disability). Many of the items on one or both of the frailty scales could therefore not be considered as potential confounding factors.
Strengths of the study include its representative sampling frame, including both rural and urban populations. LS for health does differ in these populations (St John et al., Reference St John, Havens, van Ineveld and Finlayson2002), and it is therefore important to study rural as well as urban older adults. The prospective sampling frame allows more inferences to be made about causality. Frailty temporally precedes LS in this study, making it more likely that frailty causes lower LS. However, it is possible, perhaps even likely, that there is a feedback loop with frailty predicting lower LS, which in turn predicts worsening frailty. One limitation in the prospective analysis is differential loss to follow-up. Frailty strongly predicts death and institutionalization. Thus, those who were frail were more likely to have not been included at time 2. However, the results of this bias would have likely been to lessen the observed effect of frailty on LS, since many would become frail prior to death.
Our findings are very similar to the results of Andrew et al. Reference Andrew, Fisk and Rockwood(2012) despite using a different measure of well-being and a different sample. Andrew et al. considered data from the second wave of the CSHA and their results may not be representative of a general population, since it represents only those who survived the first five years of the study. Using a more basic measure of LS, however, we made the same observation. Frailty is a strong predictor of resource use, institutionalization, and mortality. We have also found that it predicts non-medical outcomes, such as LS. Preventing frailty and appropriately caring for those older adults with frailty may improve LS, particularly in health-related domains.
Our results may not be entirely consistent with a “frailty identity crisis” as proposed by Fillit and Butler Reference Fillit and Butler(2009). They propose that “The transition from life as a physically healthy and independent older person to dependency and frailty is fraught with challenges. Often, the frail older person feels that there is no ‘light at the end of the tunnel.’” This could result in an ongoing deterioration in psychological and social well-being which in turn compounds the effects of physical frailty. If frail older adults faced an identity crisis, then we would have expected to see markedly lower LS in all domains. However, we observed differential effects by domain, finding very strong associations between frailty and LS with health. The effect of frailty on other domains of LS (e.g., religion and self-esteem) was weaker. While statistically significant associations were seen in other domains, they were often fairly small, and most frail participants had high LS in these non-health-related domains. Frail older adults may not be facing an identity crisis – they may simply not like being ill. To determine this with more certainty, longitudinal measures of both LS and frailty would be needed, with repeated measures over time. These longitudinal studies could also further elucidate possible bidirectional causation.
Our findings underscore the importance of considering the complex interplay between social, psychological, functional, and biomedical factors over long time periods. Careful attention to medical, social, and psychological factors has long been integral to the practice of geriatric medicine (Warren, Reference Warren1943). Changes in one domain may influence other domains. Further research over longer time periods and using different definitions of frailty should be undertaken. Ideally, these studies should be conducted longitudinally with measures of frailty and LS conducted at multiple time points.
Conflict of interest
None.
Description of authors’ roles
Dr St John and Montgomery conducted clinical assessments for the MSHA. Dr St John and Dr Tyas conceived these analyses, and Dr St John conducted them. All the authors reviewed data and commented on the analyses. Dr St John drafted the manuscript and Dr Tyas and Dr Montgomery made substantial revisions.
Acknowledgments
The Manitoba Study of Health and Aging (MSHA) was funded primarily by Manitoba Health, with additional funding provided through the Canadian Study of Health and Aging by the Seniors Independence Research Program of the National Health Research and Development Program of Health Canada. The second wave of the MSHA was funded primarily by Manitoba Health's Healthy Communities Development Fund with additional funding provided through the Canadian Study of Health and Aging by the Seniors Independence Research Program of the National Health Research and Development Program of Health Canada (Project No. 6606-3954-MC[S]). The results and conclusions are those of the authors and no official endorsement by Manitoba Health or other funding agencies is intended or should be inferred.
Sponsors’ role
The sponsors had no role in the design, methods, subject recruitment, data collection, analysis, or preparation of the paper.