INTRODUCTION
Elevated maize prices, the result of increased maize demand for the bioethanol industry, have increased the inclusion of agroindustrial by-products in ruminant diets. Crude glycerine (CG) is a by-product from the biodiesel agroindustry that can be used in ruminant diets, and can account for up to 0·10 of diet dry matter (DM; Parsons et al. Reference Parsons, Shelor and Drouillard2009; Drouillard Reference Drouillard and Makkar2012) thus decreasing the acetate: propionate ratio in the rumen (Avila et al. Reference Avila, Chaves, Hernandez-Calva, Beauchemin, McGinn, Wang, Hasrtard and McAllister2011; Ramos & Kerley Reference Ramos and Kerley2012). Considering the inverse relationship between methane (CH4) and propionate production (Mitsumori & Sun Reference Mitsumori and Sun2008), feeding CG may reduce CH4 emissions from ruminants.
Almost all studies have reported the use of high concentrate (HC) diets with CG replacing rapidly fermentable starch. Schroder & Sudekum (Reference Schroder, Sudekum, Wratten and Salisbury1999) suggested that CG could replace up to 0·10 of readily fermentable starches: according to these authors, the energetic value of a high-starch concentrate diet (0·60 concentrate) was approximately 0·85 compared with that of a low-starch concentrate diet. Propionate production is typically greater in concentrate-fed animals, and thus there may be less opportunity to improve energetic efficiency when glycerine is combined with concentrates compared with feeding with forage (Drouillard Reference Drouillard2008).
It was hypothesized that providing CG in conjunction with soybean hulls in low concentrate (LC) diets to beef cattle should reduce CH4 emissions in comparison with bulls fed starch-based energy diets. The objective of the current study was to evaluate the effects of CG in combination with starch- v. fibre-based energy ingredients in LC and HC diets on CH4 emissions and growth performance of beef cattle.
MATERIALS AND METHODS
Experimental design and diets
The experiment was conducted at the Sao Paulo State University (UNESP, Jaboticabal, SP, Brazil) and humane animal care and handling procedures were followed according to the guidelines of Sao Paulo State University. Pre-slaughter handling was in accordance with good animal welfare practices, and slaughter procedures followed the Sanitary and Industrial Inspection Regulation for Animal Origin Products (Brazil 1997).
Seventy 18-month-old Nellore bulls were used in the experiment. Sixty young bulls, housed in individual pens with automatic drinkers, were weighed after a 16-h solid food fast to obtain reduced body weight (BW) values (374 ± 24·5 kg). The bulls were allocated by BW into a 2 × 3 factorial arrangement (two concentration levels (CL), 0·40 or 0·60; and three feeding regimes) with ten bulls per treatment. Bulls were allowed to acclimatize for 21 days to experimental housing and diets. After the acclimatization period, bulls were evaluated for 94 days to obtain DM intake (DMI), CH4 emissions, blood parameters and growth performance.
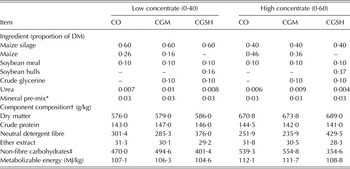
Young bulls were assigned randomly to one of the following experimental diets: CO – without CG, with maize as the concentrate ingredient; CGM – inclusion of CG (0·10 of DM) replacing maize in the concentrate; and CGSH – inclusion of CG (0·10 of DM) replacing soybean hulls in the concentrate, offered at two CL (0·40 or 0·60). These levels were representative of diets with >0·50 of roughage and >0·50 of concentrate, commonly used in the finishing phase of beef cattle in Brazil. Crude glycerine was acquired from a soybean oil-based biodiesel production company (ADM, Rondonópolis, Brazil; 0·80 glycerol, 0·02 ether extract, 0·05 ash and 0·12 water). Maize silage was the only source of roughage and the concentrates comprised ground maize or soybean hulls, soybean meal, urea/ammonium sulphate and a mineral mixture. Soybean meal was used as an alternative protein source, and a mixture of urea and ammonium sulphate was used to adjust the diet crude protein (CP) content. All diets were balanced to provide 14·4 ± 0·21 CP (Valadares Filho et al. Reference Valadares Filho, Paulino and Magalhães2006). The proportions of ingredients and chemical composition of the experimental diets are presented in Table 1.
Diet composition (dry matter basis)

CO, maize without crude glycerine; CGM, crude glycerine replacing maize; CGSH, crude glycerine replacing soybean hulls.
* Trace mineral mix contained: calcium, 210 g; phosphorus, 20 g; sulphur, 37 g; sodium, 80 g; copper, 490 mg; manganese, 1·424 mg; zinc, 1·830 mg; iodine, 36 mg; cobalt, 29 mg; selenium, 9 mg; fluorine max., 333 mg.
† Dry matter basis. All components were analysed. Metabolizable energy was calculated as Digestible Energy × 0·82.
‡ Non-fibre carbohydrates = 100 – (crude protein + ether extract + ash + neutral detergent fibre).
Dry matter intake
Cattle were fed twice daily at 08.00 and 16.00 h and feed refusals were recorded daily for each pen at 06.00 h for 115 days (acclimatization plus experimental period). Amounts of feed offered to bulls were calculated according to previous DMI and adjustments were made when needed to ensure refused feed was always between 0·05 and 0·10 of daily intake. Feed refusals were collected, weighed and sampled daily for subsequent analysis. To estimate DMI, samples of individual ingredients and feed refusals from each animal were first composited weekly and then batched every month. Feed samples were frozen (composite of daily samples) at −18 °C. For proximate analysis, samples of ingredients and feed refusals were thawed and dried at 55 °C for 72 h. Samples were then ground in a Wiley mill (Thomas Scientific, Swedesboro, NJ, USA) to pass through a 1-mm screen and analysed for DM and ether extract (AOAC 1990). Nitrogen content was determined by combustion (Leco Instruments Inc., method 976·06, AOAC 1990) and multiplied by 6·25 to obtain CP and neutral detergent fibre (NDF) was determined by the method of Van Soest et al. (Reference Van Soest, Robertson and Lewis1991) using Ankom bags (Ankom Technology Corp., Fairport, NY, USA).
Methane measurements
Methane emissions were measured using the sulphur hexafluoride (SF6) tracer technique (Johnson et al. Reference Johnson, Huyler, Westburg, Lamb and Zimmerman1994), where each animal was sampled daily for 5 consecutive days, beginning at 87 days of feeding. Thirty-six docile bulls (six treatment replicates) were fitted with gas collection halters at 10 days before methane sampling to allow bulls to adapt to halters and thus facilitate sampling. Brass permeation tubes filled with SF6 with known release rates were administered orally to each of the 36 bulls 72 h before methane sampling to allow the tracer gas to equilibrate in the rumen. The release rate of the gas from a permeation tube is known before its insertion into the rumen. Before administration, the permeation tubes were maintained in a water bath at 39 °C for 8 weeks in the laboratory and weighed weekly. The bulls were fitted with gas collection halters connected to pre-evacuated polyvinyl chloride canisters designed to fill halfway over 24 h. Sampling started at 06.00 h daily (one by one), when each bull was moved individually to the handling pens at the management centre to facilitate sampling. The collection canisters were located above each animal to reduce the risk of equipment damage, and were connected to the halter by airline flexible-coil tubing. The canisters were removed from the animals at 24-h collection intervals and the pressure was measured. For this technique, a two-stage vacuum pump and a digital manometer were used with a scale from 0 to 203 kPa. This allowed measurement of the initial and final pressure of each canister during the collection period. If final pressure was out of the expected range, the halter was replaced in a maximum of 15 min. If final pressure was above the expected range, the halter might have been blocked or disconnected; if the final pressure was below the expected range, there was possibly a leak in the system. In both situations, a new halter was placed on the animal with an average absorption rate within the stipulated range (half full in 24 h). After sampling (which took approximately 15 min per animal to remove animals from the pen and change the canister), each animal was returned to their original pen for feeding. A minimum of three samples (final pressure with expected range) from each animal was required to include in data analysis. The pressure readings were recorded and the canisters were pressurized using pure nitrogen gas (N2). Two samples of ambient air were collected per day in the feedlot to determine background concentrations of CH4 and SF6. These values were subtracted from the bull values to calculate the net output in their expired breath. Concentrations of CH4 and SF6 were determined at the EMBRAPA Environment laboratory, located in Jaguariúna, Sao Paulo State, Brazil, by a gas chromatograph HP6890 (Agilent, Delaware, USA), equipped with flame ionization detector at 280 °C, column megabore (0·53 mm × 30 m × 15 µm) Plot HP-Al/M (for CH4), electron capture detector at 300 °C and column megabore (0·53 mm × 30 m × 25·0 µm) HP-MolSiv (for SF6), with two loops of 0·5 cm3 maintained at 80 °C attached to two six-way valves. The gas chromatography column was maintained at 50 °C during the analysis and heated to 150 °C for about 15 min for cleaning purposes. Soon after the collection period and prior to the determination of CH4 and SF6, the canisters were pressurized to between 1·3 and 1·5 psi (g) using special nitrogen 5·0, and then readings of the initial and final dilution pressures were taken with a portable digital manometer (±0·01), certified for reading range from −1 to +2 bar (g) (Druck, model DPI705), in order to obtain the dilution factor. Calibration curves were established using standard gases certified by the White Martins development laboratory, with the concentration for CH4 in ppm (5 ± 0·25, 10 ± 0·16 and 19 ± 0·65 ppm) and for SF6 in ppt (34 ± 9·0, 91 ± 9·0 and 978 ± 98·0 ppt), according to Westberg et al. (Reference Westberg, Johnson, Cossalman and Michal1998). Methane emission rate was calculated as follows:
 $${\rm QC}{{\rm H}_4} = {\rm QS}{{\rm F}_6} \times [{\rm C}{{\rm H}_4}]/[{\rm S}{{\rm F}_6}]$$
where QCH4 is the emission rate of methane in litres/h, QSF6 is the known release rate of SF6 from the permeation tube, and CH4 and SF6 are the measured concentrations in the canister. Methane emissions (g/bull/day) and g CH4/kg DMI (g/kg) were calculated by dividing the daily CH4 output of each animal by daily intake (during methane sampling) and methane emissions (g/bull/day) in relation to kg of average daily gains (ADG) and kg of carcass gain (CrG), both throughout the entire experimental period. The variable CH4 (g/kg CrG) is the weight of methane (g) produced each day per kg of daily CrG.
Growth and performance recording
At the beginning of the trial (0 day–after 21 days of acclimatization period), all bulls were weighed after the 16-h solid fast and before the first feeding in the morning. The ADG was obtained by weighing animals at the beginning and end of the experiment (94 days), always after a 16-h solid fast. After 94 days of feeding, all the bulls were slaughtered at a commercial beef plant. To obtain CrG, ten bulls were slaughtered (384 ± 41·1 kg) and served as the reference group at the beginning of the experiment (day 0) to obtain the initial dressing percentage (51·9%), which was used to estimate the initial carcass weight (CWi) to obtain the CrG and CrG in relation to the ADG (CrG/ADG) at the end of experiment. The dressing percentage (DP) of reference group was used in conjunction with initial BW (day 0) of 60 bulls to estimate the initial CWi of these 60 bulls using the equation: CWi = (BWi × DP of reference group)/100. At the end of experiment, the 60 bulls were slaughtered and the final carcass weight (CWf) was recorded for each animal, thus CrG = (CWf − CWi/d of feeding).
Blood parameters
Jugular vein blood samples were taken from all bulls after the 16-h solid fast and before the first feeding at 0, 59 and 94 days. Blood samples were collected in commercial blood collection Vacutainer tubes (10 ml; BD Biosciences, Franklin Lakes, NJ) and EDTA-coated glass Vacutainer tubes (10 ml; BD Biosciences, Franklin Lakes, NJ). They were placed on ice and centrifuged at 2500 × g for 20 min at 4 °C; the resulting serum or plasma was decanted and stored at −20 °C until laboratory analysis. Fasting plasma samples were analysed for glucose (Glucose Liquiform Vet Kit, Labtest Diagnostica S.A., Lagoa Santa, Brazil) and serum samples were analysed for insulin (ADVIA Centaur CP Insulina – IRI, manufactured in Japan by Kyowa Medex Co., Ltd. For Siemens Healthcare Diagnostics Inc., Tarrytown, New York, USA) using commercial kits.
Carcass characteristics
Ultrasound measures of rib fat thickness (RFT) and loin muscle area (LMA) between the 12th and 13th rib were obtained on days 0, 27, 59 and 94 for each animal using an Aloka 500 V real time ultrasound machine (Hitachi Aloka Medical, Ltd, Tokyo, Japan) equipped with a 17·2-cm, 3·5-MHz linear transducer (Greiner et al. Reference Greiner, Rouse, Wilson, Cundiff and Wheeler2003). Images were taken by a technician certified by the Ultrasound Guideline Council and images were interpreted using the software Biosoft Toolbox® II for Beef (Biotronics, Inc., Ames, Iowa, USA).
Statistical analysis
All data were analysed using the SAS PROC MIXED procedure (SAS Inst. Inc., Cary, North Carolina, USA). The model tested the fixed effects of the CL, FR (i.e., without CG, CG plus maize, and CG plus soybean hulls) and the interaction of CL and FR. For all data, the animal was the experimental unit and was included in the model as a random effect. When the interaction term was not significant, it was removed from the model. The ultrasound measurements and serum concentrations of glucose and insulin were analysed as repeated measurements in time using the MIXED procedure. This model included the effects of the CL, FR, time and CL × FR × time interactions as fixed effects and the animals as random effects. The best (co)variance matrix was chosen based on Akaike's Information Criteria. Least-squares means were generated for main-effects and significant interactions and compared (significance was set at P ⩽ 0·05) using Tukey's test. For all variables, P-values between 0·05 and 0·10 are considered tendencies.
RESULTS
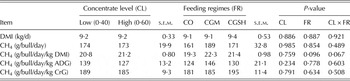
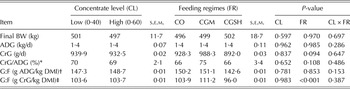
Bulls fed LC or HC diets had similar DMI (P = 0·886; Table 2). Because of the similarity in the DMI, bulls had a similar ADG (P = 0·962), final BW (P = 0·597) and G : F (g ADG/kg DMI; P = 0·781; Table 3). Differences in DMI were not observed (P = 0·887; Table 2) among the FR and animals showed similar ADG (P = 0·985), final BW (P = 0·970), and G : F, g ADG/kg DMI (P = 0·853; Table 3).
Effect of crude glycerine replacing maize or soybean hulls in low- or high-concentrate diets on methane (CH4) emissions from cattle

CO, maize without crude glycerine; CGM, crude glycerine replacing maize; CGSH, crude glycerine replacing soybean hulls; DMI, dry matter intake; CL, concentrate level effect; FR, feeding regime effect; CL × FR, concentrate level and feeding regime interaction effect; CrG, carcass gain.
Effects of the addition of crude glycerine to replace maize or soybean hulls in low- or high-concentrate diets on cattle growth performance and feed efficiency

CO, maize without crude glycerine; CGM, crude glycerine replacing maize; CGSH, crude glycerine replacing soybean hulls; BW, body weight; ADG, average daily gain; CrG, carcass gain; DMI, dry matter intake; CL, concentrate level effect; FR, feeding regime effect; CL × FR, concentrate level and feeding regime interaction effect; CrG, carcass gain.
* Carcass gain in relation to average daily gain.
† Gain to feed ratio, g average daily gain/kg DMI.
‡ Gain to feed ratio, g carcass gain/kg DMI.
The daily methane emissions (g/bull/day; P = 0·985) did not differ significantly between the concentrate level (Table 2); nor did g/bull/day in relation to kg of DMI (P = 0·759), g/bull/day in relation to kg of ADG (P = 0·234), and g/bull/day in relation to kg of CrG (P = 0·791; Table 2). No differences were observed in daily methane emissions (g/bull/day; P = 0·854) in relation to kg of ADG (P = 0·778) or kg of CrG (P = 0·634) among the FR. However, there was a tendency for an interaction between CL and FR for methane emissions (g/bull/day) per kg of DMI (P = 0·067). Bulls fed CG in the HC diet had a tendency to produce greater methane emissions (g/kg DMI) than bulls fed HC diets without CG.
Bulls fed CG as a replacement for maize in LC diets also had a tendency to produce greater methane emissions (g/kg DMI) than bulls fed HC diets without CG (P = 0·067). Bulls fed CG as a replacement for soybean hulls in LC diets had similar methane emissions (g/bull/day/kg DMI) to bulls fed starch-based ingredients at HC with or without CG. In addition, these bulls had a tendency to emit less methane (g/bull/day/kg DMI) than bulls fed fibre-based energy ingredients in HC diets with CG (P = 0·067).
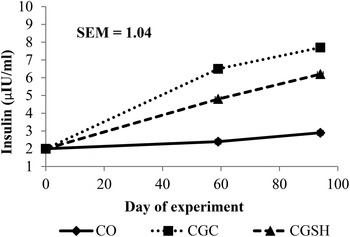
The CrG, CrG/ADG, and G : F (g CrG/kg DMI) were similar (P > 0·10; Table 3) in bulls fed LC or HC diets, and bulls had similar blood glucose concentrations (P = 0·107; Fig. 1), insulin (P = 0·822; Fig. 2), and insulin: glucose ratios (P = 0·990; Table 4). Differences were not detected for CL × FR × time (P = 0·25; P = 0·93; P = 0·44; data not shown) in the blood. Furthermore, bulls did not differ in LMA (P = 0·96) or RFT (P = 0·18; Table 5).
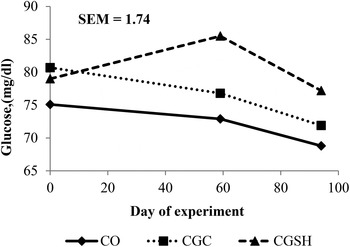
Glucose serum concentrations of young bulls fed diets: CO, maize without crude glycerine; CGM, crude glycerine replacing maize; CGSH, crude glycerine replacing soybean hulls at low or high concentrate diets during 94days of the experiment. Significant effects of time (P = 0·028) and FR (P = 0·004) but not for CL (P = 0·107) and CL × FR interaction (P = 0·574) were detected.

Insulin serum concentrations of young bulls fed diets: CO, maize without crude glycerine; CGM, crude glycerine replacing maize; CGSH, crude glycerine replacing soybean hulls at low or high concentrate diets during 94 days of the experiment. Significant effects of time (P = 0·039) but not for FR (P = 0·128), CL (P = 0·822) and CL × FR interaction (P = 0·636) were detected.

Effect of crude glycerine replacing maize or soybean hulls in low or high concentrate diets on serum glucose and insulin concentrations from cattle

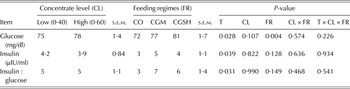
CO, maize without crude glycerine; CGM, crude glycerine replacing maize; CGSH, crude glycerine replacing soybean hulls; T, time effect; CL, concentrate level effect; FR, feeding regime effect; CL × FR, concentrate level and feeding regime interaction effect; T × CL × FR, time, concentrate level and feeding regime interaction.
Effect of crude glycerine replacing maize or soybean hulls in low or high concentrate diets on cattle tissue evaluated through ultrasound

CO, maize without crude glycerine; CGM, crude glycerine replacing maize; CGSH, crude glycerine replacing soybean hulls; T, time effect; CL, concentrate level effect; FR, feeding regime effect; CL × FR, concentrate level and feeding regime interaction effect; T × CL × FR, interaction between time, concentrate level and feeding regime; LMA, longissimus muscle area; RFT, rib fat thickness.
Although differences in ADG were not identified, bulls fed diets with CG as a replacement for starch-based energy ingredients had a tendency to obtain greater (P = 0·094; Table 3) CrG than bulls fed diets with CG as a replacement for fibre-based energy ingredients. Bulls fed diets with CG as a replacement for starch-based energy ingredients had a tendency (P = 0·108) to achieve greater CrG/ADG than bulls fed the CO diet or diets with CG replacing fibre-based energy ingredients. Because of similar DMI but greater CrG, bulls fed diets CGM had better (P < 0·001) G : F (g CrG/kg DMI) than bulls fed the CO diet because bulls fed diets without CG had greater G : F (g CrG/kg DMI) than bulls fed diets with CGSH.
Bulls fed CG as a replacement for maize had similar serum glucose concentrations to bulls fed diets without CG and maize. However, when CG replaced fibre-based ingredients, serum glucose concentrations increased (P = 0·004; Table 4) more than when bulls were fed diets without CG plus maize.
No differences were observed among the FR in insulin (P = 0·128) or the insulin: glucose ratio (P = 0·149) (Table 4). The interaction between time, CL and FR were not significant for insulin (P = 0·934) or glucose (P = 0·226). However, a significant effect of time (sampling period) was detected for glucose (P = 0·028; Fig. 1), insulin (P = 0·039; Fig. 2) and the insulin: glucose ratio (P = 0·031; Table 4). Serum glucose concentrations on day 94 were less than those on day 0 (73 ± 1·6 v. 78 ± 1·1 mg/dl, respectively; P = 0·061) and day 59 (78 ± 2·1 mg/dl; P = 0·049), but did not differ (P = 0·991) between days 0 and 59 (Fig. 1). The serum insulin concentrations on day 94 were greater than those on day 0 (6 ± 1·0 v. 2·0 ± 1·03 µ international unit (IU)/ml; P = 0·041), but did not differ (P = 0·739) between days 94 and 59 (5 ± 1·0 µIU/ml).
The interaction between time, CL and FR were not significant for LMA (P = 0·980) or RFT (P = 0·995). Bulls fed fibre-based energy ingredients had a smaller (P = 0·019) LMA than bulls fed diets without or with CG as a replacement for maize (Table 5). Unlike LMA, no differences were observed for RFT (P = 0·110) among the FR (Table 5).
DISCUSSION
According to Forbes (Reference Forbes2007), increasing the level of supplementation with concentrates often causes a decline in the rate of forage digestion in the rumen, impairing the DMI. Generally, the evident drop in DMI happens following the introduction of a diet with increased concentrate proportion (Holtshausen et al. Reference Holtshausen, Schwartzkopf-Genswein and Beauchemin2013). Differences were not observed in DMI between CL and similar results were reported by Pina et al. (Reference Pina, Valadares Filho, Tedeschi, Barbosa and Valadares2009) who found no effect of 0·20 and 0·40 of concentrate in DMI in diets for Nellore.
The results concerning DMI between FR are consistent with those obtained in other studies, suggesting CG can be included in feed up to 0·10 of DM by replacing rapidly fermentable starch for beef cattle finished in feedlots, without reducing intake or performance (Pyatt et al. Reference Pyatt, Doane and Cecava2007; Parsons et al. Reference Parsons, Shelor and Drouillard2009; Drouillard Reference Drouillard and Makkar2012; Bartoň et al. Reference Bartoň, Bureš, Homolka, Jančík, Marounek and Řehák2013). The NDF concentration in the experimental diets increased when soybean hulls were included in the concentrate. In the present study, it was hypothesized that the inclusion of CG as a replacement for fibre-based energy ingredients would decrease DMI, possibly because glycerine in the rumen can reduce cellulolytic activity of ruminal bacteria, thereby decreasing fibre digestibility (Roger et al. Reference Roger, Fonty, Andre and Gouet1992; Abo El-Nor et al. Reference Abo El-Nor, Abughazaleh, Potu, Hastings and Khattab2010). However, the inclusion of CG in fibre-based diets did not affect animal DMI, possibly because the soybean hulls rapidly escaped the rumen due to their small feed particle size (Mertens Reference Mertens1997). The partial dietary replacement of rapidly fermentable starch with CG (0·10 of DM) did not affect the feed conversion ratio in relation to ADG (Bartoň et al. Reference Bartoň, Bureš, Homolka, Jančík, Marounek and Řehák2013).
According to Johnson & Johnson (Reference Johnson and Johnson1995) and Yan et al. (Reference Yan, Agnew, Gordon and Porter2000), the DMI increase may be attributable to an increased digestive outflow rate from the rumen, thus reducing the time available for microbial fermentation of the ingested feed and limiting methane production. Bulls fed LC diets and HC diets had similar methane emissions, which is likely to be due to the similar DMI levels for these diets.
In an in vivo study, Avila-Stagno et al. (Reference Avila-Stagno, Chaves, He, Harstad, Beauchemin, McGinn and McAllister2013) did not observe any effect of using CG to replace barley grain for 0·21 of diet DM on methane emissions from lambs; however, in an in vitro study Lee et al. (Reference Lee, Lee, Cho, Kam, Lee, Kim and Seo2011) observed that the inclusion of glycerol with maize or alfalfa reduced methane production after 24 h. In the present in vivo study, it was expected that the inclusion of CG in the diets would reduce methane emissions because recent studies reported that glycerol fermentation favours propionate over acetate production (Wang et al. Reference Wang, Lui, Huo, Yang, Dong, Huang and Guo2009; Avila et al. Reference Avila, Chaves, Hernandez-Calva, Beauchemin, McGinn, Wang, Hasrtard and McAllister2011). Glycerine failed to decrease methane emissions as hypothesized, but tended to increase it in HC diets.
Glycerine fermentation does not always produce a hydrogen sink because it promotes a shift in carbohydrate fermentation that may affect the overall electron balance in the rumen, and not promote reduction in the availability of hydrogen for methane formation. Glycerol is a more reduced substrate than sugars and releases two electron pairs for each mole of glycerol converted to pyruvate (Zhang & Yang Reference Zhang and Yang2009); one in the oxidation of glycerol to dihydroxyacetone, which is then phosphorylated and enters glycolysis, and the other in glycolysis itself, in the oxidation of 3-phosphoglyceraldehyde to 3-phosphoglycerate (Biebl et al. Reference Biebl, Menzel, Zeng and Deckwer1999). Thus, according to Avila-Stagno et al. (Reference Avila-Stagno, Chaves, Ribeiro Júnior, Ungerfeld and McAllister2014), this compensates for electron incorporation in the conversion of pyruvate or phosphoenolpyruvate to propionate and there is no net electron incorporation in the conversion of glycerol to propionate. Furthermore, Avila-Stagno et al. (Reference Avila-Stagno, Chaves, Ribeiro Júnior, Ungerfeld and McAllister2014) reported that there is a linear increase in butyrate production when glycerol constitutes up to 0·15 of DM, thus, butyrate production from both carbohydrates and glycerol would result in a release of reducing equivalents and contribute to increasing methane emissions.
Increasing the starch content of the diet shifts rumen fermentation towards propionic acid production at the expense of acetic acid (McGeough et al. Reference McGeough, O'Kiely, Hart, Moloney, Boland and Kenny2010). The production of propionic acid is a hydrogen-utilizing process, which deprives the methanogenic bacteria of the hydrogen necessary to produce methane (Moss et al. Reference Moss, Jouany and Newbold2000). This suggests that a dietary starch threshold must be achieved to sufficiently stimulate glucogenic VOLATILE FATTY ACID production to a concentration that could provide a viable hydrogen sink alternative to methanogenesis (Lovett et al. Reference Lovett, Stack, Lovell, Callan, Flynn, Hawkins and O'Mara2005), thus reducing methane emissions.
It was hypothesized that bulls fed CG as a replacement for fibre-based energy ingredients in LC diets would emit less methane than bulls fed starch-based ingredients in HC diets (with or without CG) because CG might produce propionate more efficiently in LC diets with lower starch concentrations. The addition of glycerol plus forage (alfalfa) reduced the acetate : propionate ratio more than glycerol plus maize (Lee et al. Reference Lee, Lee, Cho, Kam, Lee, Kim and Seo2011) in an in vitro study. Bulls fed CG as a replacement for soybean hulls in LC diets might use glycerol more efficiently for propionate production in the rumen, because these bulls had similar methane emissions (g/bull/day/kg DMI) to bulls fed HC diets without CG. Furthermore, they had a tendency to reduce methane emissions (g/bull/day/kg DMI) compared with bulls fed CG as a replacement for soybean hulls in HC diets.
The method used in the current study to quantify methane emissions has been debated in a number of studies (Pinares-Patiño et al. Reference Pinares-Patiño, Holmes, Lassey and Ulyatt2008, Reference Pinares-Patiño, Lassey, Martin, Molano, Fernandez, Maclean, Sandoval, Luo and Clark2011). It has been carefully tested during the last two decades and some limitations have been described: maintaining a constant release rate from permeation tubes, effect of release rate upon emission rate of methane, background level determination, inconsistency between methane measurements determined in chambers and with SF6 and within and between animal variation. The technique is still new and further investigation can hopefully improve the technique (Storm et al. Reference Storm, Hellwing, Nielsen and Madsen2012).
Animal growth directly correlates with tissue growth, as it is dependent upon the rate and extent of cellular hypertrophy and hyperplasia comprising the respective tissues. Cellular enlargement occurs due to nutrient uptake by the cell and the balance between the anabolic and catabolic processes that regulate accretion of cellular components and structural materials (Etherton Reference Etherton1982). The current findings demonstrate that the bulls evaluated in the present work had similar glucose uptake in peripheral tissue and did not exhibit significant differences in growth. Likewise, Lage et al. (Reference Lage, Paulino, Valadares Filho, Souza, Duarte, Benedeti, Souza and Cox2012) did not observe differences in the LMA or RFT from the carcasses of bulls fed with LC or HC diets.
The change in live weight is an imprecise growth indicator, considering accretion of protein and fat tissue (Owens et al. Reference Owens, Gill, Secrist and Coleman1995). McLeod & Baldwin (Reference McLeod and Baldwin2000) reported that digestive tract mass increases significantly when ruminants are fed fibre-based diets. When higher fibre levels are fed throughout the finishing period, the percentage of weight as gastrointestinal fill may not decrease (Buckley et al. Reference Buckley, Baker, Dickerson and Jenkins1990), thus explaining the similar ADG compared with bulls fed other diets, and the tendency to reduce the carcass deposition.
Glucose is derived from ruminal (Schoonmaker et al. Reference Schoonmaker, Cecava, Faulkner, Fluharty, Zerby and Loerch2003) and post-ruminal (Huntington et al. Reference Huntington, Harmon and Richards2006) starch digestion. In contrast to maize, soybean hulls are low-starch energy supplements that are high in digestible fibre (Sharman et al. Reference Sharman, Lancaster, Krehbiel, Hilton, Stein, Desilva and Horn2013). Starch fermentation in the rumen yields more propionate, less acetate and more glucose to the animal compared with fibre digestion (Church Reference Church1988). An increased supply of glucose from intestinal digestion of starch promotes lipogenesis via the citrate cleavage pathway; as such, lipogenesis in the total body could thus be enhanced (Owens et al. Reference Owens, Gill, Secrist and Coleman1995). Therefore, intestinal fat synthesis could explain why an increased supply of intestinal starch often enhances the efficiency of finishing cattle (Owens et al. Reference Owens, Zinn and Kim1986). This effect may have been enhanced by the inclusion of CG in the diet because of the gluconeogenic property of this by-product.
Glycerine levels of up to 0·10 of the DM as a replacement for rapidly fermentable starch in feed for bulls finished in feedlots did not affect glucose serum concentrations (Bartoň et al. Reference Bartoň, Bureš, Homolka, Jančík, Marounek and Řehák2013). The increase in serum glucose in bulls fed CG as a replacement for soybean hulls was likely to be caused by the suppressed microbial fermentation activity induced by fasting and ruminal transit (Cole & Hutcheson Reference Cole and Hutcheson1981, Reference Cole and Hutcheson1985). The soybean hulls exhibit a greater ruminal rate and degradation extent than maize (Ipharraguerre & Clark Reference Ipharraguerre and Clark2003), so the reduction in microbial fermentation activity could have increased the non-degradable protein intake to the small intestine, and thus increased the amount of gluconeogenic precursors available and intestinal glucose absorption (Mueller et al. Reference Mueller, Blalock and Pritchard2011).
It was hypothesized that bulls fed CGSH diets would improve their energy efficiency and obtain greater tissue deposition because Schroder & Sudekum (Reference Schroder, Sudekum, Wratten and Salisbury1999) suggested that the energetic value of CG when fed in conjunction with a high-starch concentrate diet (0·60 concentrate) was approximately 0·85 of its value when fed with a low-starch concentrate diet. The results obtained with bulls fed fibre-based energy ingredients had smaller LMA than bulls fed diets with or without CG as a replacement for maize. This can be attributed to the greater serum glucose concentrations of bulls fed diets with CGSH, thus lower glucose uptake by tissues and less lean tissue development. Bulls fed diets with maize received a more than adequate supply of glucose from dietary sources, suggesting that ruminal starch fermentation to provide other nutrient needs (energy substrates, amino acids) would improve the efficiency of starch use for growth (Huntington Reference Huntington1997).
Soybean hulls are low in lignin and composed of a large proportion of potentially digestible fibre (Quicke et al. Reference Quicke, Bentley, Scott, Johnson and Moxon1959; Hsu et al. Reference Hsu, Faulkner, Garleb, Barclay, Fahey and Berger1987). Therefore, when soybean hulls are fermented in the rumen, more acetate than propionate is produced. The contribution of acetate to lipogenesis is greatest in subcutaneous adipose tissue (Smith & Crouse Reference Smith and Crouse1984; Smith et al. Reference Smith, Kawachi, Choi, Choi, Wu and Sawyer2009). Likewise, Sharman et al. (Reference Sharman, Lancaster, Krehbiel, Hilton, Stein, Desilva and Horn2013) reported no differences in subcutaneous fat from carcasses of animals fed fibre-based supplements (soybean hulls) compared with carcasses of animals fed starch-based supplements (maize). However, differences in mRNA expressions of genes involved in lipogenesis as a fatty acid synthase (FASN), adipocyte fatty acid binding protein 4 (FABP4) and stearoyl-CoA desaturase 1 (Δ9-desaturase) were detected in perirenal adipose tissue of growing Angus steers fed fibre-based supplements (soybean hulls) in comparison with expression of genes in the perirenal adipose tissue from animals fed starch-based supplements (maize). This explains why bulls fed CGSH in the current work, despite a lower CrG and LMA, had similar thickness of subcutaneous fat.
CONCLUSIONS
Increasing concentrate content (0·40–0·60) did not affect the intake, methane emissions, or growth performance. Bulls fed CG as a replacement for soybean hulls in LC diets had similar methane emissions (g/kg DMI) compared with bulls fed starch-based ingredients in HC diets with or without CG. Furthermore, the inclusion of CG as a replacement for soybean hulls in LC diets tended to decrease the methane emissions more than those in bulls fed CG as a replacement for soybean hulls in HC diets. However, when CG replaces soybean hulls in the diet, it does not compromise the DMI or ADG, but animal growth is compromised, decreasing CrG, feed efficiency in relation to CrG, and lean tissue in relation bulls fed CG as a replacement for maize in the diets.
We thank the São Paulo Research Foundation (FAPESP) for funding this research and Trouw Nutrition Brazil/Bellman (São Paulo, Brazil) for providing feed supplies for experimental diets.