Prices are central to economics and economic history. Jan Luiten van Zanden (Reference VAN ZANDEN2009) has called them the DNA of the economy, for they contain the information that steers the behaviour of economic agents. Prices tell us about the relative values of what was produced and consumed in the past. Taken together, they tell us about the value of money, that is, whether there was inflation or deflation. When input and output prices are compared, they are a guide to productivity change. They tell whether assets, such as shares, bonds, gold and silver, were becoming more or less valuable. As a colleague of mine has put it, more elegantly: ‘the individual price illuminates very little, rather like a distant star in the night sky, but prices – taken in concert over a range of commodities and tracked over time – tell us much, albeit on the basis of inference, about the material conditions of life in past times’ (Kennedy and Solar Reference KENNEDY and SOLAR2007, p. 1).
Systematic collection of retrospective price data with an eye to economic or historical analysis probably dates to the first of half of the nineteenth century, with the major figure in Britain being Thomas Tooke, whose interest in monetary theory led him to compile numerous price series, drawn largely from price currents. In the late nineteenth century James Thorold Rogers, in studying English social history, pushed price collection back into the Middle Ages by extracting prices and wages from the accounts of Oxford and Cambridge colleges and other institutions. The collection of historical prices took a great leap forward in the interwar period with projects underway in many countries, some with the encouragement and coordination provided by the International Scientific Committee on Price History, created by William Beveridge and Edwin Gay in 1929 with funding from the Rockefeller Foundation (Cole and Crandall Reference COLE and CRANDALL1964). Many early collectors of price data were concerned with tracing macro-economic developments, notably cycles in economic activity and the impact of monetary changes, but fairly quickly prices were also collected in order to assess changes in the standard of living for workers.
Most economic historians are users of price information and might want, or perhaps ought, to be more cognisant of where those prices have come from and of how accurately they capture such valuations. Here we address a range of seemingly technical issues that often pose important problems when interpreting price series. Our concern will be with prices of commodities published in price currents and newspapers during the eighteenth and nineteenth centuries. We hope that other producers of price series may benefit from these reflections on problems with the prices often found in these sources and that users may be warned about underlying sources of error, particularly before analysing historical price series with increasingly sophisticated econometric techniques.
We will be concerned with prices for individual commodities, which, among other uses, can contribute to the construction of indices of general price levels. The literature on the theory and practice of making price indices and on their uses is extensive. Readers interested in this subject and, in particular, in the practical problems involved in creating indices where observations on prices are incomplete would do well to consult the work of Jan Tore Klovland (Reference KLOVLAND1993, Reference KLOVLAND2005, Reference KLOVLAND2014a). Klovland (Reference KLOVLAND2014b) also discusses a problem more prevalent on the continent than in Britain, which is changes in national currencies.
We focus on the prices of commodities rather than those of assets. Some problems will be similar, but asset price formation and reporting differed in certain ways. Brokers were more common in stock and exchange markets and were often more regulated than the merchants in commodity markets, with prices quoted often having some official imprimatur. Assets were generally more homogeneous than commodities – wheat could vary considerably in quality; 3% consols did not. As a result, the ranges of prices quoted in any given day for assets were generally much narrower than for commodities.
The article is organised as follows. First, we ask the simple, but surprisingly difficult to answer, question: where did the prices found in price currents and newspapers come from? Then, the core of the article addresses three problems in working with price data. The first is missing observations and price inertia: what do missing observations signify? How to deal with them? Why do the prices published in newspapers and price currents sometimes remain constant for days, weeks, even months on end? The second problem concerns how to interpret and deal with prices that are reported not as a single value, but as a range between a low price and a high price. Transactions may have taken place at many different prices, often because commodities varied in quality. Over time the prices of different qualities may have been reported or quotations may have been extracted from different sources, which leads to the third problem, that of splicing together series that may differ in their levels and ranges. After a general discussion of quality variation as it relates to price series, the article concludes.
I
Where do prices come from? Records of the prices at which market transactions take place might come from the buyers, the sellers or, in cases in which the market regulations required that transactions be recorded, from market authorities.Footnote 1 Hence prices may be found in the account books of farmers or the ledgers of firms, though such sources are relatively rare and often survive only for short periods, a great exception being that bureaucratic behemoth, the Dutch East India Company (de Zwart Reference DE ZWART2016). Traces of prices paid may survive in records of large consumers, notably governments but also religious, charitable or educational institutions. From such sources come most price series for medieval and early modern Europe. Or prices may be found where governments, national or local, saw fit to keep track of trade in key goods. The most obvious examples are the widespread assizes of bread, as well as the national corn returns in Britain (Brunt and Cannon Reference BRUNT and CANNON2015). But most markets were not so thoroughly regulated or monitored.
The main actors in most markets were merchants, sometimes as sellers, sometimes as buyers, sometimes as both (there were also brokers who brought together sellers and buyers without committing their own capital). Merchants’ private records, where they survive in large numbers, are a fruitful source of price information. But merchants also had reasons for sharing information about prices. If they bought or sold on behalf of persons situated at a distance, they might keep them apprised of market trends by letter.Footnote 2 In such letters they might be reporting the prices at which transactions had taken place, or conveying prices at which transactions might take place. For example, Bergen merchants, eager to have the custom of northern Norwegian fishermen, sent them each spring lists of prices that they might expect to receive for their catch and that they might pay for goods to be purchased in Bergen (Klovland Reference KLOVLAND2014a, p. 280). If merchants had many correspondents, these letters might take on, at least in part, a more formal character with the merchant's observations repeated, sometimes in print, to most or all clients. Price lists in merchant letters date back to the medieval period (McCusker and Gravesteijn Reference MCCUSKER and GRAVESTEIJN1991, p. 22).
A rare view of this world of merchant circulars came when in 1835 a British government commission took up the issue of the costs of sending commercial information by post (UK, PP 1836 xxviii (50)). Merchants, mainly from London, argued that their ‘price currents’ deserved a preferential rate. By this they did not mean three publications that survive from the 1830s: the London Mercantile Price Current, Prince's Price Current and Wettenhall's Course of Exchange circulated and paid postal rate as newspapers. The merchants were concerned with their own reports on market conditions, which the Post Office treated as letters. As James Cook, a produce broker, noted, ‘there are prices current published almost every day, particularly after large public sales’ (p. 16). Henry Burgess, asked if many prices current were published in London with reference to different trades, replied, ‘yes; sugar, coffee, cotton, and corn, dry-salteries, and a great many other trades’ (p. 21). These specialised reports of market prices were often distributed in significant numbers – the witnesses speak of circulations in the hundreds, even thousands. Not all were sent by the post; some were sent in bulk by coach or ship.
The testimony of G. M. V. Dadelzen, a general merchant with offices in London, Liverpool and Scotland, gives an idea of the flows of commercial information (p. 19). He regularly sent London price currents to his agents in Hamburg, Prussia and the Mediterranean, and presumably to his various offices in Britain. His firm also sent its own market reports, printed on the back of letters, ‘80 to 100 every foreign post night’. Dadelzen received prices current from Liverpool and Glasgow, subscribed to the Hamburg price current and stated that ‘similar ones are sent to us every post day’. He estimated that at Hamburg and Amsterdam hundreds of copies were printed.
Much of this price information was produced from self-interest. Many ‘prices current’ were produced by London commission merchants and brokers in order to keep their customers in cities and towns around the UK up to date on prices. They also hoped to attract new customers, for by the 1830s London merchants were seeking to bypass regional distributors and sell directly to grocers and other local retailers (pp. 16, 30). In so far as price quotations were intended to canvas for custom, one might have some doubts about their reliability; however, accuracy in price quotations might have been a matter of reputational capital.
The testimony to the Commissioners thus reveals a large undergrowth of specialised ‘prices current’, of which, unfortunately, few remain for the scrutiny of economic historians. We are left with the more general price currents that, as newspapers, ended up being conserved in the British Library and other repositories. But it would not be surprising if the general price currents and the newspapers got much of their information from these more specialised ‘prices current’. On the relatively rare occasions when newspapers do cite their sources, they can be seen to be reproducing or summarising some merchant house's circular. In the early issues of the Economist prices for cereals were from Messrs Gillies and Horne's Circular, and in 1848 New York cotton prices were quoted from Messrs Abraham Bell and Son's Circular and New Orleans prices from that of Messrs Morton, Toulmin and Coats.
One particularly good description of commercial information concerns reports on the Liverpool cotton market received in 1835 at the Lloyd's Rooms in Manchester:
… the first report appears at four o'clock p.m., and gives the tone of the Liverpool market up to half-past one o'clock of the same day, with the opinion of the writers as to the probable business of the day – the second report arrives at seven o'clock, giving the sales of the day, and on Fridays, also sales of the week, and arrives here in time to enable foreign merchants to advise their friends of the prices of this important staple. (Manchester Courier, 30 May 1835)
It would be surprising if these reports were not the source of the detailed commentaries on the Liverpool cotton market that appeared in Liverpool and Manchester newspapers at the time.Footnote 3 These newspapers quoted the quantities sold and the prices of upwards of 20 sorts of cotton.
The cotton market was hugely important and concentrated in Liverpool, so reporting was highly organised. This was probably also the case for commodities such as East India produce sold in London and Amsterdam, wool sold in London and Bradford, and coal in the London market. In the coal market Ralph Clarke, a London coal factor, was sending prices of various sorts of coal to coal-owners and merchants in the north around 1800; such price information had been sent regularly since the early 1770s (Smith Reference SMITH1961, p. 147). But the markets for agricultural produce and raw materials in smaller cities and towns such as Hull, Aberdeen or Cork were unlikely to have generated printed circulars. The prices quoted in their local newspapers are likely to have come from asking local merchants about the state of the markets.
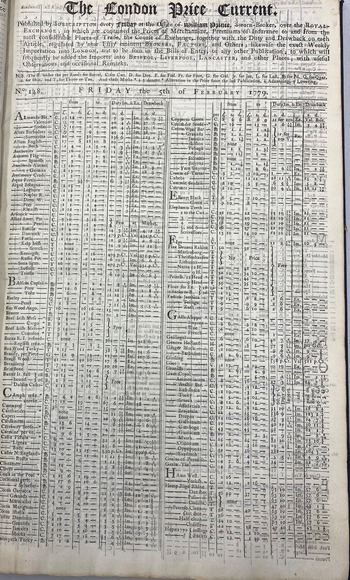
Since few of these ephemeral market reports survive and even less is known of how they were compiled, we must trust that newspapers and general price currents were able to find well-informed market participants and to obtain from them regular and accurate accounts of the prices at which transactions were taking place (see Figure 1 for an illustration of a late eighteenth-century price current). But even here, source survival remains a problem. Few long runs of price currents survive for the seventeenth and eighteenth centuries (McCusker and Gravesteijn Reference MCCUSKER and GRAVESTEIJN1991) and for Europe's leading economies, Britain and the Netherlands, there are large gaps during the period of the classic Industrial Revolution (Posthumus Reference POSTHUMUS1943). Before the 1830s newspapers reported a much narrower, though gradually increasing, range of prices, mainly for agricultural commodities. We now take up various problems that arise when working with the prices quoted in surviving price currents and newspapers.
A late eighteenth-century price current
Source: London Price Current, 5 February 1779, courtesy of Guildhall Library, City of London.

II
A common problem with data drawn from price currents and newspapers is missing observations. Sometimes there are gaps in source survival, but often on some days, or series of days, there are simply no prices quoted in the source. One possible reason is that no market took place. Wars, epidemics and other disasters could disrupt commercial activity. But, supposing that buyers and sellers did have the opportunity to meet, does the absence of price quotations mean that there were no transactions? Possibly. Or does it mean that the publication's contact in the market failed to deliver the information? More likely.
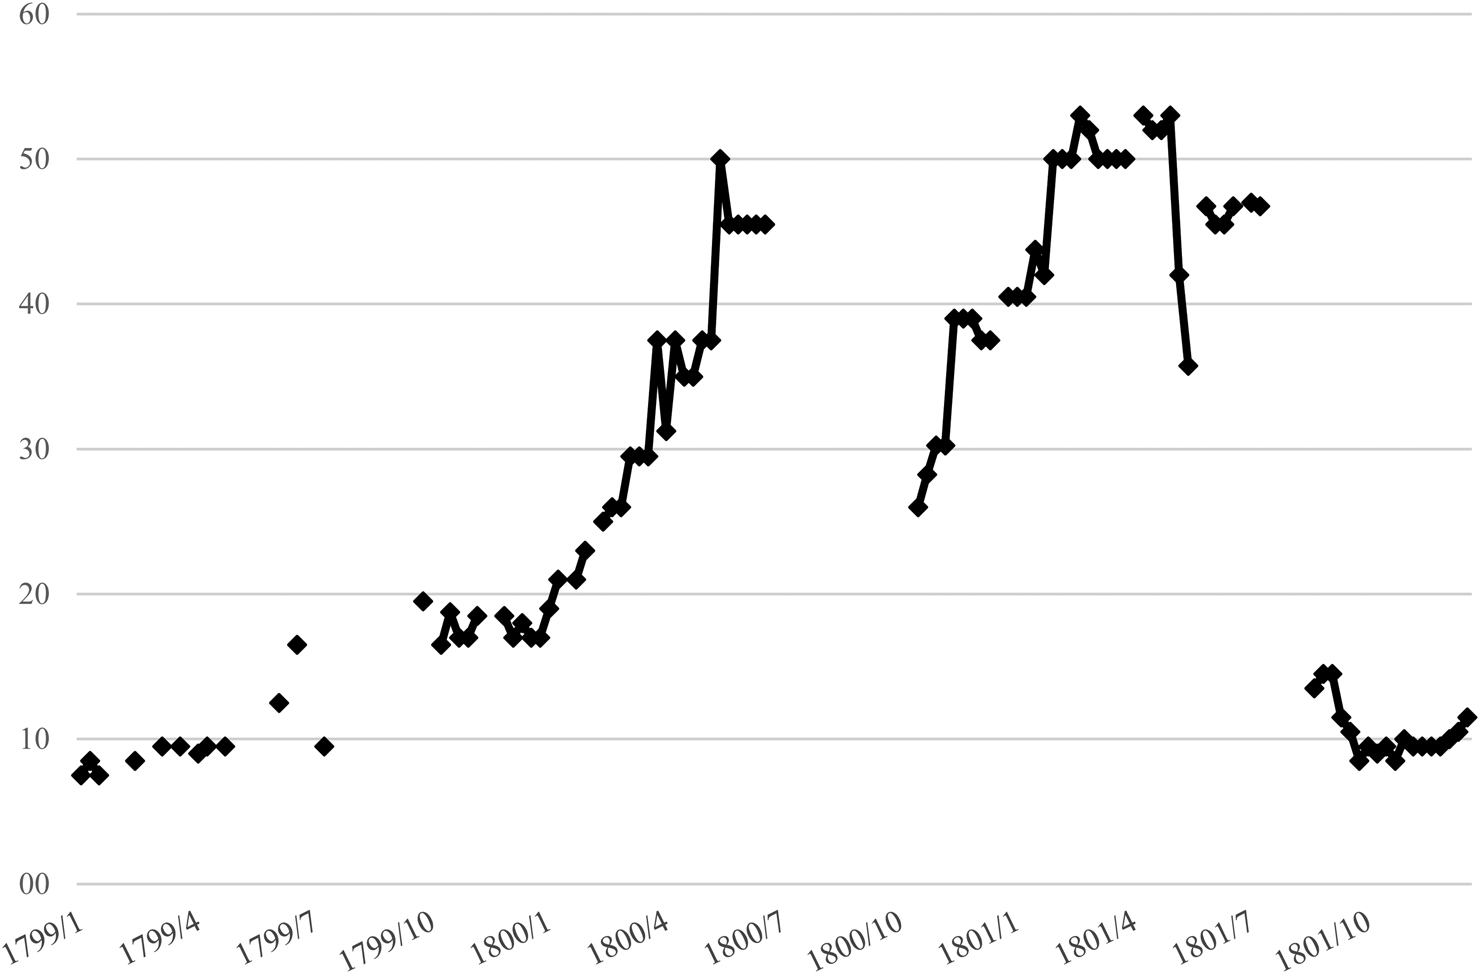
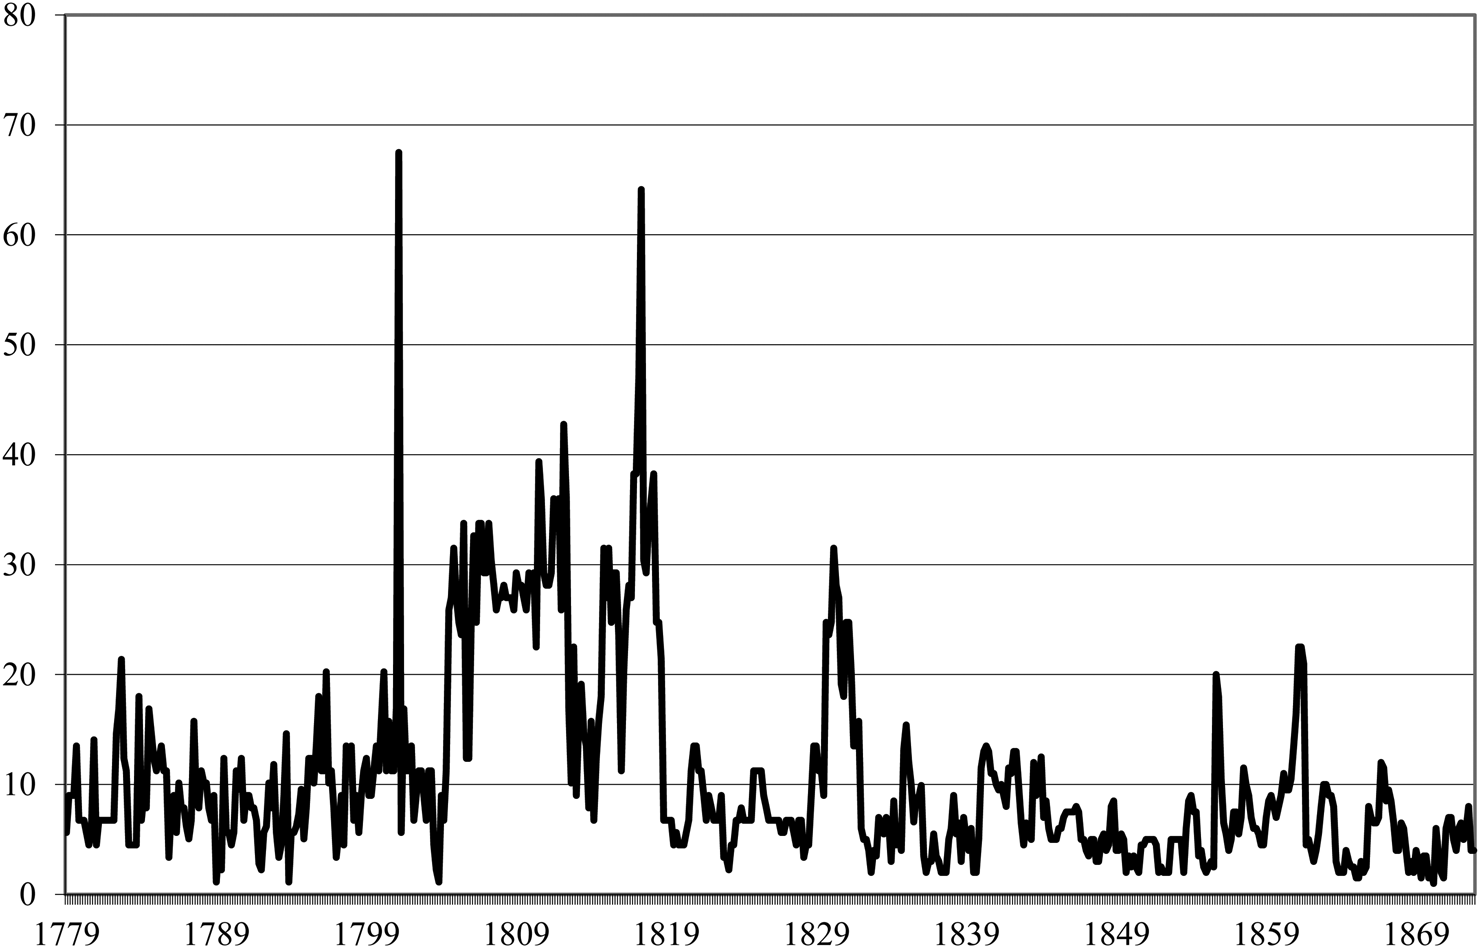
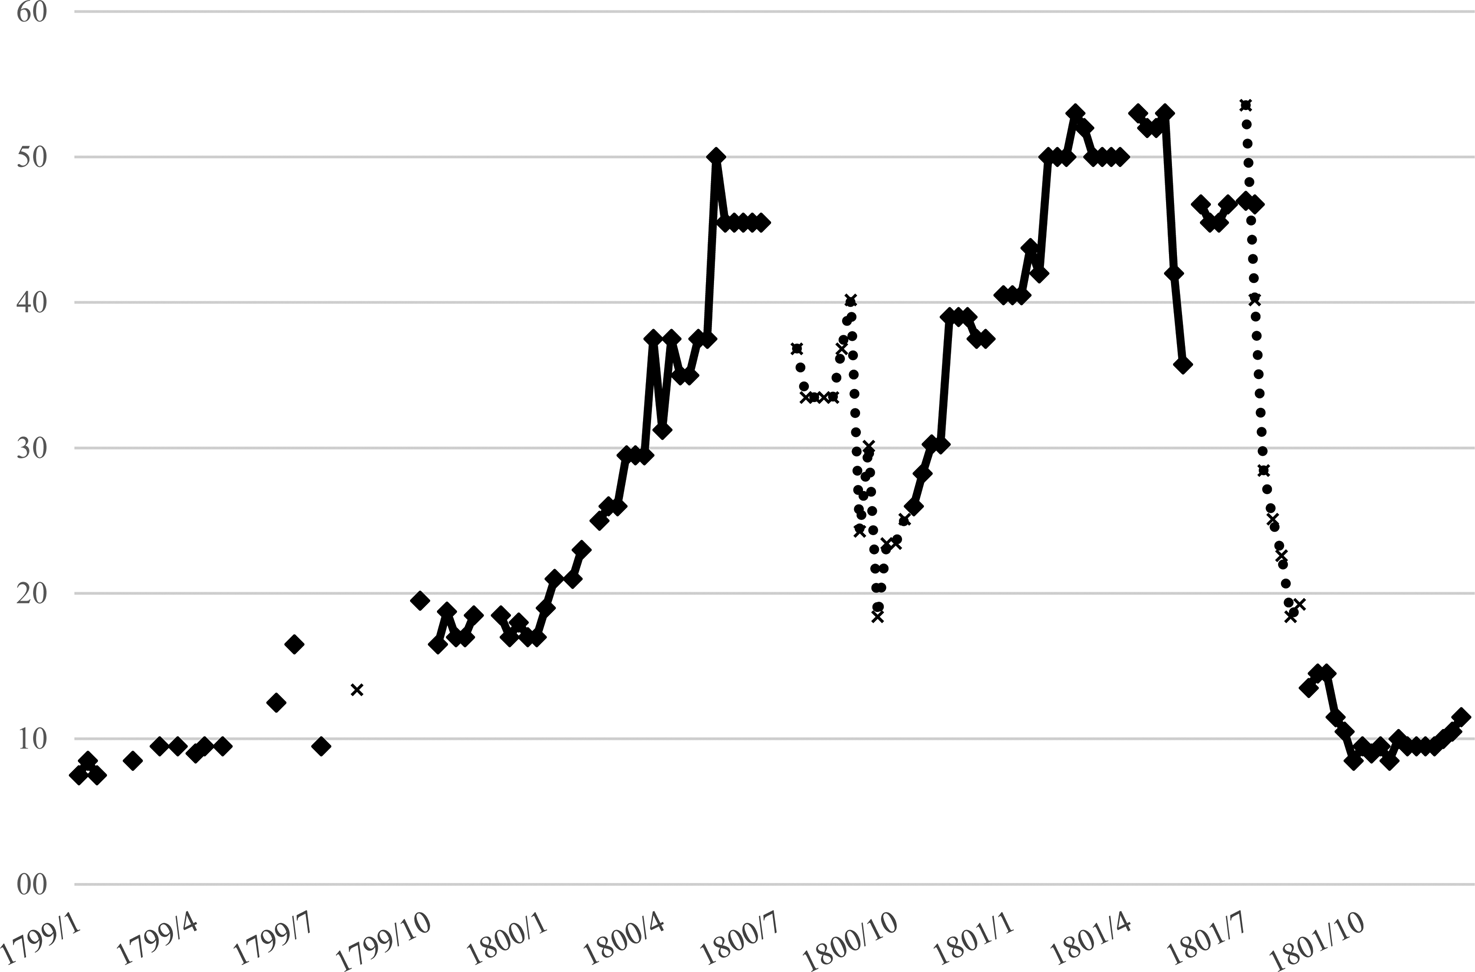
Consider potato prices in Belfast during the subsistence crisis of 1799–1801, an episode during which the prices of potatoes and cereals rose to levels comparable to those during the Great Famine of the late 1840s, though without a comparable mortality peak (Kennedy and Solar Reference KENNEDY and SOLAR2021). As can be seen in Figure 2, there are many missing observations in the weekly price quotations from the Belfast Newsletter, especially during the late spring and early summer of 1800 and 1801, periods when we would expect prices to be at their peak. A few of these missing observations correspond to weeks when no copies of the Newsletter survive and somewhat more to surviving issues in which no prices were quoted for any products. General reporting of prices is notably infrequent in 1799. However, most missing observations for potato prices from early September 1799 until the end of 1801 occurred in weeks in which there was a quotation for the price of oatmeal, the other main foodstuff in the north of Ireland.
Potato prices in Belfast, 1799–1801 (shillings per bushel)
Source: Belfast Newsletter.

There is sufficient price information here to say that prices rose at least fivefold by the spring of 1800, fell sometime in the late summer and early autumn, rose again to a peak more or less comparable to that in 1800 by the spring of 1801 and fell back to more or less normal levels sometime in the late July or early August. But the missing observations leave several uncertainties. When did potato prices begin to start upward in the late summer of 1799? How far did prices fall back in the late summer and early autumn of 1800 and when did they start upward again? When did the fall in prices, marking the end of the crisis, begin? Was the peak in potato prices higher in 1800 or 1801? One strategy would be to search for information on potato prices at other markets in Ireland, on the (strong) assumption that markets for potatoes were well integrated. Here it is not necessary that the levels of prices be the same across markets, only that their movements be similar. Unfortunately, the only other market in Ireland and Britain with weekly potato price quotation is Cork, and its returns are even more intermittent than those in Belfast. But it turns out that the saving grace in 1799–1801 is that in some of the weeks during which there were missing observations for potato prices quoted in shillings per bushel, there were quotations in pence per pottle. In the section on splicing we take up the problem of how to make these series comparable.
Sometimes price quotations are missing in a systematic way. Agricultural commodities generally have very seasonal price movements. In the off-season, when little was traded, there was often no price quoted or if a price was quoted, it was usually a relatively high one. A problem then arises if one wants an average price for the year: averaging across all prices for the year will tend to bias upward the prices in years when the off-season price is quoted relative to years in which it is missing. Unless this effect can be mitigated by weighting across seasons for the quantities traded, it might be better to throw out the off-season observations.
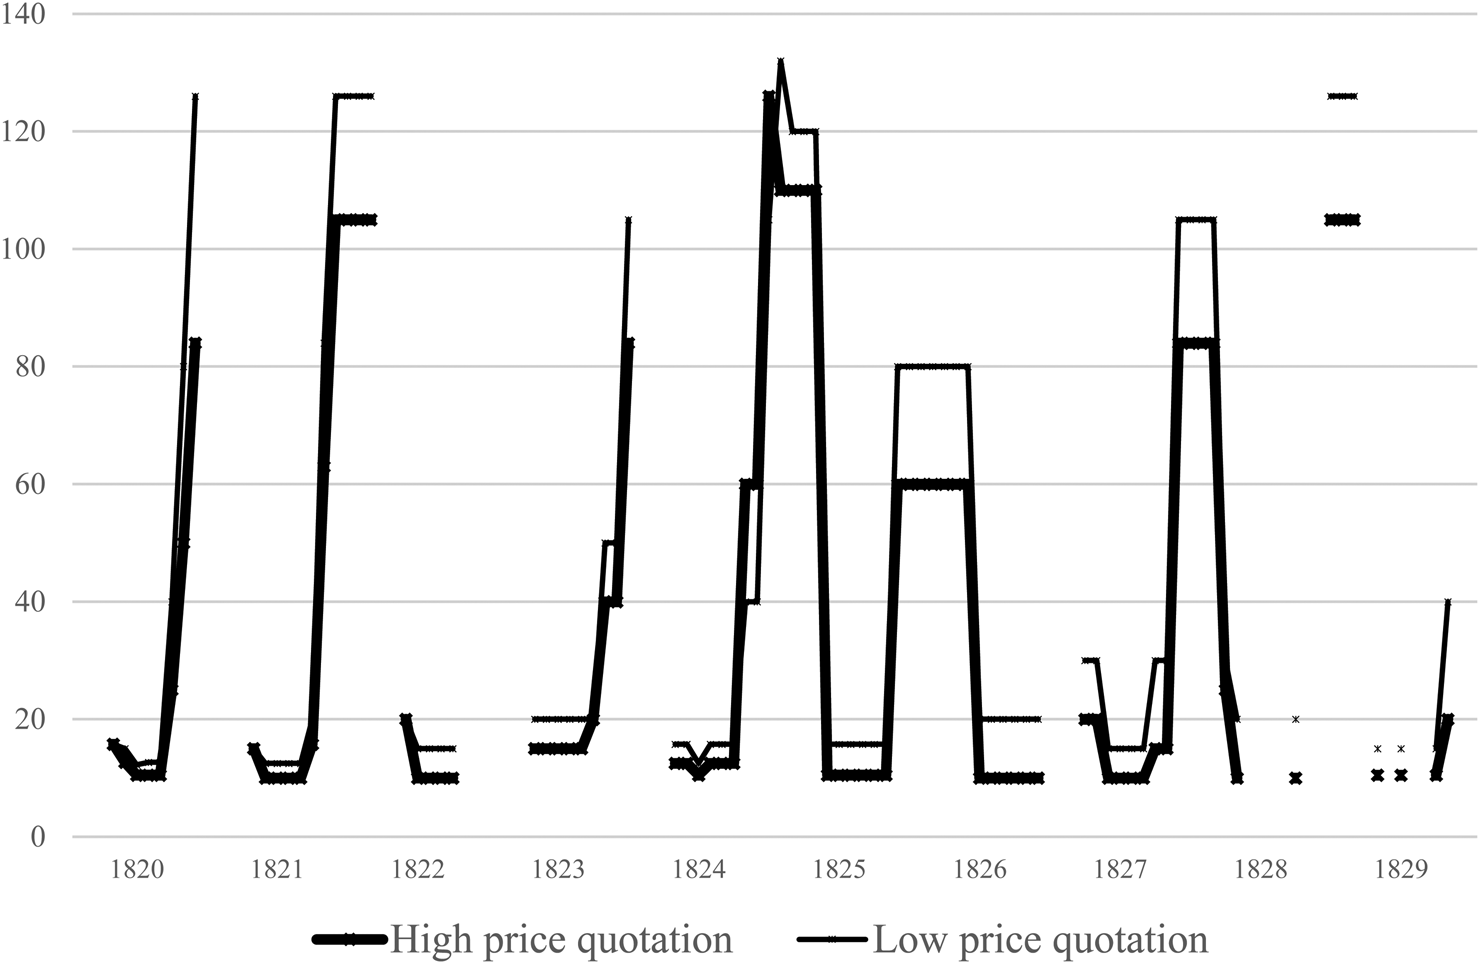
An extreme example of seasonal price fluctuations concerns marine insurance to the Baltic. Since the greatest threat to ships in the Baltic was ice, the rates to Riga, when they were quoted at all, rose to staggering levels during the winter (Figure 3). In the 1820s rates were usually missing during the winter months, though the number missing varied from year to year. Since most traffic occurred from late spring to early autumn, a good idea of the average rate prevalent in a given year would call for using only the observations during these months. Taking averages of all the monthly observations yields not only much higher yearly rates but considerable fluctuations from year to year depending on the number of winter rates that were quoted.
Monthly marine insurance rates: London–Riga, 1820–9 (shillings per £100)
Source: London New Price Current, 1820-9.

The way in which the maritime insurance rates tend to remain constant, at different levels, during the summer and winter months hints at what might be called ‘price inertia’. Prices sometimes remain suspiciously constant for weeks, months or even years. Gayer, Rostow and Schwartz (Reference GAYER, ROSTOW and SCHWARTZ1953) noted this problem in iron prices during the 1810s. In finance the phenomenon of unchanged prices goes by the name of zero returns and its prevalence is used as an indicator of market illiquidity or the lack of information flows to participants (Lesmond, Ogden and Trzcinka Reference LESMOND, OGDEN and TRZCINKA1999). The assumption is either that no transactions took place or that no transactions need have taken place. This could also have been true of commodity markets in the past, though other explanations seem more plausible. Prices could have been very stable, though often the volatility of prices before and after these episodes of inertia makes such stability unlikely. Another is that contemporaries did not find it significant to record relatively small price changes, for example, in fractions of the smallest coins in circulation. But a more likely candidate is what might be called source delinquency. When a publication received no new information on prices for a given day or week, the publisher or printer, instead of leaving the space blank to signify the absence of a quotation, may simply have chosen to repeat the previous observation.
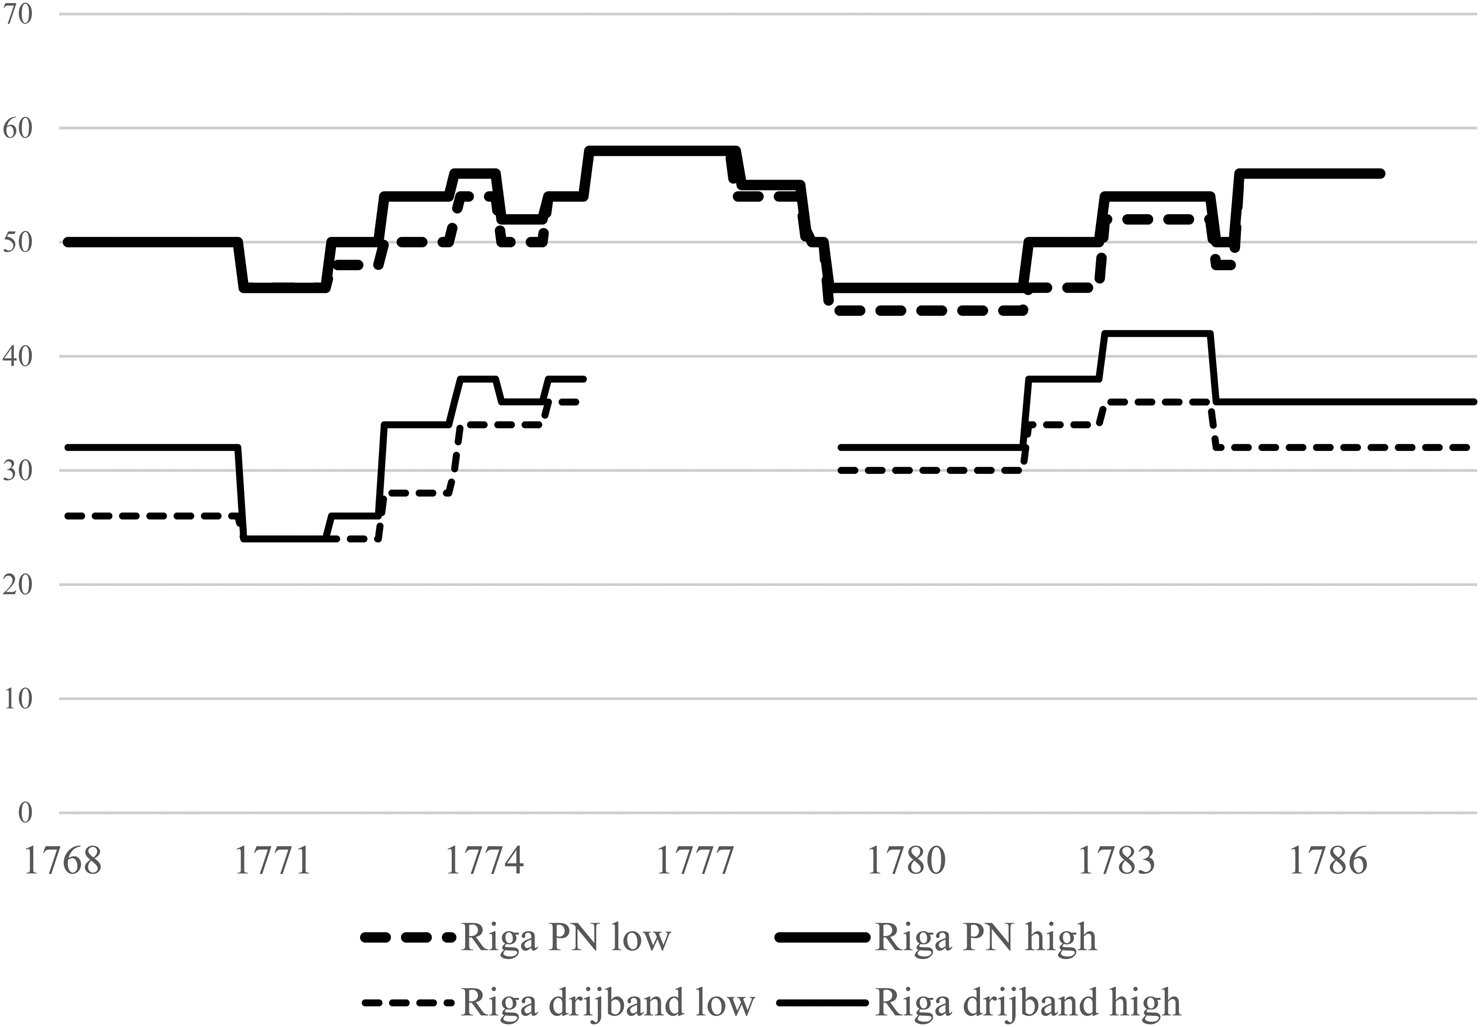
Another example of price inertia involves the monthly prices of two sorts of flax in the Amsterdam market in the late eighteenth century (Figure 4). On average the price quotations for Riga PN changed only once every 13 months and those for Riga drijband only once every 16 months. These average durations, not far from one year, might suggest that the prices changed when information on the harvest became available, but they conceal great variation. The periods of constant prices for Riga PN range from 1 to 34 months and for Riga drijband from 1 to 45 months. Periods of 9 to 15 months, roughly a year, comprise only a third of the intervals for each product.
Prices of Riga flax in Amsterdam, 1768–88 (guilders per pond)
Source: Harvard Business School, Baker Library, Special Collections: Kress Collection, Notitie der prysen van diverse waaren en Koopmanschappen uyt de prys couranten (Memoranda of the prices of various wares and merchandise from the price currents), Amsterdam, 1709-87, 6 volumes.

Whilst it is possible that Riga flax was absent from the Amsterdam market for long periods, this seems unlikely. In the 1770s flax and hemp constituted 16 per cent of Amsterdam's imports from the Baltic and trade was uninterrupted during this decade. Riga was also the Baltic port from which the most ships arrived in Amsterdam in the 1770s (De Buck and Lindblad Reference DE BUCK and LINDBLAD1983). Similar statistical information is, unfortunately, not available for the 1780s, but there is no reason to believe that flax imports from Riga were any less important during that decade. If flax was being traded in Amsterdam throughout the 1770s and 1780s, the long stretches of unchanged prices could have reflected the microstructure of the market. Flax could be stored, so merchants, if they coordinated, may have been able to maintain largely unchanged prices. This would be an economic phenomenon worthy of investigation. Or prices may indeed have changed more often, but these fluctuations were not picked up by the price current.
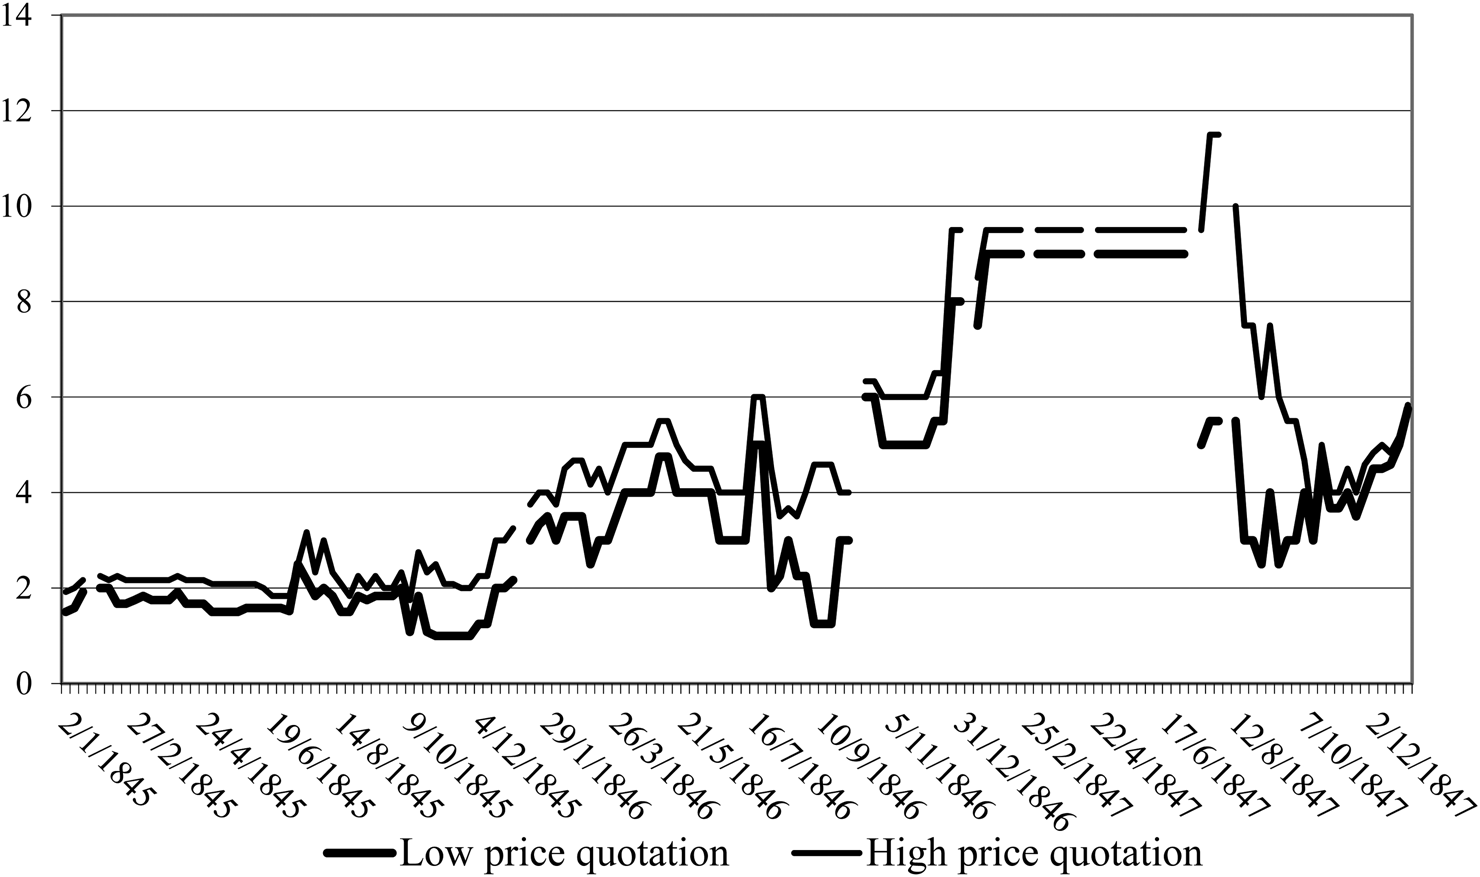
Another case of price inertia can be observed in Belfast during the Great Famine of the 1840s. As shown in Figure 5, the price of potatoes quoted in the Belfast Newsletter remained at the same level from the end of January until early July 1847. Given that potatoes were extremely scarce during this period, it seems implausible that prices did not rise from their January level and that they showed no fluctuations. It was more likely that few or no potatoes were traded and the Newsletter, receiving no information concerning the potato market, left the quotations for 28 January in place. When prices did change, on 15 July, they were quoted over a range much wider than normal, from 5 to 9 pence (the usual difference between low and high prices was a half to one pence). Two weeks later the range was 5.5 to 11.5 pence. The Newsletter seems to have received information on the potato market, but it was ambiguous about the direction of change or there were very large differences in the qualities of potatoes being sold. This anticipates the discussion of price ranges in the next section, but the important point here is that the published prices from January to July do not seem to have accurately reflected the changing scarcity of potatoes in Belfast.
Belfast potato prices, 1845–7 (shillings per hundredweight)
Source: Belfast Newsletter, 1845-7.

It is not clear that the researcher can do anything about price inertia other than recognise that the quoted prices may not be informative about the state of the market. It may thus be better not to use them at all, that is, to treat them as missing observations.
III
Price currents and newspapers rarely quote a single price. In general, this happens regularly only in cases where the quantities being traded were being recorded, so that the single price is a weighted average price. Price currents and newspapers usually quote a low value and a high value, what may be interpreted as the range of prices at which transactions took place (rather than the bid and ask prices quoted in some asset markets). When ranges are the normal practice, there may still be cases in which only a single price is quoted, probably because there had been few transactions. Such cases are problematic because it is unknown whether this single price corresponds to the low price, the high price or an average price in adjacent periods. When there are price ranges, it is tempting to average the low and high values and to work with this average, but this practice can at times be dangerous, as we shall see in the following examples.
Our first example of unruly price ranges concerns wheat prices in Britain. Until the late nineteenth century wheaten bread was central to the diet, particularly in southern England, so wheat and bread bulked large in any index of consumer prices. Yet the wheat prices in the London market showed a marked widening of the range between the low and high prices quoted between 1805 and 1818 (Figure 6). Before and after this period the difference between low and high price quotations was typically 5 to 10 shillings per quarter, but during these years it was more commonly about 30 shillings and in a few cases much more. Although it was necessary to splice together information from different newspapers to construct the London series, this widening of the range did not correspond to one particular source. These large gaps between low and high prices could be found in all of the major newspapers quoting cereal prices – Bell's Weekly Messenger, Evans and Ruffy's Farmer Journal and the Public Ledger as well as various general price currents – and were not to be found in any of them before 1805 or after 1818. Comparisons with the official gazette prices and price series for wheat in Irish markets led Solar and Klovland (Reference SOLAR and KLOVLAND2011) to the conclusion that during these years prices for much lower qualities of wheat were being quoted, so they decided that the high quotations, rather than averages of the low and high quotations, were a better guide to wheat price movements.
Wheat prices in London: difference between high and low quotations (shillings per quarter)
Source: Solar and Klovland Reference SOLAR and KLOVLAND2011.

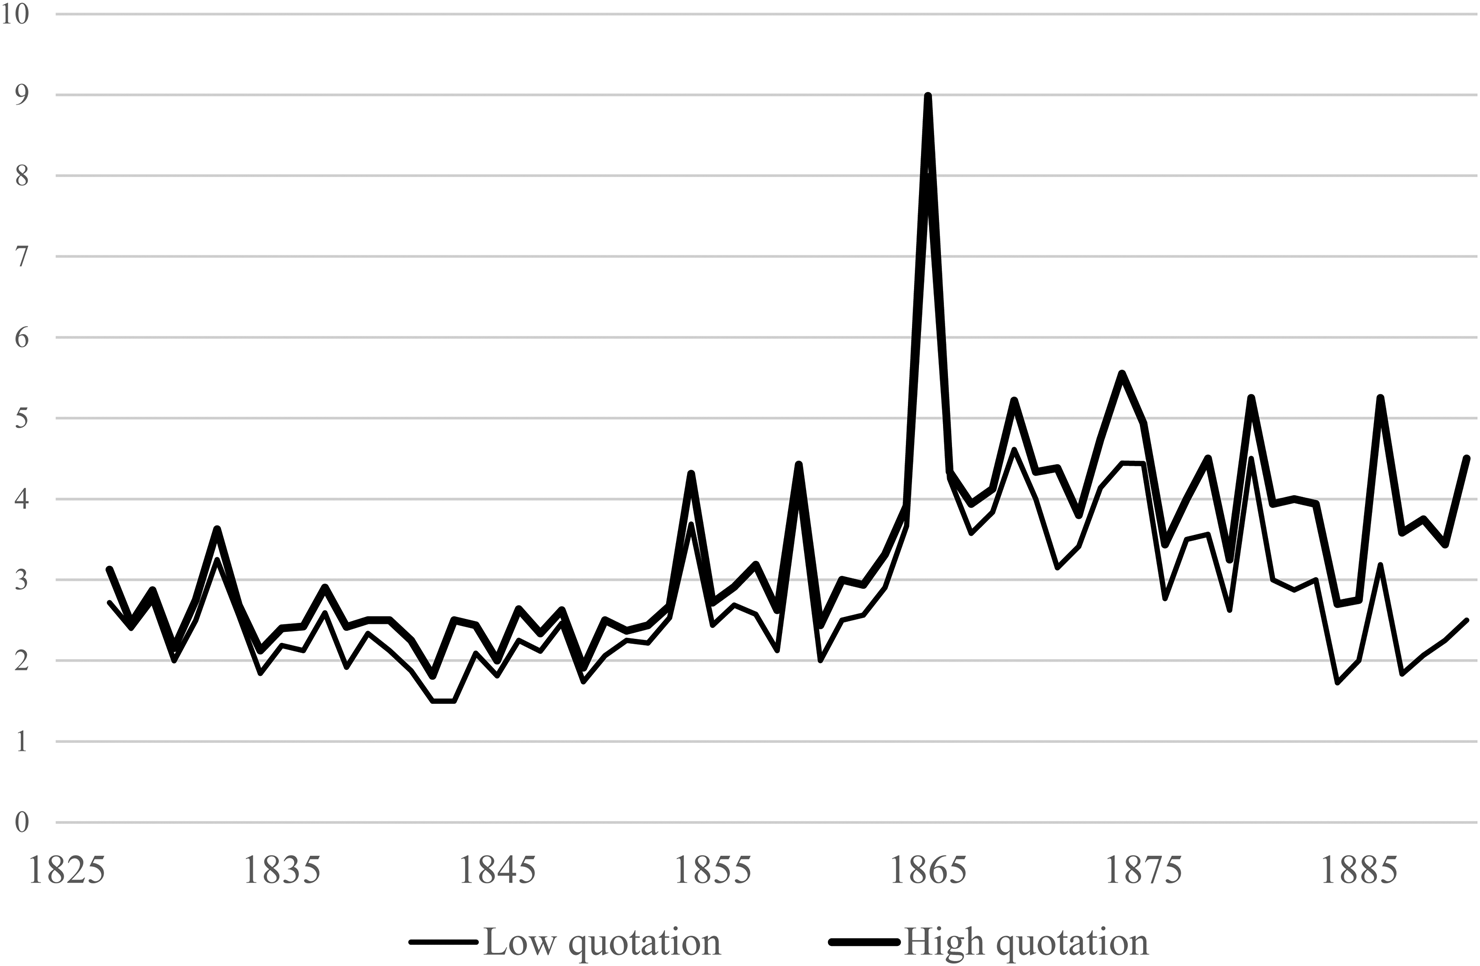
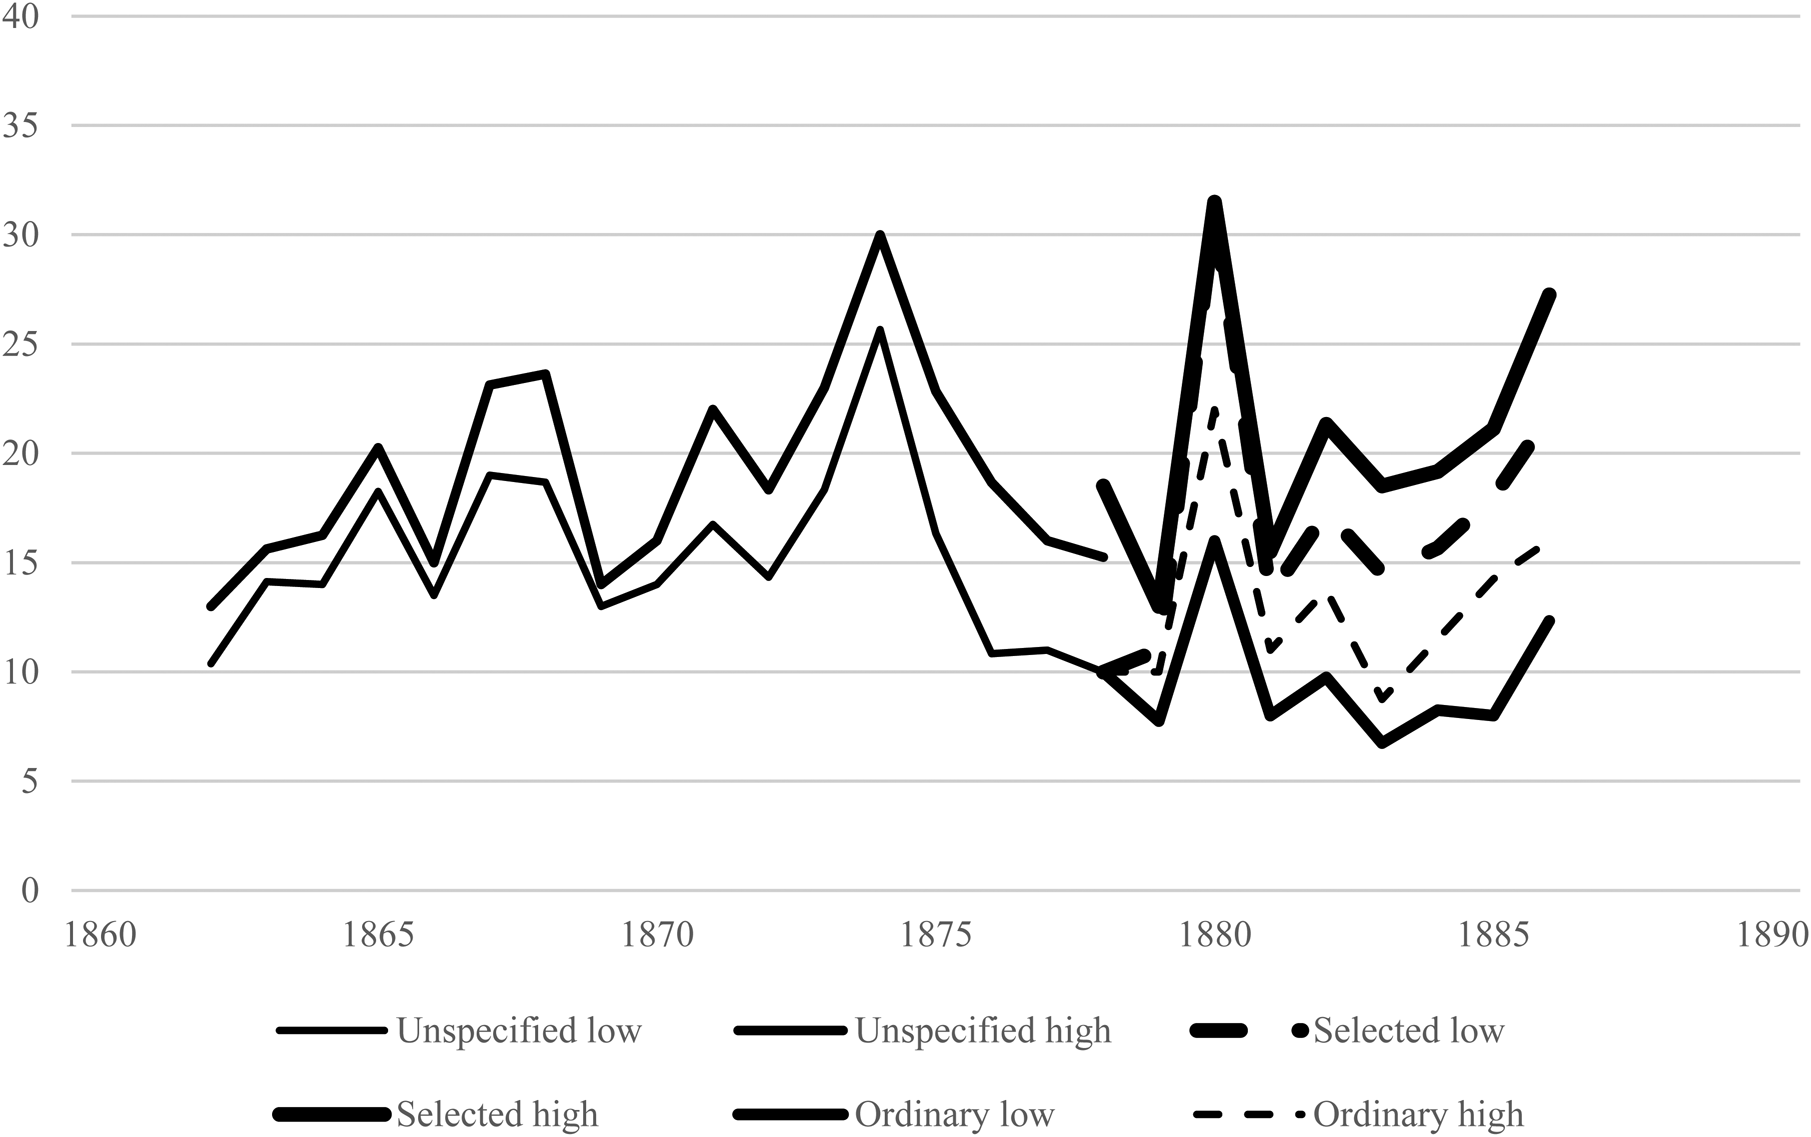
A second example of how the changing width of ranges may reflect changes in the qualities of the goods for which prices were being quoted concerns lemons in the nineteenth century.Footnote 4 Figure 7 shows the low and high prices quoted for Messina lemons in Boston. Until the 1860s these prices generally moved in synch, with a gap between them of about 25 cents; then, over the next two decades, this gap widened to a dollar and a half. The high quotations suggest that lemon prices, though volatile, stayed more or less the same, or perhaps declined only slightly from the late 1860s to the late 1880s; the low quotations, by contrast, suggest that lemon prices in the late 1880s may have been only half those in the late 1860s. Over the same period lemon prices in London showed a similar widening of the price range, as it rose from a few shillings in the 1860s to more than 5 shillings in the late 1870s (Figure 8). But from the late 1870s The Grocer, the source of this information, started quoting prices for two sorts of Messina lemons – ordinary and selected. The high price for selected lemons was roughly the same as the previous high price for lemons of unspecified quality and the low price for ordinary lemons was much the same as the low price for lemons of unspecified quality. In the 1880s the ranges of the quotations for each of the two varieties was about 5 shillings, but the range between the low price for ordinary lemons and the high price for selected rose to over 10 shillings.
Lemon prices in Boston ($ per box)
Source: Boston Courier, 1827-41; Atlas, 1842-55; Daily Advertiser, 1856-90.

Lemon prices in London, 1863–86 (shillings per box)
Source: The Grocer, 1862–86.

The range of lemon price quotations increased because a wider range of qualities were being sold in both the Boston and London markets. The British consul in Palermo explained in 1878 that this was due to transport changes (UK, PP 1879 (947), p. 1343):
The increased facilities of transport afforded by steam have proved injurious rather than beneficial to the trade. Formerly, when the trade was carried on in sailing vessels, which took 60 or 70 days to cross the Atlantic from Palermo, the export was confined to the best kinds of fruit, as alone able to bear so protracted a voyage. Now that a steamer can accomplish the transit in three weeks or less, fruit of inferior quality is also shipped…
Consuls also reported over-production in the late 1870s and early 1880s, leading to speculative exports of lesser-quality fruit (UK PP 1883 lxxiii (3736), p. 1378; 1886 lxvi (4761), p. 678; 1888 ci (5252-172), p. 3). Contemporary comment thus suggests that the high prices are probably more consistent indicators of the long-run trends in prices of a standard commodity, good-quality lemons, whilst low prices show the growing importance of lower-quality lemons in the market.
These examples suggest that before simply averaging low and high price quotations constructors of price series should carry out a careful analysis of how these ranges behave over time. If there are sudden increases or decreases in the ranges, as in the case of wheat prices, or gradually widening or narrowing of ranges, as in the case of Sicilian lemons, then additional research is called for in order to explain these movements and to find the correct solution for arriving at consistent and meaningful indicators of prices.
IV
The problem of dealing with price ranges often intersects with that of dealing with price information drawn from multiple sources. Publications appear and disappear; even if they already existed or continue to exist, they may start or stop quoting prices, entirely or for particular goods. Hence it is often necessary to join series of price observations from two or more sources. Such splicing requires careful attention to the underlying nature of the price information in the sources. Otherwise, it can lead to discontinuities either in the level or the volatility of prices in the spliced series.
Sometimes it is necessary or desirable to join together information from the same source. Changes can take place in the quality of goods for which prices are quoted or in the denominations in which they are sold. In the case of potato prices in Belfast in 1799–1801, discussed above, during the summer months potatoes stopped being quoted in shillings per bushel and were instead quoted in pence per pottle. A pottle was a much smaller unit of measure, so these price quotations probably refer to a retail market whereas the quotations per bushel may have pertained to a wholesale market. We do not know the exact contents of a pottle of potatoes, nor do we know the precise relationship between wholesale and retail prices, but we need not do so as long as there is some overlap between the price series. In this case it is regrettably short, only two weeks, but it suggests that the price in pence per pottle be multiplied by 3.48 to arrive at the level of the prices in shillings per bushel. The results of doing so are shown in Figure 9. The observations at the overlap show the imprecision of this splice, but the movements in the summer of 1800 would seem to suggest that the level is not too far off. The spliced series certainly brings much more definition to the movements of potato prices during this episode.
Potato prices in Belfast, 1799–1801 (shillings per bushel)
Source: Belfast Newsletter, 1799-1801.

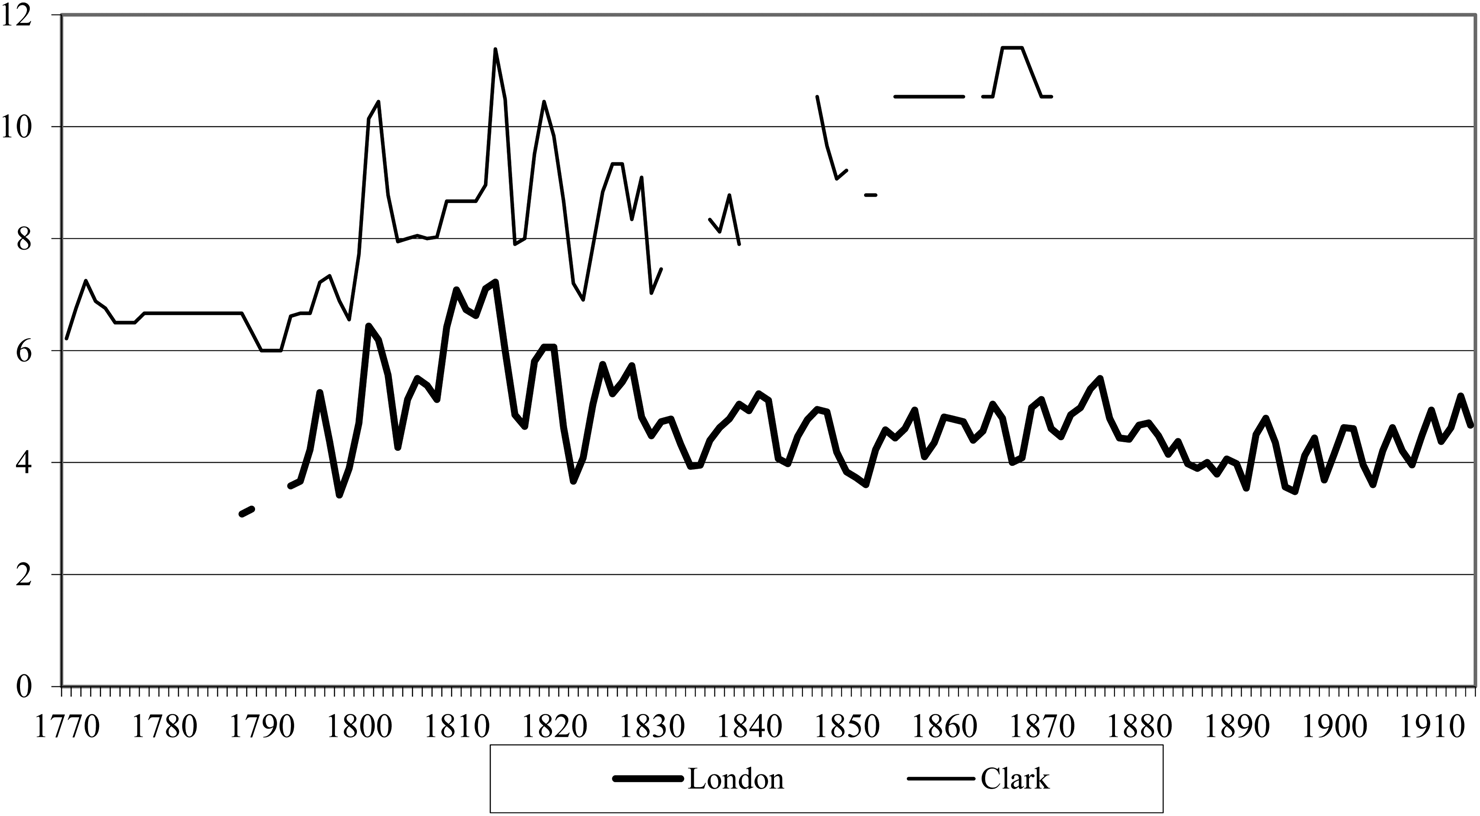
In constructing very long series for agricultural prices in England Greg Clark (Reference CLARK2004) has effectively spliced together many sources of price information using regression methods. Essentially, he adjusts for differences in the levels of the various price series for any given commodity by fixed effects corresponding to the source of the information. The accuracy of this method depends critically on having sufficiently long overlaps among the series for the regressions to be able to take full account of the differences in levels. When the overlaps are short, things can go badly wrong, as shown in Figure 10, which compares the Clark series for pork in the nineteenth century to a consistent series extracted from London newspapers. The movements of the two series are quite similar between the 1790s and the 1820s, no doubt because Clark's underlying series for this period is drawn from Gayer, Rostow and Schwartz (Reference GAYER, ROSTOW and SCHWARTZ1953), who relied on similar sources to those used by and Solar and Klovland (Reference SOLAR and KLOVLAND2011). But the series diverge thereafter, when Clark seems to rely on bacon prices from a 1903 parliamentary return and may have got the level at the splice very wrong (the 1903 price series may also be less than reliable).
Pork prices in England, 1770–1914 (shillings per 8 pounds)
Source: Solar and Klovland Reference SOLAR and KLOVLAND2011, p. 80.

Klovland (Reference KLOVLAND2014a) has proposed another regression-based method for dealing with multiple sources and missing observations. On a repeat sales principle, he uses regression methods to distill the general movements in prices from the percentage changes in the prices over different intervals. When many price series are available, this method permits the incorporation of as much information as possible from multiple series for the same good and provides a more systematic way of dealing with missing observations. The disadvantages are that the method treats all series included in the regressions as equally reliable and that it is difficult to discern which of the subseries is driving the final series. In any case the method is much more applicable to the later nineteenth century, when price evidence is abundant, than to the eighteenth and early nineteenth centuries, when it is much less so.
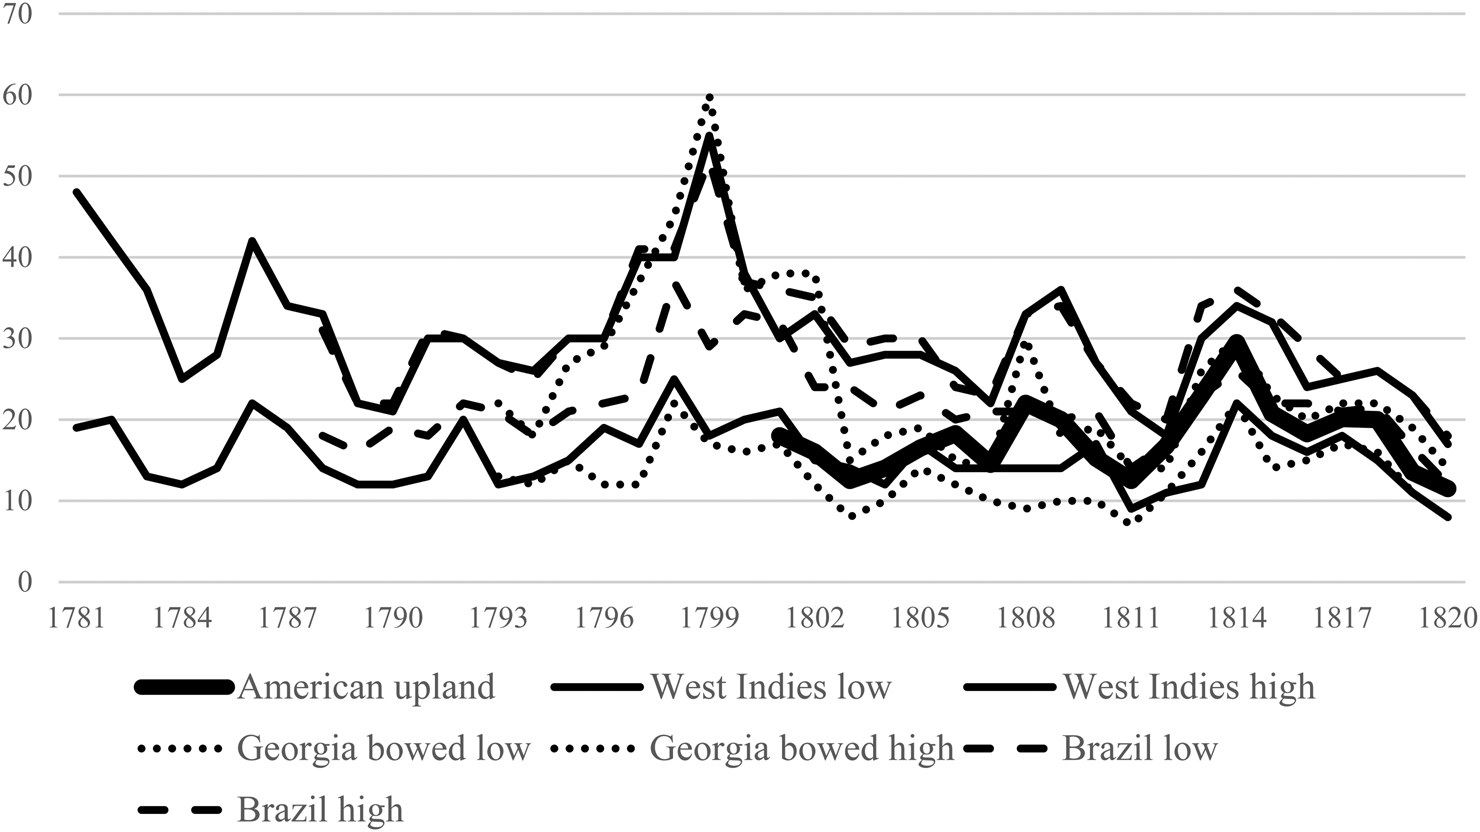
Ideally a lengthy overlap between the series to be spliced permits their movements to be better analysed, though it does not necessarily solve all the problems. Consider the difficulties of figuring out what happened to New World cotton prices during early industrialisation. In the eighteenth century Britain drew its cotton from the West Indies and Brazil; in the nineteenth century it imported the bulk of its cotton from the American South. The problem is figuring out what was happening to the price of some comparable quality of cotton over the period from, say, 1780 to 1820. The difficulties can be seen in Figure 11, which is based on the widely used series in Mitchell's Abstract of British Historical Statistics. The series for West Indies, Bowed Georgia and Pernambuco cottons, from 1781, came from Tooke's History of Prices and ultimately from price currents. The series for American upland, from 1801, was created for a return of wholesale and retail prices prepared in 1903, where the cotton prices are described as having been ‘extracted from the Annual Circulars issued by the Liverpool Cotton Association’, itself founded in 1841 (UK, PP 1903 lxviii (321), p. 44). Hence the precise origins of this series are not known, raising some doubts about its validity in its early years.
Cotton prices, 1781–1820 (pence per pound)
Source: Mitchell and Deane Reference MITCHELL and DEANE1962, pp. 490-1.

The problems, then, are how far back to rely on the American upland series and what series should be used to carry it back into the eighteenth century. The most obvious choice would be the other United States series, Bowed Georgia. These two series track each other reasonably well from 1820 back to around 1815, but as one pushes back towards the eighteenth century they are less consistent and into the eighteenth century the Bowed Georgia series shows widely fluctuating ranges between low and high prices. Note that it is not even clear where Tooke found the prices in the mid 1790s because Prince's London Price Current did not begin quoting prices for Georgia (not Bowed Georgia) cotton until early 1797.
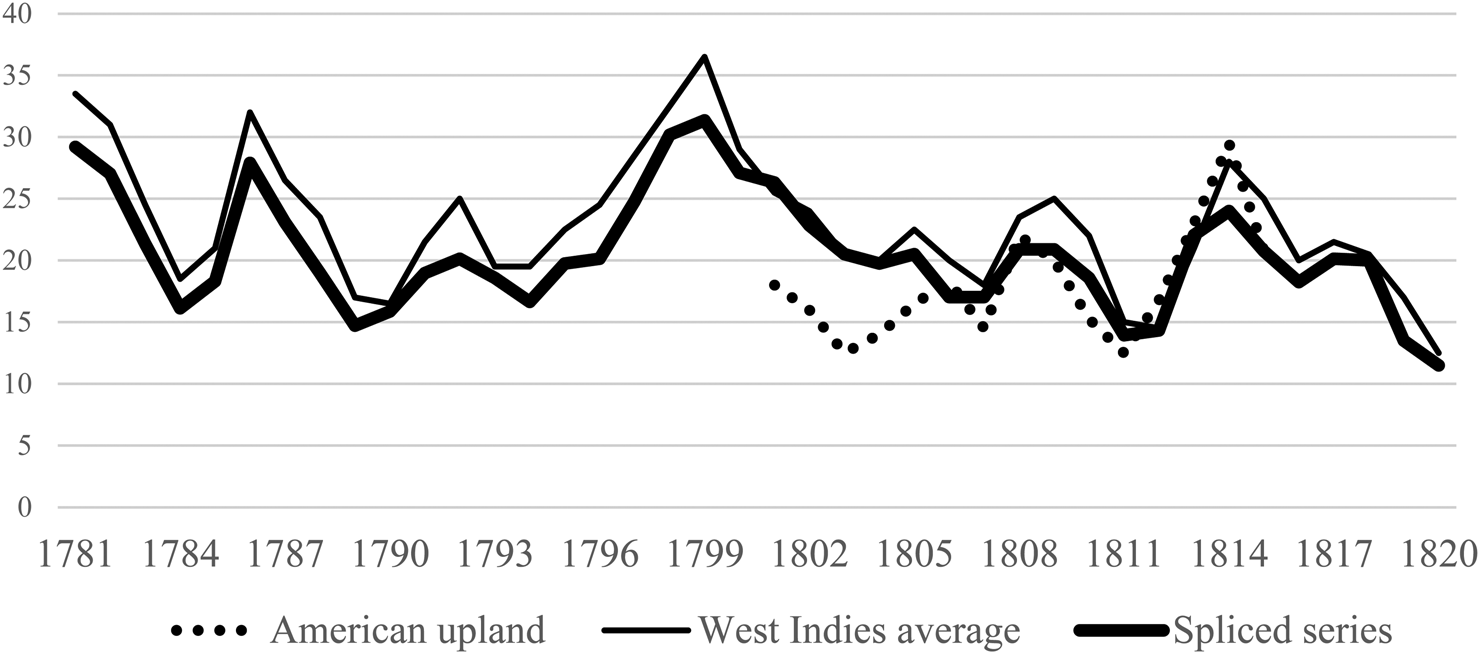
Such doubts about the series for American upland and Bowed Georgia suggest relying instead on the series for cotton from the West Indies or from Brazil, perhaps splicing one or the other to American upland series from about 1815. The general level of Brazil series is higher – it was a finer quality, but the width of its price range is more stable than that of the West Indies series, which would be an argument for using the average price for Brazil cotton to extrapolate back to 1788, when the Brazil series begins. Before 1788 there is no option: the average West Indies price is all there is. Figure 12 shows the results of splicing these series together, using the relationship between the series in two six-year overlaps, in 1788–93 and 1815–20, to adjust the levels. The newly created series clearly shows a different trend in cotton prices during the first decade of the century from that shown by the American upland series. It also generally lies somewhat below the average West Indies price, which is consistent with American cotton generally being less fine than that from the West Indies.
Cotton prices, 1781–1820 (pence per pound)
Source: Figure 11 and text.

Given the scarcity and irregularity of historical price information, splicing disparate series together is a common practice. It needs to be done carefully and be fully documented with careful guidance as to potential weaknesses.
V
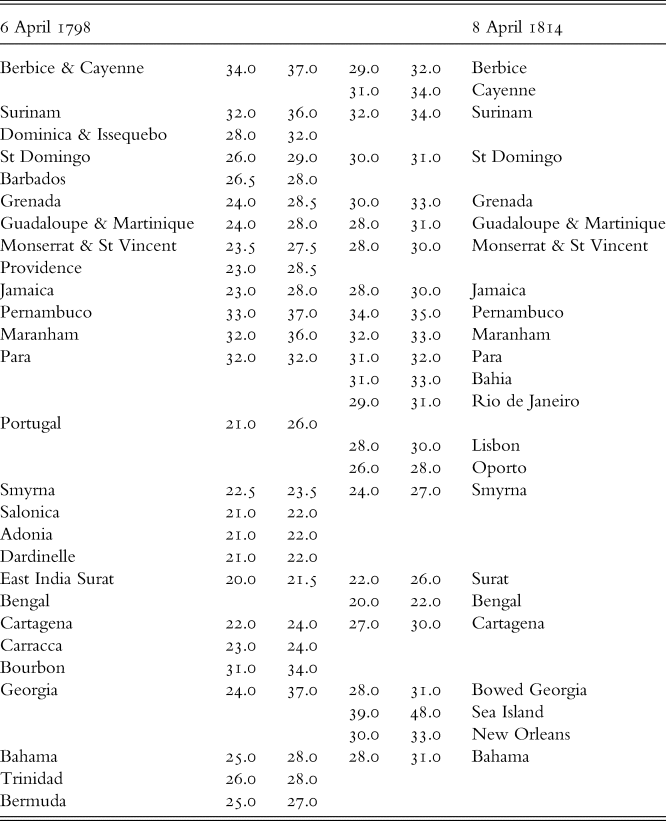
The examples of wheat, lemon and cotton prices have all raised the vexed question: which price? Price currents, and sometimes the newspapers, quoted prices for several qualities or provenances of a commodity, so there can be too many prices! Table 1 shows the panoply of cotton prices quoted by Prince's London Price Current in 1798 and 1814. What was the ‘West Indian’ cotton the price of which found its way into Tooke and later Mitchell? In 1798 ten sorts, defined by their provenance in the Caribbean, were listed and in 1814 eight sorts. In 1798 their prices ranged from 23 to 37 pence per pound, though for any given sort the width of the price range was typically 3 to 5 pence; in 1814 the overall range was 6 pence and the typical width 1 to 3 pence. As imports of cotton from the United States grew during this period, three sorts were quoted in 1814 instead of one sort as in 1798. The ‘Georgia’ cotton quoted in the late 1790s had a very wide price range, probably incorporating both ordinary ‘Bowed Georgia’ and superfine Sea Island cottons, making it difficult to identify the trend in US cotton prices.
Cotton prices, 1798 and 1814

Source: Prince's London Price Current, 1798 and 1814.
The more carefully defined the good is, the more likely the range of prices quoted will be narrow and consistent over time, so that the movements of its price will be more precisely shown. On the other hand, the more carefully defined the good is, the less likely that it may be representative of other qualities of the same good. Ideally, this representativeness should be tested by comparing the price movements of several qualities. In the case of cotton, prices of different qualities tended to be highly correlated later in the nineteenth century. The problem with doing the same exercise for the late eighteenth and very early nineteenth centuries is that the survival of the price currents is very limited and there are few quotations for cotton prices in newspapers until around 1820, when Liverpool newspapers start publishing a range of prices comparable to what is found in Prince's.
Over time price currents and newspapers tended to quote more prices for the same commodity. In the 1770s London newspapers quoted a single price range for wheat. By the early 1800s Bell's Weekly Messenger was quoting prices for red and white wheats of English growth as well as wheats from America, Danzig, Riga, Wismar, Russia and Vriesland. In the early 1840s Bell's price quotations distinguished red and white wheats coming from Essex, Kent and Suffolk, Norfolk and Lincoln, Northumberland and Scotland, and Ireland, as well as wheats of six foreign provenances, including hard and soft wheats from Russia and red and white wheats from Italy. So, what was the price of wheat in London? And how did it change over the late eighteenth and early nineteenth centuries? Which of the many prices quoted in the 1840s was the successor to the price of ‘wheat’ in the 1770s? Dealing with quality variations over time is one of the toughest problems in the construction of price series. One can only hope that the constructors are up front about the way in which they have done so and the implications of their choices for the trends and fluctuations shown by their series.
Over time as well, prices for the same commodity came to be quoted in more places, a boon to scholars interested in market integration. But for industrial history or some other purposes, the question of ‘which price’ might still arise. Prices at the place where trading was likely to be most intense would seem the obvious choice, but prudence would require that they be tested against those at other places.
VI
This survey of the possibilities and pitfalls of putting together commodity price series reflects the experience of over 40 years in the business. It is intended as a guide for those who want to exploit the riches still to be found in price currents and newspapers and as a caution for the users of price series based upon such sources. The former are encouraged, above all, to identify problems with their price data and to give users a sense of how the procedures they use to deal with the sorts of problems catalogued here may affect the interpretation of the resulting price series. The latter might want to pay more careful attention to where the prices came from and how the underlying data were transformed into published series, particularly before subjecting them to elaborate statistical analysis.