


Introduction
The measurement of snow accumulation on polar ice sheets and cold glaciers has been part of most glaciological programs and traverses since the International Geophysical Year (IGY) (Reference MellorMellor, 1959; Reference MeierMeier, 1967; Reference Bull. and QuamBull, 1970; Reference Giovinetto and Bull.Giovinetto and Bull, 1987). Reference Bull. and QuamBull (1970) presents a comprehensive discussion of techniques and results which, although somewhat dated, remains remarkably consistent with current practices. These include stake measurements, identification of total beta radioactivity horizons and identification of seasonally varying parameters such as dust concentrations and stable-isotopic ratios in pits and shallow cores. Recent work at Dome C (Reference Petit, Jouzel., Pourchet and Merlivat.Petit and others, 1982) illustrates the use of multiple techniques to assess net accumulation.
Stake Measurements
Since the IGY a variety of stake networks have been established at South Pole Station (SPS) to measure snow accumulation. This section focuses upon the three most extensive networks. For comparative purposes, all conversions from firn depth to water-equivalent depth were made using the empirical relationship
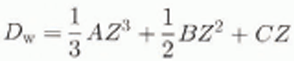
where A is −4.8 (10−4), B is 0.0196, C is 0.350, D w is depth (m w.e.), and Z is depth in meters of firn. Based upon many density measurements at SPS, this relationship has been verified as a good estimate to a depth of 15 m and has been used for most SPS accumulation studies (Reference Jouzel, Merlivat, Petit and Lorius.Jouzel and others, 1983, fig. 5).
42 pole pentagon
On 17 and 27 January 1958, a 42 pole pentagon was established with the center located 3 km windward (Fig. 1) of SPS (Reference GiovinettoGiovinetto, 1960). The poles were 300 m apart along the 12.6 km length, but the exact orientation of specific poles with respect to the station is unknown. Measurements were made at least once a year until November 1964, and data from only 36 of the 42 poles were available. The 6 year (November 1958–October 1964) average accumulation of ≈64.0 mm a−1 was reported by Reference Giovinetto and Schwerdtfeger.Giovinetto and Schwerdtfeger (1966), Table 1 presents the annual accumulation (An) in water equivalent (Equation (1)) and reveals the inter-annual variability of the spatially averaged A n and intra-annual spatial variability of A n. First, the large standard deviation (σ) in any given year largely reflects the roughness of the snow surface. This variability is important as it places a limit upon the degree to which a single A n value reconstructed from an ice-core record may be spatially representative. As the data indicate, the thickness of any annual layer reconstructed from a SPS ice core will reflect strongly the local accumulation conditions which are controlled principally by the surface topography.
The locations of all net annual accumulation measurements at South Pole Station with their respective averages (in mm w.e.). These include the pentagon, the 7 mile cross, 16 beta radioactivity profiles (11 from CNRS and 5 from OSU) and the OSU-1978 accumulation line along grid 130° on which pits 1, 2 and 3 are located. For the beta radioactivity records the upper number is the accumulation from 1965 to the sampling date (1984 for CNRS sites except P14 (1978); 1982 for OSU sites 1, 2 and 3; and 1985 for OSU sites 4 and 5), while the lower number is the accumulation from 1955 to 1965.

Annual net accumulation for 36 poles of the 42 pole pentagon

When averaged over the entire 6 year period the A n for the network is 63.7 mm a−1; with a σ of ±10.0 mm a−1, a variability of ≈16%. Table 1 shows that the 6 year variability is substantially lower than those for individual years, illustrating the reduction of spatial variability by increasing the time-averaging interval (Reference Petit, Jouzel., Pourchet and Merlivat.Petit and others, 1982; Reference Mosley-Thompson, Kruss, Thompson, Pourchet and Grootes.Mosley-Thompson and others, 1985). Additionally, annual measurement of the network allows estimation of the potential frequency of zero accumulation at any site. Of the 216 individual annual measurements (36 poles × 6 years), zero or negative accumulation was recorded nine times, representing 4.1% of all observations.
It is useful to know the distribution of accumulation throughout the year. For example, well-dated ice-core records may be used to estimate the annual flux of some chemical constituents (e.g. [ ] or Cl−), or the annual average δ18O record often provides a proxy history for temperature. Such calculations require that the distribution of accumulation throughout the year be known; otherwise, it is assumed that accumulation occurs consistently throughout the year. Observations at SPS led Reference GowGow (1965) to suggest that spring is the time of greatest surface roughness and that surface lowering is a summer process. Fortunately, during three of the seven years the pentagon pole heights were measured both in November and again in February of the same accumulation year. These summer (November–February) accumulations are illustrated in Table 2 and expressed as a percentage of the annual accumulation. If mass accumulated evenly throughout the year, these values should be close to 25%; however, these data reveal that summer accumulation is very low, consistent with Gow’s observation.
Summer net accumulation for 36 poles of the 42 pole pentagon

7 mile cross
An accumulation network shaped as a cross (Fig. 1) with 7 mile (11 km) long arms was established at SPS in February 1962. The arms extended along grids 030°, 120°, 210° and 300°, were centered on the station and consisted of 35 poles along each arm with a pole spacing of approximately 300 m. This network was remeasured once (January 1970) and, based upon available records, provides an 8 year accumulation record and an opportunity to examine whether the station affects the spatial distribution of A n. The thickness of the firn layer accumulated over 8 years at each pole was converted to water equivalent (Equation (1)).
The 8 year average accumulation at each pole is shown in Figure 2. The prevailing wind direction (Fig. 1) is centered on grid 35°, closely coinciding with the 030° leg of the cross. At SPS, prevailing winds are very constant (Reference Bodhaine., Deluisi, Hams, Houmere and Bauman.Bodhaine, 1986) with 98% of the observations (1977-83) from 330° to 120°. Pole No. 1 in each leg is closest to the station, and pole No. 5 of the 210° leg coincides with the runway. Poles 1-5 of the 210° leg were eliminated from the record due to obvious disturbance.
The 8 year average net annual accumulation (mm w.e.) for each of the 40 poles along the four arms of the 7 mile cross, with the direction of the prevailing wind (35°). The lowest accumulations are found along the grid 30° arm located upwind of South Pole Station

The 8 year average accumulation is 61 ±6 mm a−1 for the leg upwind of the station (030°) and is the other three legs although the downwind leg (210°) has the highest A n (79±6 mm a−1). The other two legs (120° and 300°) are oriented more across the prevailing wind and have accumulations of 77 ± 9 and 72 ± 5 mm a−1, respectively. Inspection of the individual pole accumulations along each line (Fig. 2) reveals a number of extreme values and persistent trends (both increasing and decreasing) extending over hundreds of meters. It is conceivable that the station, sitting as a single protrusion on the flat snow surface, generates waves of snow (sastrugi) which propagate outward (primarily downwind) and dominate the An pattern for a number of years, possibly decades. Along leg 030° the greatest variability occurs within 3.3 km (poles 1–10) upwind of the station. At distances exceeding 3.3 km, A n variability decreases markedly (σ =±4 mm a−1) and only two of 25 observations exceed ±1σ. This could indicate the lack of disturbance of the A n regime by surface undulations upwind, outside the accumulation shadow generated by the station. The 7 mile cross results do not provide unequivocal evidence of significantly higher accumulation in the downwind direction (e.g. grid 210° vs 120° and 300°) but clearly demonstrate that significantly lower accumulation occurred upwind of the station. Either the lower accumulation upwind is anomalous or the effect of the station upon A n extends like a broad apron centered upon the downwind direction. The existence of lower accumulation upwind of the station is supported by the similarity between the cross and pentagon results. The 6 year average (1958–64) from the pentagon is 64±10.0 mm a−1, in good agreement with the 8 year average (1962–70) along the 030° leg of the cross (61 ± 6 mm a−1).
Ohio State 1978 accumulation network: OSU-1978
In 1978 two 5 km long accumulation lines (lines 1 and 3) were installed (personal communication from I. M. Whillans, 1993) along grid 130° (11 poles) and grid 178° (12 poles), respectively. These lines were remeasured in 1979 and 1981. In 1982/83, line 3 was lost due to burial, but line 1 was measured, reset and extended to 6 km. In December 1985 this line was measured and reset, and then it was measured annually or semi-annually until 1990. Unlike the previous stake networks, here the original length of each pole was known, allowing net accumulation (A n) to be calculated using (Reference Pettre, Pinglot, Pourchet and Reynaud.Pettre and others, 1986)

where z 2 and Z 1 represent the height of the snow surface on the stake at times t2 and t1, and D 2 and D 1 are the mean densities between the surface and depths z2 and Z 1. Mean densities were obtained from the ratio of firn depth to water-equivalent depth (Equation (1)); thus the same depth-density relationship was used for all the network data. Calculating A n from Equation (2), rather than simply converting the thickness of the newly accumulated layer to water equivalent using the mean density, results in an approximate 3% enhancement. The 12 year average A u for the OSU-1978 network is 92 ± 4 mm, higher than those from any of the other networks.
Figure 3 illustrates the 12 year (1978–90) average accumulation for each pole as a function of distance from the station and reveals clearly that accumulation decreases with increasing distance from the station. Although the lowest two accumulation averages are recorded at the two most distant poles, the accumulation line is loo short to assess whether a station effect extends beyond 6 km. It is possible that average accumulation decreases further with increasing distance, but the current network of poles does not allow this to be explored.
The 12 year average net annual accumulation (mm w.e.) for the 12 poles in the OSU-1978 accumulation line along grid 130° illustrate that accumulation decreases with increasing distance from the station

The potential effect of the station upon the accumulation distribution must be considered if a natural increase is to be confirmed. From the network data the strongest evidence of such an increase may be drawn from a comparison of the 12 year (1978–90) average (92 mm) from the OSU-1978 line (grid 130°) and the 8 year (1962–70) average (77 mm) along the grid 120° arm of the 7 mile cross. The average net annual accumulation for the period 1978–90 is 15 mm a−1 greater. Although the 7 mile cross was centered upon the original SPS (1 km from the new (1974) SPS), the relative orientations between the respective stations and accumulation lines are nearly identical. If it can be assumed that the respective station effects were identical for both lines, then these data may reflect a secular increase in A n.
Ohio State 1992 accumulation network: OSU-1992
Based upon observations discussed above, it became apparent that A n measured in the 1980s was greater than that measured from the mid-1950s to the 1970s. The history of accumulation at SPS presented here suggests that A n has increased by more than 20% in the last two decades. However, none of the older accumulation networks was preserved and the OSU-1978 line is too short (6 km) and too spatially restricted (a single line) to provide a statistically sound base line for A n at SPS. Therefore, a new accumulation network has been established which will provide a basis for the permanent, systematic monitoring of the “natural” accumulation at SPS.
In November 1992 an array of 235 poles in six lines, each 20 km long, centered on the SPS was installed for systematic, long-term monitoring A n. The network was established using standard surveying techniques which were verified using GPS (global positioning system). The lines are centered on the six grid directions (45°, 110°, 170°, 230°, 290° and 350°), extend 20 km from the station and contain poles spaced 500 ± 1 m apart. When they were installed, all pole heights (from the top of the pole to the original snow surface) were 72 in (182.88 cm) and all pole lengths were identical.
In November 1993 the height of each pole was measured and the height difference was calculated in water equivalent using Equation (2). The average A n, based upon all 235 poles is 97 mm w.e., and although this reflects but a single year’s data, this 1 year average is very spatially representative. This network will be remeasured each year in November. The initial (1 year) results do not indicate the existence of a pronounced “station effect” upon accumulation, but several more years of data will be necessary to address this quantitatively.
Beta Radioactivity Horizons
The data from all the accumulation stake networks indicate a secular increase in A n since the mid-1950s. This may be explored further by examination of beta radioactivity horizons deposited at known times within the firn. Antarctic beta profiles generally exhibit two very distinct horizons, 1955 and 1964/65 (Reference Picciotto. and Wilgain.Picciotto and Wilgain, 1963; Reference CrozazCrozaz, 1969; Reference Pourchet, Pinglot and Lorius.Pourchet and others, 1983).
Beta measurements conducted for five OSU cores and eleven CNRS (Centre National de la Recherche Scientifique) cores allow investigation of a possible secular increase in SPS accumulation. The locations of the core and pit sites from which beta radioactivity was measured are shown in Figure 1 which includes A n in mm w.e. at each site. The upper number is the accumulation from 1965 to the sampling date (1984 for CNRS sites except P14 (1978); 1982 for OSU sites 1, 2 and 3; and 1985 for OSU sites 4 and 5) while the lower number is the accumulation from 1955 to 1965.
Comparison of these data requires some caution as sampling dates and sample sizes vary and these differences result in records with somewhat different time resolutions. For example, three OSU cores (1,2 and 3) were used for other measurements as well as for beta radioactivity. Thus, the beta sampling interval encompassed approximately 300-400 mm of firn (90-140 mm a−1) or nearly 2 years’ accumulation which introduces inaccuracy in the exact assignment of a date to a specific depth. On the other hand, OSU cores 4 and 5 were used exclusively for beta radioactivity measurements, and the sampling interval is approximately 120 mm of firn (40 kg m −2 a −1) which means the beta horizon can be isolated definitively within a single year’s accumulation. Thus, the results from OSU sites 4 and 5 (Fig. 1) provide more precise accumulation information than those from sites 1, 2 and 3. For all the CNRS cores the sampling interval was greater than 1a−1, providing very good resolution.
To examine the possibility of a secular increase in accumulation independent of the station effect, the beta radioactivity results are differentiated into two groups shown in Table 3. Group 1 consists of all sites with annual resolution of the beta radioactivity horizons which are located farther than 3 km from the station regardless of orientation with respect to the prevailing wind. This distance is selected arbitrarily as it appears as a crude break point between the higher accumulation regime near the station and the less variable accumulation regime further out (Figs 2 and 3). Based upon the 11 sites included in group 1, A n appears to have increased from 73 to 81 mm, or by approximately 10%, since 1965. By assuming that sites upwind of the station are least likely to be affected by drift associated with the station, the possibility of a “natural” accumulation increase can be examined further, A second sub-set of beta radioactivity records, called group 2 sites, consists of those left from the group 1 sites after applying a further restriction, that the core location be within ±25° of the prevailing wind (35°). Results from group 2 sites (Table 2) reveal an increase from 69 to 83 mm, or a 20% increase, since 1965.
South Pole net annual accumulation averages determined from beta radioactivity profiles for two time periods: 1955-65 and 1965 to the sampling date

Summary Of South Pole Accumulation Data
Figure 4 integrates all the SPS accumulation data available from 1955 to the present. The respective standard deviations (σ) are presented, and should be considered when inspecting these data for trends. The largest σ, associated with the 1955-65 beta measurements, results primarily because the observation period is one-half that of the 1965–85 period, making it more susceptible to temporal variability. The increasing trend in accumulation appears linear with time and it is unlikely that the increase can be attributed entirely to the presence Of the station as demonstrated previously.
All the net annual accumulation averages (mm w.e. aȒ1) available from South Pole Station, plotted with respect to the time interval they represent; the cross bars indicate ± 1σ for each record. The increase in annual net accumulation since the mid-1950s is readily apparent

It is possible to make a crude estimate of the recent increase in A n at SPS using those data “least likely” to be affected by the presence of the station. Given the limited data available, the two best estimates of the current “natural” accumulation rate are (1) 86 mm a−1 which is the 12 year (1978-90) average of the two most remote poles of the OSU-1978 network, and (2) 97 mm a−1 which is the 1 year (1992/93) average for 235 poles in the OSU-1992 network. The best estimate for accumulation in the 1960s is 65 mm a −1 which is the average of the pentagon (64 mm a−1), the upwind arm of the 7 mile cross (61 mm a−1), and the Group 2 beta results (69 mm a−1). The result is an increase of 25% over the last 30 years. Using the 1978–90 2 pole average (86) gives a 32% increase while using the 1992/93 235 pole average gives a 50% increase. One year of accumulation, although spatial coverage is extensive, is much too short to be considered temporally representative; therefore, the best current estimate of the SPS accumulation increase since the mid-1950s is 32%.
Observations of Accumulation at Other East Antarctic Locations
Recent accumulation increases have been reported at other Antarctic locations. Most of these are based upon the reconstructed thicknesses of annual accumulation layers identified in firn and ice cores, which have some limitations (e.g. annual layer identification, disturbance of the surface layer and limited spatial representatively). The most extensive study was conducted in Wilkes Land (Reference Morgan., Goodwin, Etheridge and WookeyMorgan and others, 1991) where two longer (back to the early 19th century) and two shorter (back to the 1930s) A n, histories were compiled. These clearly show large variability on time-scales up to 100 years and significant changes since 1950. Here accumulation decreased sharply from 1955 to 1960, reaching a minimum in 1960, after which it increased steadily to present values, estimated to be ≈20% above the long-term mean.
Reference Peel, Bradley and JonesPeel (1992) reported a 20% accumulation increase since 1955 on Dolleman and James Ross Islands in the Antarctic Peninsula region. In addition, the Peninsula area has experienced a warming of about 0.06°C a−1 in parallel with the accumulation increase. In East Antarctica, beta radioactivity horizons identified at both Dome C and SPS by Reference Pourchet, Pinglot and Lorius.Pourchet and others (1983) also indicate a recent increase in accumulation. Based upon observations at 19 locations in the Dome C vicinity, they reported a 33% increase since the 1955–65 period, and from observations at 2 locations near the South Pole they reported a concurrent 10% increase.
In 1986 a drilling program was conducted at a remote site (82° S, 43° E) on the East Antarctic Plateau (Reference Mosley-Thompson, Paskievitch and GrossMosley-Thompson and others, 1987). The beta radioactivity records from two shallow cores, coupled with their respective density profiles, reveal a 32% increase. From 1955 to 1965 accumulation was approximately 20 mm a−1 and from 1965 to 1986 A n increased to 35 mm a−1. These estimates are subject to uncertainty due to the low accumulation rate in this region, which makes assigning the beta radioactivity horizon to a single year more difficult (discussed previously), and the fact that only two cores were analyzed.
The combined results from South Pole, Dome C, Plateau Remote and Wilkes Land suggest strongly that the central East Antarctic Plateau has experienced a secular increase in A n over the last 30 years. Limited observations indicate a similar trend in the Antarctic Peninsula region. It is more difficult to assess whether this represents a longer-term trend, as most Antarctic records begin in the 1950s, a period of possibly below-average accumulation in the Wilkes Land region. If true for the high plateau, this would tend to overemphasize the recent accumulation increase. However, viewed from the perspective of a 911 year ice-core-based A n record from SPS (Reference Mosley-Thompson and ThompsonMosley-Thompson and Thompson, 1982) the current measurements of A n (> 90 mm w.e.) represent extreme values and greatly exceed the nine-century mean of 70 mm w.e.
Discussion and Conclusions
All available data have been integrated to produce the most complete and representative net mass accumulation history for SPS. These data provide strong evidence that A a in the vicinity of SPS has increased about 30% since 1955. Although some of the increase may reflect enhanced drifting due to the presence of the station, most of the measurements upwind of the station, where the station effect is minimal, also reveal an increase. Thus, the net accumulation increase at SPS appears to be real.
The recent increase in A n at SPS is consistent with that observed at other sites in Antarctica, suggesting a larger-scale, regional change. The possibility of an accumulation increase over Antarctica is of particular interest in light of projections for global warming in the next century, the anticipated polar amplification of this warming and the future stability of the polar ice sheets (West Antarctica, in particular) and their effect upon future sea levels (Reference Houghton, Jenkins and EphraumsHoughton and others, 1990). An increase in Antarctic accumulation would offset some of the sea-level rise anticipated from thermal expansion and melting of temperate glaciers and ice caps.
A variety of general-circulation model (GCM) simulations for enhanced greenhouse gas concentrations (e.g. 2 × CO2) indicate an increase of 20–50% in net mass accumulation (precipitation minus evaporation) over Antarctica (Reference GrotchGrotch, 1988). Reference Budd., Simmonds., Weller, Wilson and SeverinBudd and Simmonds (1991) explored the combined effects of surface warming and sea-ice reduction on precipitation and evaporation over Antarctica. The cumulative effects resulted in an accumulation increase of 40-68% which may provide a modest but significant offset to rising sea level. Another model study (Reference OerlemansOerlemans, 1982) indicates that the initial response (next 100 years) to a polar warming may be increased mass accumulation in Antarctica, since the estimated increase in snow accumulation exceeds the estimated melting.
The reasons for the observed A n increase are not well understood. Although accumulation should be related to the temperature in the free atmosphere which governs the water-vapor content above the inversion layer, no simple or straightforward relationship is apparent. Other meteorological factors including atmospheric dynamics may be equally important. There is little evidence of a “strong” warming over Antarctica, except in the Peninsula region where warming is marked and strong. Several investigations of Antarctic temperature trends have produced conflicting results. Reference SansomSansom’s (1989) statistical study of four stations (Faraday in the Peninsula area, Mirny on the east coast, Amundsen–Scott (SPS) and Scott Base in the Ross Sea sector) revealed 5–10 year temperature trends which were remarkably in phase among the four stations. Three stations exhibited warming trends while Amundsen–Scott was cooling, but none of these lineal- trends was found to be statistically significant over the 30 year record. Sansom noted that long-term temperature trends may be difficult to discern from Antarctic temperature records due to the large variability in annual mean temperatures.
(Reference Raper, Wigley, Jones, Kelly, Mayes and LimbertRaper and others 1983, Reference Raper, Wigley, Mayes, Jones and Salinger1984) reported a warming trend from the early 1960s to 1975 in the Southern Hemisphere which is also present in most meteorological records from the Antarctic continent. However, most of the Antarctic stations in the study lie on or near the coast; hence, the continental interior is poorly represented. Nevertheless, the observed warming trend is most pronounced during winter when most of the precipitation falls on the East Antarctic Plateau.
The OSU-1992 accumulation network will provide an important base line for assessing future changes in A n in the vicinity of SPS. This, coupled with future core-retrieval efforts at other remote Antarctic locations and accumulation networks at other stations, will document both past and future changes in accumulation. Assessment of the relationship between atmospheric and/or oceanic warming and Antarctic accumulation requires an array of radiosonde stations and continued monitoring of the spatial and temporal variability of sea ice.
Acknowledgements
We thank the many scientists who have contributed to the measurement of snow accumulation over the years, particularly those involved in the IGY who had the foresight to establish the first stake network in 1958. We thank M. Pinglot for his contribution to the CNRS beta radioactivity measurements. I. Whillans for his data from the OSU-1978 accumulation network, J. Nagy for the illustrations and two anonymous reviewers for valuable suggestions. The majority of the measurements incorporated into this study were made under the auspices of numerous programs supported by the U.S. National Science Foundation. The new accumulation network (OSU-1992) and this 37 year synthesis were supported by NSF-DPP-9117447. This is contribution No. 913 of the Byrd Polar Research Center.



