INTRODUCTION
Myxozoans (Phylum: Myxozoa) represent an economically important group of microscopic fish-parasites. Myxobolus cerebralis, the causative agent of whirling disease, and Tetracapsuloides bryosalmonae, the cause of proliferative kidney disease, are responsible for high mortality in trout and other salmonid populations. Stimulated by the importance of diseases caused by myxozoans, our understanding of life cycles, host-parasite relationships, and developmental features (i.e. host specificity, organ/tissue preference) has greatly increased in recent years. Passively disseminated actinospores play a key role in the propagation of myxozoan parasites. During infection, a unique response of host recognition and invasion can be differentiated. The extrusion of polar filaments, followed by sporoplasm emission and penetration of the host integument are distinct behavioural patterns, which are presumably elicited by discrete stimuli (Kallert et al. Reference Kallert, El-Matbouli and Haas2005).
For several myxozoan species it has been demonstrated that the skin mucus of host fish stimulates discharge of actinospore polar filaments, followed by active emission of the sporoplasm (Yokoyama et al. Reference Yokoyama, Ogawa and Wakabayashi1993; Uspenskaya, Reference Uspenskaya1995; Xiao and Desser, Reference Xiao and Desser2000; Özer and Wootten, Reference Özer and Wootten2002). However, until recently, Myxobolus cerebralis could not be stimulated either by fish mucus or by chemicals known to discharge polar capsules (El-Matbouli et al. Reference El-Matbouli, Hoffmann, Schoel, McDowel and Hedrick1999; Wagner, Reference Wagner2001a, Reference Wagnerb; Cannon and Wagner, Reference Cannon and Wagner2003). Kallert et al. (Reference Kallert, El-Matbouli and Haas2005) showed that sequential chemical and mechanical stimulation were required to discharge the polar capsules of M. cerebralis actinospores.
Yokoyama et al. (Reference Yokoyama, Kim and Urawa2006) detected a notable difference between the host-selection mechanism of Myxobolus arcticus and Thelohanellus hovorkai. M. arcticus responded quickly and with low host specificity to fish mucus, whereas T. hovorkai was found to be highly host specific in a prolonged reaction. Kallert et al. (Reference Kallert, Ponader, Eszterbauer, El-Matbouli and Haas2007) found that triactinomyxons (TAMs) of M. cerebralis and Henneguya nuesslini, like M. arcticus, belong to a group of rapidly responding actinospores.
Until recently, little had been known about the genome of myxozoans. No information is available about genome size and chromosome topology. Principally ribosomal RNA genes (small subunit, large subunit and internal transcribed spacers) from a couple of hundred myxozoans (Kent et al. Reference Kent, Andree, Bartholomew, El-Matbouli, Desser, Delvin, Feist, Hedrick, Hoffmann, Khattra, Hallett, Lester, Longshaw, Palenzuela, Siddall and Xiao2001; Eszterbauer, Reference Eszterbauer2004; Hallett et al. Reference Hallett, Atkinson, Erseus and El-Matbouli2004; Whipps et al. Reference Whipps, El-Matbouli, Hedrick, Blazer and Kent2004; Fiala, Reference Fiala2006; Molnár et al. Reference Molnár, Marton, Eszterbauer and Székely2006; Holzer et al. Reference Holzer, Wootten and Sommerville2007etc.) and beta-actin genes of 10 species (Kelley et al. Reference Kelley, Beauchamp and Hedrick2004a) have been investigated. The DNA sequence of a chymotrypsin-like serine protease, a cathepsin Z-like cysteine protease gene (Kelley et al. Reference Kelley, Adkison, Leutenegger and Hedrick2003, Reference Kelley, Beauchamp and Hedrick2004b), a subtilisin-like serine protease gene (Dörfler and El-Matbouli, Reference Dörfler and El-Matbouli2007) and several protein-coding DNA sequences of Buddenbrockia plumatellae (Jiménez-Guri et al. Reference Jiménez-Guri, Philippe, Okamura and Holland2007) have been recently determined. Further genetic research would aid our understanding of the invasion mechanisms of myxozoans through investigation of regulation of genes active in infective developmental stages. Such studies would form a basis for further functional genomic analysis and the development of preventive methods which would be a major step forward to control myxozoan diseases in aquaculture.
In the present study, an in vitro activation assay was developed, by which host invasion reactions and an up-regulation of associated genes may be elicited in a high number of actinospores simultaneously, resulting in the preparation of RNA samples from activated TAMs. In order to identify parasite genes, which are involved in the host invasion mechanism of M. cerebralis, we compared the transcriptomes of non-activated, naturally shed TAMs of M. cerebralis and the in vitro activated TAMs prepared for host invasion, using suppressive subtractive hybridization (SSH). M. cerebralis genes expressed differentially during activation were listed. Furthermore, we investigated the relative expression profile of the selected transcripts at different time-points in tissue of experimentally infected rainbow trout (Oncorhynchus mykiss) by quantitative real-time PCR.
MATERIALS AND METHODS
In vitro TAM activation assay and sample collection
TAMs of M. cerebralis were obtained from laboratory cultures at the Clinic of Fish and Reptiles in Munich, Germany. Waterborne TAMs were collected by filtering water from the infected oligochaete containers through 20 μm nylon mesh. Less than 2-day-old TAMs were used for the activation trials. The actinospore concentration varied between 10 000 and 75 000 TAMs/ml and 400 μl of spore suspension was pipetted into each well of 24-well cell culture plates.
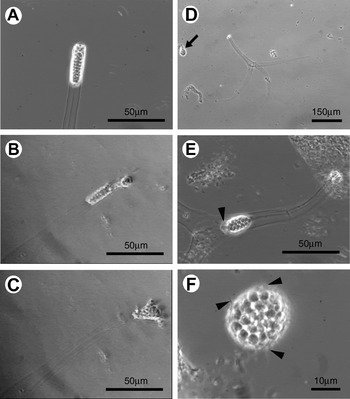
Fish mucus homogenate was prepared from adult rainbow trout (Oncorhynchus mykiss) as described by Kallert et al. (Reference Kallert, El-Matbouli and Haas2005). The concentration of the fish mucus was calculated based on its dry weight after complete lyophilization of 200 μl aliquots. An homogenate of 0·7 mg/ml final concentration was added to the TAMs and a mechanical stimulus was applied by vortexing the plate 3 times for 2 s with a Vortex-Genie K-550-GE (Scientific Industries Inc., UK) at full speed. The activation efficiency was checked 15 min post-stimulation and 20 μl aliquots of spore suspension were pipetted from each well onto microscope slides, and activated and non-activated TAMs were counted under an inverted phase contrast microscope (Zeiss Axiovert 25, Carl Zeiss MicroImaging GmbH, Germany). A TAM was considered activated if its sporoplasm was either released from the valve or had actively moved along the spore axis while a pseudopodium-like protrusion of the sporoplasm was observable. They were judged non-activated if the sporoplasm with the secondary germ cells remained at the apex of the TAM without showing any movement (Fig. 1A). Control trials were conducted in 24-well plates without mucus addition, but applying mechanical stimulation. To confirm that TAM activation actually takes place in the cell well plate and not on the slide used for the microscopic evaluation, a control including mucus was applied: fish mucus was added to 20 μl aliquots of spore suspension on slides without vortexing. For the mucus control, the sporoplasm movement was scored from stimulation up to 3 min. Activation efficiency data were statistically analysed using SPSS for Windows. Percentage data were arcsine-transformed for analysis to obtain approximately normally distributed values. Homogeneity was controlled using Levene's test procedure. Differences between means were tested for statistical significance by Tukey HSD multiple t-test after 1-way ANOVA.
(A) The spore body of a waterborne, non-activated Myxobolus cerebralis TAM. (B and C) The amoeboid germ cells covered by the primary sporoplasm cells are leaving the spore valve in the first few min after stimulation. (D) Activated TAM after release of sporoplasm. The arrow indicates the emerged sporoplasm. (E) Activated TAM with the sporoplasm actively moving inside the style. During the active movement, a pseudopodium-like protrusion of the sporoplasm appears (arrowhead). (F) The emerged sporoplasm forms a ball 15–20 min after stimulation. Arrowheads show small spikes of a viscous substance covering the amoeboid ball.

For further molecular genetic work, activated and non-activated TAM groups of a replicate were collected on the same day from the same TAM stock. Approximately 800 000 TAMs per SSH sample (i.e. activated and non-activated TAMs) were collected 30 min post-stimulation, fixed in RNAlater (Sigma, Germany) and stored at −20°C.
Suppressive subtractive hybridization and differential screening
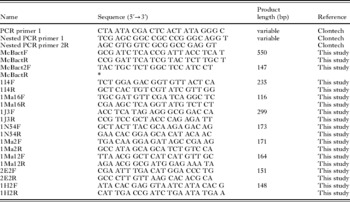
Total RNA was isolated from the TAM samples using the RNeasy Mini Kit (Qiagen, Germany) according to the protocol provided by the manufacturer. The total RNA from each sample was treated with DNase, dissolved in sterile RNase-free water and quantified spectrophotometrically. A BD SMART PCR cDNA Synthesis Kit (Clontech-Takara Bio Europe, France) was used to generate ds cDNA following the manufacturer's manual. As the procedure did not give sufficient amounts of ds cDNA, the second strand synthesis was repeated several times, and the suggested PCR also required optimization in order to determine the optimal number of PCR cycles. A species-specific PCR assay was developed and optimized for the beta-actin mRNA of M. cerebralis (Table 1). The PCR was used to monitor the cDNA products after cDNA synthesis and at every step of the SSH (i.e. RsaI digestion, adaptor ligation, cDNA purification, hybridizations, suppression PCR etc.) in order to estimate the relative amount of cDNA products, besides spectrophotometry. The total volume of each PCR was 20 μl, which contained approx. 0·5 μl DNA or 1 μl of cDNA, 1× of ReddyMix (ABgene, UK), 1·25 μm of each primer (McBactF and McBactR) and ddH2O. Amplification conditions were: 95°C for 30 s, 56°C for 30 s and 72°C for 60 s for 35 cycles, with denaturation at 95°C for 5 min and terminal extension at 72°C for 5 min.
Oligonucleotides used for SSH and qPCR

* The same sequence as that of the other McBactR above.
In the course of SSH, the cDNA pools of non-activated and activated TAMs were hybridized in 2 steps. Transcripts common in both populations were eliminated and differentially expressed transcripts were enriched by suppression PCR (Diatchenko et al. Reference Diatchenko, Lau, Campbell, Chenchik, Moqadam, Huang, Lukyanov, Lukyanov, Gurskaya, Sverdlov and Siebert1996). A PCR-Select cDNA Subtraction Kit (Clontech-Takara Bio Europe, France) was used for SSH. The forward, reverse and control hybridizations were performed as the manufacturer suggested. The ds cDNA was not purified prior to RsaI digestion. Ligation and hybridization were performed following the manufacturer's protocols, and their efficiencies were monitored using the M. cerebralis beta-actin PCR assay described above. The differentially expressed transcripts produced by SSH were cloned into E. coli JM109 hosts using the pGEM-T Easy Vector System II (Promega, Germany) following the manufacturer's manual. Plasmids were purified with a FastPlasmid Mini Kit (Eppendorf, Germany) used as per the manufacturer's instructions.
To validate and explore patterns of gene expression, differential expression screening was performed with an adaptor-specific PCR using nested PCR primers 1 and 2R, non-radioactive DNA:DNA dot blot with DIG-labelled cDNA probes, and DNA sequencing of the clones of candidate transcripts followed by quantitative real-time PCR (qPCR). The adaptor-specific PCR (Table 1), which gave a positive result only if the examined SSH library clone contained an insert from the original, adaptor-ligated cDNA pool, was carried out on 96-well PCR plates in 50 μl of total volume, and consisted of 1 μl of DNA of individual clones of the SSH library, 1×Taq buffer with KCl (MBI Fermentas, Lithuania), 1·5 mm MgCl2, 0·2 mm dNTP, 0·2 μm of each primer (Nested PCR primer 1 and 2R), 2 units Taq DNA polymerase (MBI Fermentas, Lithuania) and ddH2O. After 1 min denaturation at 95°C, 25 cycles were performed at 95°C for 30 s and 68°C for 3 min without extra elongation steps.
For the DNA:DNA dot blot, the High Prime DNA Labelling and Detection Starter Kit was used (Roche Applied Science, Germany). The cDNA population of subtracted forward, subtracted reverse, unsubtracted tester and unsubtracted driver were labelled with digoxigenin (DIG), and used as probes for the dot blot hybridization. Analysis of the DIG-labelling efficiency was performed as per the manufacturer's instructions. For template DNA, 1 μl of PCR product of the SSH library clones amplified by the adaptor-specific PCR, was dotted onto a positively charged nylon membrane (Roche Applied Science, Germany). Membranes were hybridized overnight at 42°C with each of the constructed probes. The hybridization and the subsequent detection using anti-DIG-alkaline-phosphatase conjugate (Fab fragments) and BCIP/NBT substrate (Roche Applied Science, Germany) followed the manufacturer's manual.
Putative differentially expressed transcripts were sequenced in both directions using the sequencing primers pUC/M13 forward and reverse (Promega, Germany) at GATC Biotech AG, Konstanz, Germany. For sequence assembling, the STADEN Sequence Analysis Package version 2001.0 (Staden, Reference Staden1996) was used. BLAST searches (blastn, blastx, blastp, tblastx, blastn on EST database) were carried out to identify the expressed sequence tags (ESTs).
Experimental exposure of fish and tissue collection
Laboratory-reared rainbow trout fry (Troutlodge strain, 3 months) were exposed to 3500 TAMs per fish in 2 L of 10°C water without aeration for 30 min, and further 30 min with aeration, then held in 50 L aerated aquaria with slow water flow-through at 15°C. Non-infected fish were maintained under the same conditions and served as controls. Six fish from both the TAM-exposed and non-exposed groups were removed and euthanized at each sampling time-point (1 h, 8 h and 24 h post-infection (p. i.)). The whole skin was removed, frozen in liquid nitrogen and stored at −80°C.
Quantitative real-time PCR (qPCR)
From the infected fish tissue, DNA-free total RNA was extracted using the RNeasy Mini Kit (Qiagen) according to the manufacturer's instructions. For the cDNA synthesis, the iScript cDNA Synthesis Kit (Bio-Rad Laboratories, USA) was applied as per the user's manual. The transcription level of the selected transcripts ‘1I4’, ‘1J3’, ‘1Ma16’ and ‘1N54’ was determined in 9 replicates of the non-activated and the in vitro-activated TAM samples respectively, and 6 replicates of the infected fish tissue per sampling time-point. For transcripts ‘1Ma2’, ‘1Ma12’ and ‘2E2’, 3 replicates of non-activated and activated TAM samples and 6 replicates of infected fish tissue per time-point were used.
PCR primers specific for the selected genes were designed (Table 1), and the PCR assays were optimized using gradient PCRs to determine the optimal annealing temperature and primer concentration. The specificity of the PCR assays was also tested on non-infected fish tissue and fish mucus samples prior to performing qPCR. A BioRad MyIQ Single Color Real-Time PCR Detection System (Bio-Rad Laboratories, USA) was applied using iQ SYBR Green Supermix (Bio-Rad Laboratories, USA). The efficiency of the target gene detection was tested in triplicates on 10-fold dilution series of the PCR products of the SSH clone inserts. To minimize variability in RNA quantitation and integrity, samples run by qPCR were normalized to the beta-actin cDNA of M. cerebralis. A qPCR reaction in a final volume of 25 μl contained 1 μl of cDNA, 1 μm of each primer (Table 1), 1× SYBR Green Supermix and ddH2O. After 3 min of DNA denaturation at 95°C, 40 cycles were performed at 95°C for 30 s, 56°C for 30 s and 72°C for 30 s. An annealing temperature of 60°C was used for the detection of beta-actin (primer pair McBact2F-R) and transcripts ‘1J3’, ‘2E2’, while 58°C was used for ‘1Ma12’. A melting-point curve followed the cycling, starting from 55°C and increasing by 0·5°C every 30 s up to 95°C, was used to detect any non-specific PCR products. The relative expression ratio of a target gene was calculated based on the qPCR efficiency and the crossing-point (CP) deviation of the target sample versus the internal control, according to Pfaffl (Reference Pfaffl2001). CP is defined as the point at which the fluorescence rises above the background signal.
For transcripts ‘1I4’, ‘1Ma16’ and ‘1N54’, differences between means of relative expression values were tested for statistical significance by Tukey HSD multiple t-test after 1-way ANOVA. For transcript ‘1J3’, Mann-Whitney U-test was used as variances were not homogenous between the compared groups, while for transcripts ‘1Ma2’, ‘1Ma12’ and ‘2E2’, the Kruskal-Wallis test followed by Dunn's multiple comparison procedure was applied using GraphPad Prism v5.0 software.
Isolation and sequencing of full length cDNA
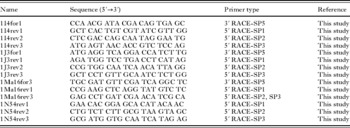
Roche 5′/3′ RACE Kit, 2nd Generation (Roche Applied Science, Germany) was used to obtain the 5′ and/or 3′ end of differentially expressed genes from ESTs. Procedure strictly followed the manufacturer's manual. For the nested PCR (ds cDNA synthesis in 2 rounds), BD Advantage 2 PCR Kit (BD Biosciences – Clontech, USA), was used. Cycling conditions were 1 min at 94°C, 25 cycles of 30 s at 94°C and 3 min at 68°C, followed by an elongation step of 3 min at 68°C. For transcript ‘1I4’, ‘1J3’ and ‘1Ma16’, both 5′ and 3′ RACE were performed, while for transcript ‘1N54’, the rapid amplification of 5′ cDNA end was done alone. Gene-specific primers designed based on the ESTs are listed in Table 2.
Oligonucleotides used for the rapid amplification of 5′ or 3′ cDNA end (RACE) of selected transcripts ‘1I4’, ‘1J3’, ‘1Ma16’ and ‘1N54’
(SP: gene-specific primer (see Roche 5′/3′ RACE Kit 2nd Generation manual).)

The 5′ and 3′ RACE PCR products were cloned using pGEM-T Easy Vector System II (Promega, Germany) as per manual. At least 4 positive clones per sample were sequenced with universal sequencing primers pUC/M13 forward and reverse using the ABI BigDye Terminator v3.1 Cycle Sequencing Kit with an ABI 3100 Genetic Analyzer automated DNA sequencer (Applied Biosystems). STADEN Sequence Analysis Package v. 2001.0 (Staden, Reference Staden1996) was used for sequence assembling.
RESULTS
In vitro TAM activation
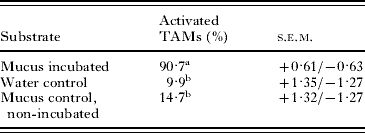
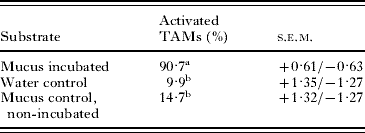
Significant differences in activation rates were detected between the mucus-incubated and control samples (Table 3). In the course of the observed TAM activation process, sporoplasms left the spore valve at the apex of actinospore (Fig. 1B–D). After leaving the spore valve, the sporoplasm actively continued to search for an entry site for host penetration. During the characteristic amoeba-like motion, the sporoplasms showed moving, pseudopodium-like protrusions and, approximately 15 min after stimulation, they usually stopped moving and formed a ball (Fig. 1F). In some cases, the stimulated sporoplasm was not able to emerge from the spore valve and either turned back at the valve-opening site (below the polar capsules) or moved towards the base of the spore style (Fig. 1E). The failure of the valve cells to open at the apex of the actinospore is most likely a result of the lack of attachment to a target surface in the presence of water current in our experimental set-up.
Mean sporoplasm emission rate of Myxobolus cerebralis TAMs
(Mucus incubations (with mucus and vortexing) and water controls (no mucus added) were performed using 24-well plates. Mucus controls (added mucus, no vortexing) were conducted on microscope slides. Different letters (a and b) indicate a significant difference (P<0·001, Tukey HSD). Total number of TAMs counted per substrate in 400 μl volume each: 779–1015 (10 replicates). s.e.m.=standard error of the mean.)
Identification of ESTs from the SSH library
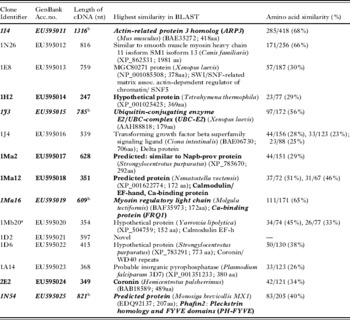
In total, 190 clones from the forward SSH library were chosen for the differential screening procedure. As a result of the DNA:DNA dot blot, 45 clones were selected for DNA-sequencing analysis. In addition, 5 screened clones from the forward and 6 clones from the reverse SSH library were processed for sequencing. BLAST search showed that from the 45 selected SSH clones, 15 clones (33%) were similar to genes with functions like cell maintenance, signal transduction, motility or muscle-related protein coding genes, which were judged as candidate transcripts. Thirteen clones (28%) had a high similarity to the beta-actin gene of M. cerebralis, while 8 clones (18%) were identical with the 18S or 28S rRNA of M. cerebralis. Nine further library clones (20%) were related to a 82 kDa heat-shock protein or fish and protozoan rRNA. The 11 clones sequenced additionally were identified as fish or parasite rRNAs, and beta-actin genes, except for clone ‘2E2’ that was similar to a coronin-like protein and was therefore used for further screening. DNA sequencing identified 15 candidate transcripts, from which 8 transcripts were then examined using qPCR (Table 4). The remaining 7 clones were either replicates of an already selected transcript or represented highly conserved sequences that did not allow the design of specific qPCR assays to obtain their relative expression profiles. Therefore, they were excluded from the subsequent screening.
cDNA sequences of the transcripts revealed from the suppressive subtractive hybridization (SSH) library
(Clones screened by quantitative real-time PCR are highlighted in bold, while genes found to be involved in the host invasion are shown in bold-italics.)

a 92·6% similar to 1Ma12.
b Full-length cDNA sequence.
BLASTn search on EST database of GenBank detected 2 similarity matches, transcript ‘1N26’ was 79% similar (123/155nt) to Hydra magnipapillata (DT620252) (Ph: Cnidaria), while 75% nucleotide similarity (290/382nt) was found between transcript ‘1I4’ and Hydractinia sp. (CN806785) (Ph: Cnidaria). No similarity was found with the EST sequences of Buddenbrockia plumatellae cDNA library.
Comparisons of relative expression levels of the examined transcripts
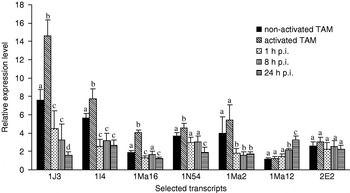
qPCR determined the relative expression profile of the selected transcripts, in comparison to beta-actin from M. cerebralis TAMs (Fig. 2). The relative expression levels of the clone ‘1H2’ (unknown sequence) showed high variability. Among the expression values of ‘1H2’ transcript detected in the replicates of infected fish samples, as much as a 60-fold difference could be measured, thus the ambiguous result could not be evaluated. The transcript ‘2E2’ (similar to coronin) was expressed consistently, while for the ‘1Ma12’ (predicted Ca2+-binding protein) a significant increase (P<0·05) was recognizable in its expression at 8 and 24 h p.i.. ‘1Ma2’ (similar to Napb-prov protein) was up-regulated in non-activated and activated TAMs, followed by a significant decrease (P<0·05) in expression level in infected fish tissue after 1 h p.i.
The relative expression levels±s.d. of 7 selected Myxobolus cerebralis transcripts revealed from the SSH library, at different time-points of the host infection: waterborne, non-activated M. cerebralis TAMs; in vitro activated TAMs; rainbow trout fry samples infected in vivo with M. cerebralis TAMs and collected at 3 different time-points: 1 h post-infection, 8 h p.i. and 24 h p.i. The relative expression ratio of a target gene was calculated based on the qPCR efficiency and the crossing point deviation of the target sample versus the internal control, according to Pfaffl (Reference Pfaffl2001). Different letters (a, b, c, d) indicate a significant difference between expression levels within a particular transcript (P<0·05).

Four transcripts (‘1I4’, ‘1Ma16’, ‘1J3’ and ‘1N54’) were up-regulated in the activated TAM group compared to the non-activated ones, and significant difference in expression values was detected for all 4 transcripts (P<0·01). Their relative expression levels were highest in activated TAMs, while relatively low in non-activated TAMs and in the infected fish samples (Fig. 2).
Characterization of selected transcripts
Transcript ‘1I4’ was similar to the actin-related protein 3 homologue (ARP3). Its full-length cDNA (1316 nt, GenBank Acc. no. EU595011) contained a single open reading frame (ORF) encoding a protein of 413 amino acids (aa). The entire cDNA of transcript ‘1J3’ (785 nt, GenBank Acc. no. EU595015) containing a 181 aa long ORF, was found to be the most similar to the ubiquitin-conjugating enzyme E2 of the UBC complex. The 609 nt long complete cDNA of transcript ‘1Ma16’ (G.B. Acc. no. EU595019) encoding 175 aa, showed the highest similarity to the Ca2+-binding protein FRQ1 of the EF-hand superfamily. Transcript ‘1N54’ (821 nt, G.B. Acc. no. EU595025) codes for a 254 aa long predicted protein, which contains pleckstrin homology (PH) and FYVE domains.
DISCUSSION
Different aspects of the process of host recognition and invasion of M. cerebralis TAMs have been studied under experimental conditions (Kallert et al. Reference Kallert, El-Matbouli and Haas2005, Reference Kallert, Ponader, Eszterbauer, El-Matbouli and Haas2007; Kallert and El-Matbouli, Reference Kallert and El-Matbouli2008). However, the events that occur at the genetic level during this process have not been investigated. To gain insight into the gene-regulation processes of TAM activation, the transcriptomes of waterborne TAMs and that of TAMs attempting host invasion were compared using suppressive subtractive hybridization. To model host recognition and TAMs invasion under in vitro conditions, a protocol was designed to activate TAMs from their quiescent condition using natural and host-derived stimuli. The polar filament discharge reaction was not included in the evaluation, although the majority of polar filaments were extruded when TAMs were stimulated. We focused on processes after host attachment rather than attachment itself i.e. polar filaments discharge, which putatively does not require genetic up-regulation and is possibly independent from sporoplasm release (Kallert et al. Reference Kallert, Ponader, Eszterbauer, El-Matbouli and Haas2007 personal observation). Whether a spore was activated could not be determined from the discharge reaction, as even discharging specimens may remain fully quiescent. Our experimental observations supported by the statistical analysis and the molecular findings, demonstrate a useful technique for activating actinospores without contamination by host tissue, except mucus homogenate. While in vitro culturing of myxozoans is not possible, such techniques are effective means of supporting functional genomic studies on myxozoans.
By SSH, we detected 452 clones of which 15 showed different expression levels between non-activated and activated TAM populations. None of the transcripts has been previously identified from M. cerebralis. However, the differential screening also revealed a relatively high background of false positive clones in both trials which suggested that both transcriptomes were rather similar, and that only low numbers of genes are expressed differently at this early stage of infection. Furthermore, the use of total RNA instead of mRNA for SSH increased the background, as each SSH sample contained a high amount of structural RNAs (i.e. rRNAs). Unfortunately, even extraction of M. cerebralis mRNA from about 1 million TAMs gave insufficient amount of mRNA for the subsequent SSH (data not shown), thus the use of total RNA could not be avoided.
Vandesompele et al. (Reference Vandesompele, De Preter, Pattyn, Poppe, Van Roy, De Paepe and Speleman2002) reported that beta-actin as a single internal control is not sufficient for adequate normalization of qPCR data. They also determined the possible errors related to the use of only one housekeeping gene for normalization, as the expression levels of most of these are variable between different tissues. For M. cerebralis, ribosomal RNA and beta-actin are the only possible internal control genes known. In our study, beta-actin mRNA was chosen for the normalization of qPCR values, as the use of 18S rRNA as internal control led to highly increased variability among the relative expression values of replicates (data not shown), most likely because of the high imbalance between rRNA and mRNA fractions.
Using histology and TEM, El-Matbouli et al. (Reference El-Matbouli, Hoffmann and Mandok1995) investigated the route of M. cerebralis TAMs in rainbow trout. They showed that the infectious sporoplasm aggregates penetrate through skin, fins, gills and the buccal cavity of fish. During the first hour following penetration, sporoplasms migrate between the epidermal cells. Approximately 1–2 h p.i., the sporoplasm aggregates disintegrate while forming smaller cell clusters, which are able to enter host cells and multiply intracellularly. Intraepithelial developmental stages are released by rupture of the plasmalemma of the epithelial cell approximately 8 h p.i., and are released into the intercellular space. Single cell-doublets containing a primary (mother) and a secondary (daughter) cell migrate deeper into the subcutis approximately 24 h p.i., then through the peripheral nerves and the central nervous system. After about 21 days, the parasites reach the head cartilages, where the formation of plasmodia takes place.
One hour p.i. is probably the time-point when the primary sporoplasm cells loose their function and disintegrate. We found that the relative expression levels, or more precisely, the relative abundance of the selected transcripts declined remarkably at this time-point. While there is no evidence that the expression/abundance of a given gene differs in diverse cell types of TAM at a certain stage of development, we cannot exclude that the primary sporoplasm cells were responsible for the high expression values of the selected genes. Hence disintegration of primary sporoplasm cells would explain the decreased relative abundance of mRNA at 1 h p.i. In the remaining secondary germ cells, mRNA abundances were lower, although 1·5–4 times as high as that of the internal control. This theory is also supported by the observation that during the first 24 h p.i., intracellular multiplication of the secondary germ cells takes place, probably resulting in an increase in the activity of germ cells (i.e increased metabolism). Hence, a higher abundance of the selected genes would also be expected, as shown for the transcript ‘1Ma12’. Its expression showed a continuous increase during the development in fish, and it was probably more derived from the secondary germ cells than from the primary sporoplasm cells.
A BLAST search of the ESTs did not detect any identity with known nucleotide or protein sequences. As only a few genes have been identified in myxozoans, it is no surprise that the transcripts revealed by SSH resulted in new entries to the database. Similarities detected by BLAST varied between 23 and 68% at the amino acid level. No similarities were detected between the examined transcripts and the cDNA library of Buddenbrockia plumatellae containing 765 EST sequences.
For the 4 transcripts out of 8 chosen for qPCR, expression levels decreased notably 1 h p.i. and remained low with some fluctuations. The transcript ‘1I4’ was found to be most similar to the actin related protein 3 homologue (ARP3), and the conserved domain of actin was also detected in the full-length cDNA sequence (1316 nt). ARP3 is a member of the ARP2/3 complex that plays a major role in the regulation of the actin cytoskeleton elements, and is important for processes like cell locomotion or the intracellular motility of lipid vesicles (Suetsugu et al. Reference Suetsugu, Miki and Takenawa2002; Marchler-Bauer et al. Reference Marchler-Bauer, Anderson, Derbyshire, DeWeese-Scott, Gonzales, Gwadz, Hao, He, Hurwitz, Jackson, Ke, Krylov, Lanczycki, Liebert, Liu, Lu, Lu, Marchler, Mullokandov, Song, Thanki, Yamashita, Yin, Zhang and Bryant2007). On the basis of the qPCR data, our findings suggest that the transcript ‘1I4’ may take part in the regulation of the sporoplasm's movement during the period of site-detection and host penetration. Future study might test the hypothesis by measuring the expression of transcript ‘1I4’ at a later stage of infection when parasites migrate within the nervous system to the brain.
In the 609 nt long transcript ‘1Ma16’, the conserved domain of frequenin (FRQ1) was detected. This Ca2+-binding protein belongs to the EF-hand superfamily and possesses general function in signal transduction, cell division and cytoskeleton functions (Marchler-Bauer et al. Reference Marchler-Bauer, Anderson, Derbyshire, DeWeese-Scott, Gonzales, Gwadz, Hao, He, Hurwitz, Jackson, Ke, Krylov, Lanczycki, Liebert, Liu, Lu, Lu, Marchler, Mullokandov, Song, Thanki, Yamashita, Yin, Zhang and Bryant2007). qPCR results showed that after down-regulation of the transcript prior to activation, its expression increases considerably during host penetration. Although its expression level decreased at 1 h p.i., it remained up to twice as high as that of the non-activated specimens.
The catalytic domain of the UBC complex (UBCc) was identified in the 785 nt long transcript ‘1J3’. This domain refers to the ubiquitin-conjugating enzyme E2 (UBC-E2) that transfers ubiquitin molecules during the process of ubiquitination. While the main function of ubiquitin is the labelling of proteins for degradation in proteosomes, it also controls the function, stability and intracellular localization of several proteins (Marchler-Bauer et al. Reference Marchler-Bauer, Anderson, Derbyshire, DeWeese-Scott, Gonzales, Gwadz, Hao, He, Hurwitz, Jackson, Ke, Krylov, Lanczycki, Liebert, Liu, Lu, Lu, Marchler, Mullokandov, Song, Thanki, Yamashita, Yin, Zhang and Bryant2007). The possible function of UBCc in the actinospore-derived cells is unknown. Its expression profile shows that the enzyme complex had increased activity both in non-activated and activated TAMs. The rapid response of M. cerebralis TAMs to stimulation by a host suggests that a variety of proteins involved in the activation process are already synthesized, and UBCc is probably one of these protein-complexes.
The full-length cDNA of ‘1N54’ (821 nt) contained 2 conserved domains. One was a pleckstrin homology (PH) domain, a protein region that is able to bind phosphatidylinositol (PtdIns) lipids or proteins. The other recognized region was FYVE, which binds PtdIns 3-P and also Zn2+. We are unable to define their protein products with any certainty as PH domains are found in a variety of cellular signalling proteins (kinases, endocytotic GTPases, cytoskeletal associated molecules, lipid associated enzymes etc.), similarly to the FYVE domain that has been observed in some 60 proteins (Marchler-Bauer et al. Reference Marchler-Bauer, Anderson, Derbyshire, DeWeese-Scott, Gonzales, Gwadz, Hao, He, Hurwitz, Jackson, Ke, Krylov, Lanczycki, Liebert, Liu, Lu, Lu, Marchler, Mullokandov, Song, Thanki, Yamashita, Yin, Zhang and Bryant2007). The functions of the two domains imply that the predicted parasite protein plays a role in enabling the interaction among the components of the signal transduction pathways, but further characterization of the protein is required.
Previous studies report that serine and cathepsin Z-like proteases of M. cerebralis are up-regulated in the gills of fish during the first couple of hours p.i. (Kelley et al. Reference Kelley, Adkison, Leutenegger and Hedrick2003, Reference Kelley, Beauchamp and Hedrick2004b). These findings also imply that proteases are required for the penetration of sporoplasm cells and for the subsequent intercellular migration in the skin of fish. Our study did not reveal any proteases using SSH. When we consider that M. cerebralis TAMs respond very quickly to stimulation (Kallert et al. Reference Kallert, Ponader, Eszterbauer, El-Matbouli and Haas2007), protease genes are probably transcribed to mRNA in TAMs before the process of host invasion is initiated, thereby no significant difference is expected in their expression levels in activated and non-activated TAMs.
The newly described genes may serve as new targets of phylogenetic studies on myxozoans. Phylogenetic studies concerning this parasite phylum suggested that myxozoans are closely related to Cnidaria (Siddall et al. Reference Siddall, Martin, Bridge, Desser and Cone1995; Zrzavy and Hypsa, Reference Zrzavy and Hypsa2003; Jiménez-Guri et al. Reference Jiménez-Guri, Philippe, Okamura and Holland2007), while others indicated their relationship to nematodes (Smothers et al. Reference Smothers, von Dohlen, Smith and Spall1994). The former interpretation is supported by the transcript ‘1Ma12’ which was the most similar to the Ca2+-binding protein (calmodulin) of Nematostella vectensis, an anthozoan Cnidaria. Furthermore, similarities to proteins originating from vertebrates (‘1I4’, ‘1N26’, ‘1E8’, ‘1J3’), from yeast (‘1Mb20’) and from different protozoans (‘1H2’, ‘1A14’, ‘1N54’) were detected. It is noteworthy that 3 of the transcripts were most similar to proteins of the phylum Echinodermata (‘1Ma2’, ‘1D6’, ‘2E2’) and 2 of them to Tunicata (‘1J4’, ‘1M16’). Both taxa belong to the superphylum Deuterostomia (similarly to Vertebrata), and the latter is considered as the closest relative to vertebrates. In the search for novel phylogenetic markers other than the well-studied ribosomal RNA genes, it has been suggested that a functional gene in combination with ribosomal genes, might enable a more reliable phylogenetic reconstruction of the Myxozoa (Eszterbauer et al. Reference Eszterbauer, Marton, Rácz, Letenyei and Molnár2006; Fiala, Reference Fiala2006).
In conclusion, the technique of SSH was proven to be a sensitive method to provide insight into the genetic basis of TAM activation, shedding some light on the host invasion process that is a crucial step in the life cycle of M. cerebralis. Our study revealed that 4 transcripts (‘1I4’, ‘1Ma16’, ‘1J3’ and ‘1N54’) are up-regulated in in vitro activated TAMs compared to their expression levels in a non-activated group and in infected fish tissue. These findings suggest that the selected genes are involved in the host invasion of the TAM of M. cerebralis, and, besides the characterization of the selected genes, further study is required to investigate their function in the complicated process of host recognition and invasion.
This study was supported by the Alexander von Humboldt Foundation, Germany.