1. Introduction
On the evening of 2 April 2013, a major flood struck the City of La Plata, Argentina, killing 89 people and displacing thousands of others. That event, the most important flood in the city's last hundred years, prompted city officials to consider the construction of new hydraulic infrastructure and to develop contingency plans. Although such investments are necessary, little is known about the benefit that people place on them. In this paper we intend to shed some light on this issue by estimating the willingness to pay to avoid the risk of experiencing a flooding event.
The occurrence of flooding disasters causes significant costs worldwide, not only in terms of material losses and the disruption of economic activity, but also in terms of human lives. The latest available data indicate that floods caused US$ 21bn in losses during the first half of 2013, largely dominating the economic costs from natural catastrophes (Wake, Reference Wake2013). Most of the economic costs during that period were derived from inland flooding in Europe, Canada, Asia and Australia. While economic losses are typically greater in developed countries, most of the deaths due to flooding occur in the developing world.Footnote 1
Recently, flooding events have been gaining more public attention, partly due to improved broadcasting communications, but also because extreme weather events have become more frequent. According to the UN Intergovernmental Panel on Climate Change (IPCC), flooding and storm surges are among the greatest threats to humans in the future, resulting from global warming (IPCC, Reference Field, Barros and Dokken2014).Footnote 2 Consequently, economic losses are predicted to rise due to urban flooding in the forthcoming decades (Hallegatte et al., Reference Hallegatte, Green, Nicholls and Corfee-Morlot2013). Rapid urbanization in developing countries, such as Argentina, presents another challenge when trying to mitigate the risks from flooding, as one of the consequences of continued urbanization is the tendency for people to settle on floodplains, thereby increasing the exposure to risk in the areas around urban streams.
In this context, identifying the willingness to pay to avoid flood hazards is essential for the cost-benefit analysis of investments in infrastructure aimed at ameliorating these negative impacts, or to promote adaptation policies. To the best of our knowledge, there has been no prior attempt to estimate the willingness to pay to reduce the risk of flooding in Argentina or elsewhere in Latin America.
The City of La Plata has some appealing characteristics for the purpose of this study. First, even though the city is very close to the La Plata River, approximately 10 km from the river's shore to the closest property in our data set, it is not located on its shores.Footnote 3 This fact allows us to overcome the confounding effect that close proximity, and especially a riverfront view, might have on flooding risks. The city is traversed by five creeks whose currents serve as tributaries of the La Plata River. These creeks are responsible for the potential of flooding and in themselves have no aesthetic or recreational value. Secondly, La Plata is a rather homogeneous city in terms of topography and access to environmental amenities. Thirdly, the city is relatively flat, low-lying and in close proximity to a major river. Predicted sea-level rise and intense storms in the area due to climate change will make flooding events more likely in the foreseeable future (IPCC, Reference Field, Barros and Dokken2014). Lastly, there is no insurance against flooding for homeowners, so prices reflect the perceived risks of experiencing losses.
In this paper we estimate spatial hedonic price models to find out whether or not the housing market discounts flooding hazards. In essence the hedonic model views the price of individual houses as dependent on a bundle of housing characteristics. These characteristics are often related to the structure of the dwelling, the neighborhood attributes, the surrounding environmental quality – including the risk of flooding – and property taxes. Thus, the spatial variation in housing characteristics partially explains the spatial variability of housing prices. The hedonic approach allows us to uncover the implicit price of each characteristic, providing information about people's willingness to pay for changes in flooding risks.
The results indicate that the market value of real estate located within a flood-prone area is lower than that of a similar property located outside those areas. Moreover, the predicted discount increases with risk exposure. Over the entire sample of houses and undeveloped parcels of land, the reduction in property values in inundation-prone areas is about 3.5 per cent and 10 per cent, respectively. The remainder of this paper proceeds as follows. In section 2 we review the literature, followed in section 3 by the methodology. Section 4 presents the data and section 5 the main results. We conclude in section 6.
2. Related literature
Since the pioneering work by Lancaster (Reference Lancaster1966) and Rosen (Reference Rosen1974), many studies have applied the hedonic property price model to estimate the value of environmental amenities and the discount from hazards such as floods, earthquakes or chemical plants on residential property values. The hedonic price model allows us to infer the willingness to pay to reduce the exposure to risks by identifying the total value of the chance that such hazards will effectively happen, including not only material losses but also non-material and subjective losses. Several hedonic studies, predominantly for the United States, have specifically addressed the issue of flooding (Park and Miller, Reference Park and Miller1982; Thompson and Stoevener, Reference Thompson and Stoevener1983; MacDonald et al., Reference MacDonald, Murdoch and White1987; Donnelly, Reference Donnelly1989; Shilling et al., Reference Shilling, Sirmans and Benjamin1989; Speyrer and Ragas, Reference Speyrer and Ragas1991; Harrison et al., Reference Harrison, Smersh and Schwartz2001; Zhai et al., Reference Zhai, Fukuzono and Ikeda2003; Bin and Polasky, Reference Bin and Polasky2004; Bin and Kruse, Reference Bin and Kruse2006; Carbone et al., Reference Carbone, Hallstrom and Smith2006; Bin et al., Reference Bin, Kruse and Landry2008; Kousky, Reference Kousky2010; Samarasinghe and Sharp, Reference Samarasinghe and Sharp2010; Rambaldi et al., Reference Rambaldi, Fletcher, Collins and McAllister2013, to name a few). Although these papers usually differ in their definition of flooding risks, the vast majority point to a statistically significant price discount. In general, a floodplain location reduces property values by about 5 per cent in relation to otherwise similar houses.Footnote 4 A recent paper performing a meta-analysis of 19 studies for the United States reports that an increase in the probability of flood risks by 1 per cent in a year translates into a decrease of 0.6 per cent in property transaction values (Daniel et al., Reference Daniel, Florax and Rietveld2009).
As we will see, the literature has covered other issues related to flood hazards besides their direct impact on housing values. For instance, the effect of flooding insurance has received some attention in empirical studies.Footnote 5 In this case, the price discount associated with a floodplain location is usually compared to the capitalized premium value of flood insurance. In general, results show that the flood risk discount often exceeds the capitalized insurance premium, implying that some uninsured risk remains (e.g., non-monetary losses).Footnote 6 An alternative explanation points to incomplete information by homeowners about the true risks of experiencing a flooding event, or to the fact that costs associated with flooding events tend to be underestimated.
More recently, some papers have estimated the impact of a particular flooding event on housing values. Bin and Polasky (Reference Bin and Polasky2004) find an additional price discount for houses located in inundation-prone areas after Hurricane Floyd. Zhai et al. (Reference Zhai, Fukuzono and Ikeda2003) report a similar result after a major flooding in central Japan. The advantage of this approach is that it allows us to infer how market participants update perceived risks immediately after such an event. However, whether these reported impacts last over time or not is another issue. Kousky (Reference Kousky2010) uses almost 30 years of repeated property sales in St Louis, Missouri, to estimate not only the immediate impact of a major flooding but also how perceived risks vary in the years after the event.
Another strand of the literature analyzes the effect of flood regulations on risk perception, and ultimately on property values. In particular, these regulations usually involve flood risks information disclosure. Since many people may not be fully aware that they live in a flood-prone area, it has become common for government agencies, at least in developed countries, to require that potential buyers be informed about the chance of experiencing a flood. The effect of this type of regulation ultimately depends on how different the objective risks are compared to those hazards as perceived by homeowners and potential buyers. For instance, Samarasinghe and Sharp (Reference Samarasinghe and Sharp2010) conclude that price discount is reduced by the release of public information regarding such hazards.
Finally, the empirical literature on the economic valuation of flooding hazards has accompanied the evolution of the methods used in hedonic price models (see Palmquist, Reference Palmquist, Mäler and Vincent2005). In particular, almost every study in recent years attempts to model spatial interactions between housing units in their estimates. We follow this lead in the next section.
3. Empirical strategy
This study uses a spatial hedonic approach to estimate the effects of flood-prone locations on property values. Since in Argentina there is no such a thing as home insurance against the risk of flooding, and since there are no available data on real estate market activity after the 2013 flooding incident, we will focus our efforts on estimating the willingness to pay to avoid the risk of flooding prior to that event.
As previously stated, a hedonic price model relates the price of a dwelling to its attributes.Footnote 7 In particular, if an individual's utility function is defined as a function of housing, environmental quality, flooding risk, socio-economic characteristics and a composite good, utility maximization would lead such an individual to equate the marginal utility of each attribute to its marginal price. The derivative of the hedonic price equation with respect to each explanatory variable is its implicit marginal price. This marginal implicit price can be interpreted as the marginal willingness to pay, assuming the housing market is in equilibrium (see Rosen, Reference Rosen1974). Furthermore, the hedonic model assumes that benefits derived from a reduction in the flooding risk will be reflected in the price individuals pay for a property they choose, and that all buyers and sellers have perfect information on each housing attribute. In other words, the rationale behind this approach is that, ceteris paribus, properties in an area with a lower flooding risk will have this benefit capitalized into their value, which should be reflected in higher prices.
As mentioned earlier, an important characteristic of the real estate market is the existence of spatial relationships. According to Anselin (Reference Anselin1988) there are two types of spatial interactions. The first one, spatial dependence, emerges whenever a variable tends to assume similar values in geographically close units. In real estate markets it may appear when either the prices or the characteristics of houses that are close are more similar to each other than those of houses that are farther apart.Footnote 8 The second one, spatial heterogeneity, implies that the functional forms and the parameters are not homogeneous and vary according to the location. Spatial heterogeneity can originate from characteristics of the demand, the supply, institutional barriers or racial discrimination, all of which can make the distribution of house prices differ throughout space.
Independently of the form of spatial dependence, ordinary least squares (OLS) will lead to inefficient estimates. If spatial dependence of a spatial lag form is ignored, then OLS estimates will not only be inefficient, but also biased and inconsistent. The consequences of ignoring spatial dependence when it is in fact present in the data-generating process have been widely discussed in the literature (see Anselin, Reference Anselin1988; Anselin and Bera, Reference Anselin, Bera, Ullah and Giles1998; LeSage and Pace, Reference LeSage and Pace2009).
In this paper we estimate a spatial hedonic model that considers not only spatial dependence in the dependent variable but also a model which allows for the disturbances to be generated by a spatial autoregressive process. A simple version of these models, typically referred to as the spatial autoregressive (SAR) model, augments the linear regression model by including an additional right-hand-side variable known as a spatial lag. Each observation of the spatial lag variable is a weighted average of the values of the dependent variable observed for the neighborhood units. Generalized versions of the SAR model also allow for the disturbances to be generated by a SAR process. The combination of a SAR model with SAR disturbances is often referred to as a SARAR Model (see Anselin and Florax, Reference Anselin, Florax, Anselin and Florax1995).
In modeling the outcome for each unit as dependent on a weighted average of the outcomes of other units, SARAR models determine outcomes simultaneously. Thus, the model we consider is a linear cross-sectional SAR model with exogenous variables and SAR disturbances:
 $$P = \rho W_{1}P + X \beta + F\gamma + \epsilon$$
 $$\epsilon = \lambda W_{2} \epsilon + \mu.$$
In this specification, P is a vector of (log) real estate prices, X is a matrix of explanatory variables related to the structure of the dwelling and attributes of the neighborhood, and F is a matrix of flood risk variables. The parameter ρ is the coefficient of the spatially lagged dependent variable and λ is the coefficient in the SAR structure for the disturbance, ε.Footnote 9 The innovation μ is taken to be independent and identically distributed.
In this context, ρ represents the strength of the spatial price dependence, showing how a price change in a given property affects property values in neighboring units. The higher the value of ρ, the higher the spillovers between properties will be. The spatial lag specification is often justified by the way the real estate appraisal process works, since comparable neighboring properties are used in determining the appraisal value for a specific unit. On the other hand, the parameter λ shows the intensity of the spatial relationship through the error term. If positive, this parameter indicates that a given shock will not only affect the region in which it was originated, but that it will be transmitted throughout space. An alternative explanation points to omitted spatially correlated variables, or measurement errors.Footnote 10 Again, not accounting for these spatial relationships may lead to biased and inconsistent estimates.
The matrices, W 1 and W 2, are spatial weight matrices associated with a SAR process in the dependent variable and in the disturbance term. The literature has documented various types of specifications that can be broadly classified as ‘contiguity’ and ‘distance-based’ matrices.Footnote 11 We construct a spatial weight matrix using the distance decay matrix that assigns nearby real estate properties a higher weight than those that are further away [w ij =d ij −α]. In particular, we choose an α parameter equal to 2, which means that the weight is the inverse distance squared between any two observations.Footnote 12
An implication of the model is that a change in the explanatory variable for a single observation can potentially affect the dependent variable in all other observations. In other words, the direct impact of each variable also has an indirect impact on its neighbors’ dependent variable. Thus, a change in an attribute in a property will not only exert a direct effect on the price of that observation, but also an indirect effect on the price of neighboring properties. This type of impact arises due to the interdependence between observations in the model.Footnote 13 The magnitude of this indirect effect will depend upon: (i) the degree of connectivity among observations, which is governed by the weight matrices W in the model; (ii) the parameter ρ measuring the strength of spatial dependence; and (iii) the parameters β. Below we report not only the regression coefficients but also the direct and indirect marginal effects. A comparison of spatial models to the OLS regression results reveals the extent to which the estimated coefficients are over- or underestimated in the OLS model.
4. Data
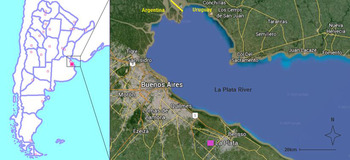
In this paper we analyze the effect that the existence of flood-prone areas has on housing market prices using data from the La Plata Metropolitan Area (LPMA), Argentina. The city is the capital of the Province of Buenos Aires which, according to the 2010 Census, has a population of 649,613 inhabitants and 265,677 residential properties. La Plata is a planned city, an urban planning paradigm of the late 19th century.Footnote 14 The original plan of the city, designed by architect Pedro Benoit, is characterized by a grid of rigid lines bearing important avenues. Nowadays, the city has expanded into several suburbs without much urban planning having been carried out.Footnote 15 The city is located in the northeastern portion of the Province of Buenos Aires, about 60 km southeast of the city of Buenos Aires (see figure 1).
City of La Plata and La Plata River Basin

4.1. Housing Market
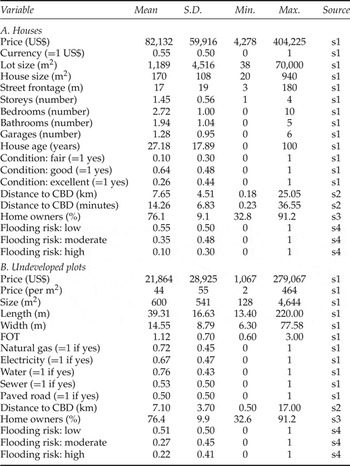
The data used in this paper include 1,969 single-family homes on sale in the market between November 2006 and September 2007, and 679 vacant plots for sale during 2004.Footnote 16 The data were gathered by looking at single-occupancy houses and vacant lots for sale as advertised by 28 local real estate agencies. These agencies, which represent about 95 per cent of the local housing market, publish their offers in an online information system called SIOC (Sistema Inmobiliario de Ofertas por Computacion). This system provides such information as the exact location of a property, its asking price, the dimensions of the parcel and the house, and other structural characteristics including the number of bedrooms and bathrooms, age of the structure and its condition, and the availability of parking space. In addition to the information obtained from the SIOC, we calculated the driving distance and travel time from the property to the central business district (CBD).Footnote 17 The SIOC also contains information on the availability of public services in the area, such as sewers and water supply, and the allowed floor-to-space ratio (FOT), but this only for vacant plots.
As in the rest of Argentina, La Plata's real estate market frequently uses the US dollar as the currency of reference. This has become a necessity partly due to the country's history of monetary instability, which has gravely worsened since the hyperinflation of 1989–1990. Not surprisingly, more than half of the houses in our sample are listed in US dollars. One could simply convert those prices listed in Argentine pesos into US dollars, or vice versa, for the empirical implementation; however, those houses listed in US dollars are very different from those advertised in the local currency. In particular, the quality of the structures of the houses listed in US dollars tends to be better, a characteristic that is not fully captured by the reported condition of the houses by SIOC. For instance, two brand new homes of very different quality would be listed as being in excellent condition. Therefore, the reported condition in itself does not control all quality differentials among houses. Taking this into account, we convert property prices into US dollars but include a dummy variable that captures the currency in which houses were originally listed.
This study also accounts for the effect of suburbs within the LPMA. A set of dummy variables is included for each suburb or neighborhood, each representing a house located in a particular neighborhood; otherwise a zero is used. The purpose of these dummy variables is to capture any unobservable socio economic differences between the suburbs.Footnote 18 About 35.6 per cent of the houses for sale were located within the original city layout. As expected, the availability of vacant plots in that part of the city is much smaller, only 16 per cent of the plots in our sample.
Before we analyze the data, we should clarify that it was not possible to access data on real estate transactions and for this reason we have to rely on asking prices alone. Although formal housing markets are very well developed in Argentina, transaction prices are almost always under-registered in order to avoid paying the corresponding taxes.Footnote 19 Therefore little is gained by abjuring the convenience of declared transaction values in the case of housing markets in Argentina.Footnote 20 Asking prices, although potentially different from the equilibrium values, are established mostly by experienced appraisers, which leads us to assume that they are not very different from their equilibrium values. Moreover, the relatively high market activity during the analyzed period (Argentina's GDP grew around 9 per cent per year between 2004 and 2007) suggests that sellers very often sold properties for the asking price, implying that these prices must have been close to the actual transaction values.Footnote 21
Table 1 presents descriptive statistics for the sample of houses and plots. The average asking price for a house was US$ 82,132 (PPP 2005), with a minimum price of US$ 4,278 and a maximum of US$ 404,225.Footnote 22 A typical home is 27.2 years old and has 170.7 m2 of indoor living space in a lot that has 1,189 m2.Footnote 23 It has 2.72 bedrooms with almost two bathrooms and private parking space for 1.3 cars. About a quarter of the houses are reported to be in excellent condition, 64 per cent in good condition, and the remaining 10 per cent in fair shape. Undeveloped parcels of land tend to be larger in size and are located in zones with fairly good access to public services, with the exception of sewers and paved roads.
Data for hedonic analysis

Notes: Summary statistics taken over 1,969 single family homes and 679 plots of undeveloped land. Prices are in US$ PPP 2005. Data sources are: s1, Sistema Inmobiliario de Oferta por Computación (SIOC); s2, SIOC and geospatial tools; s3, Census; s4, Instituto de Geomorfología y Suelos and geospatial tools.
4.2. Flood hazards
The weather in the region is fairly humid all year round, owing to its proximity to the coast, with humidity being on average greater than 75 per cent for each month of the year. About 1,100 ml of rain fall in La Plata every year, with winters being the drier months and summers the wetter ones.Footnote 24
The flooding risk data come from a study produced by the Instituto de Geomorfología y Suelos (IGyS) of the Universidad Nacional de La Plata, during the early 2000s (Hurtado et al., Reference Hurtado, Giménez and Cabral2006). The report analyzed the flood-prone areas of La Plata City based on the geomorphology of the terrain and the runoffs. It represents the convergence of two flooding problems: flooding and rising water table. From the physical standpoint, flood-prone areas are those areas most likely to be affected by rainfall and flooding from overflowing water bodies, which in turn influence the relative position of the water table, reducing underground storage capacity. Most of the city is flat and low lying. The highest elevation point is only 24 m above sea level and about 85 per cent consists of soil that is poorly drained.
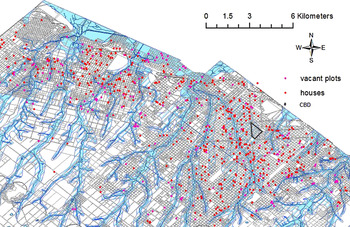
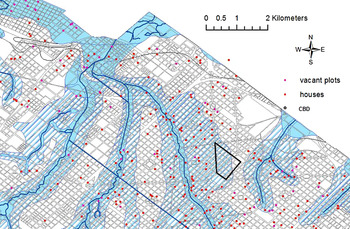
In order to link flooding hazards to real estate data, it was necessary to geocode each property in our sample, a process that was carried out manually using the postal address of each house or vacant lot. We then assigned each observation to one of the three flood risk categories using GIS software.Footnote 25 Figure 2 shows the LPMA, the streams, the different flood-prone areas and the real estate offers used in the analysis. Figure 3 presents a detailed map of the central part of the city. The dark gray lines in figure 3 show the city's runoffs. The flood risk variable in our study takes three values according to where the property or plot is located on one of the three geographical units as classified in the IGyS study. The light gray areas are those where the risk of flooding is higher, with a recurrence of a flooding every 20 years. These areas include the banks of streams, buckets and ditches, mud plains and inner estuaries. About 10 per cent of the houses and 22 per cent of the vacant plots that make up our sample are located in these high-risk areas.
Flood-prone areas and real estate offers in the La Plata Metropolitan Region

Flood-prone areas and real estate offers in Central La Plata

The hatched regions surrounding the high-risk zones are those parts of the floodplain where risks are categorized as moderate and which include the slopes that converge to the streams. It is possible that some properties located in a moderate flood-hazard zone had never experienced a major flooding problem until April 2013. Around 35 per cent of the houses and 27 per cent of the undeveloped parcels are located within these areas. The associated risk is of a flooding every 20–100 years. It is interesting to note how the city is expanding into riskier zones, as vacant plots for sale are more likely to be located in high-risk areas relative to developed land for sale in the market. As the city grew in size, land of a poorer quality, i.e., land which is more likely to suffer floods, was brought onto the market. The rest of the houses and plots, 55 and 51 per cent respectively, face a low risk of flooding.Footnote 26
5. Results
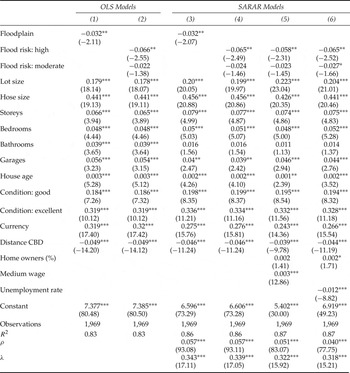
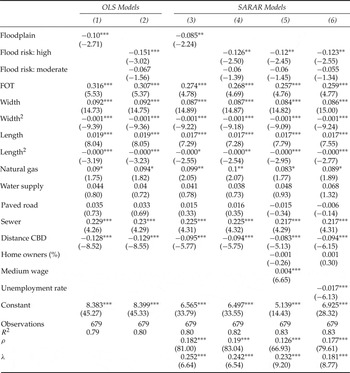
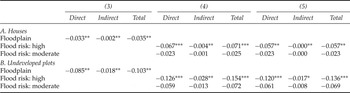
The results of our analysis on how flood risks impact on house and vacant parcel prices are presented in tables 2 and 3, respectively. We report empirical estimates of these effects as well as estimates of shadow prices of other characteristics. The dependent variable in all models is the natural log of the asking price. The first two columns in both tables correspond to OLS estimates while the remaining columns to maximum likelihood (ML) estimates of SARAR models. Table 4 presents the marginal effects for the flood-risk variables for selected SARAR models.Footnote 27
Regression results for houses

Notes: Dependent variable for all regressions is the logarithm of house prices. All specifications include (16) neighborhood fixed effects. t-statistics in parentheses: ***p<0.01, **p<0.05, *p<0.1.
Regression results for undeveloped plots

Notes: Dependent variable for all regressions is the logarithm of the price of vacant plots. All specifications include (13) neighborhood fixed effects. t-statistics in parentheses: ***p<0.01, **p<0.05, *p<0.1.

5.1. Houses
Location on the floodplain is associated with lower house values for both the OLS (column 1) and ML (column 3) models. The coefficients are identical between models and point to a decrease in value of between 3.2 per cent (OLS) and 3.5 per cent (ML) in relation to otherwise similar houses (see total marginal effects for SARAR models in panel A of table 4).Footnote 28 These magnitudes are comparable to those reported in the literature, but ours are on the lower end. Regarding the estimated marginal effects in spatial models, it is interesting to note that the indirect effects, though statistically significant, are negligible with respect to the direct effects.
To further explore the effect of flood risks on housing values, we separate location on the floodplain between those areas exposed to high risks from those exposed to moderate ones. Both the OLS (column 2) and ML estimates (columns 4–6) suggest that only those houses in riskier areas suffer a significant price discount, of around 5.7 and 7.1 per cent. Moreover, marginal effects related to moderate risks are less than half of those associated with higher risks areas. However, there is little evidence that houses in moderately risky areas are discounted since only one model specification, the last in table 2, shows a significant estimate at the 10 per cent level of confidence. In other words, our results suggest that the market underestimates hazards in zones under moderate risks of flooding.Footnote 29 The OLS coefficient on high flooding risks is similar in magnitude and in the mid-range of those reported by the spatial specifications, and corresponding total marginal effects. Therefore, it seems that the bias introduced by ignoring spatial interactions might not be that pervasive, at least regarding flooding hazards.
As we will see, most of the structural characteristics of properties are significant in understanding price variation. Both the lot size and the built-up living area have positive coefficients that are significant at the 1 per cent level, although each additional square meter of covered living space is more valuable. Other structural attributes like the number of storeys or the number of bedrooms and garages exert a positive effect on housing prices; their coefficients are precisely estimated. The magnitude of these coefficients does not seem to differ much between specifications. In contrast, the number of bathrooms is only significant in the OLS models.
As expected, the overall condition of a house affects its price. As a result, houses advertised as being in good or excellent condition are worth more than otherwise similar houses. In particular, price increases with the quality of the house, since the coefficient of the dummy variable for excellent condition almost doubles the one for houses described as being in good condition. As mentioned above, these variables might not fully capture the quality of a house. For instance, a brand-new home would be listed as in excellent condition regardless of its true quality. Therefore, we include two other variables that partially capture the quality of a house: the age of the structure and the currency in which it was originally listed. With regards to the structure, older houses tend to be better built, they may have special structural characteristics – such as high ceilings – or they may be built in a particular architectural style, all of which is greatly valued by potential buyers. As regards the currency, those houses advertised in US dollars are usually more expensive. In this case, the currency points to the quality of a house, an attribute not fully captured by other variables. This variable turns to be highly significant in all specifications, and of considerable magnitude.
As discussed before, information about neighborhood attributes is not easy to obtain for La Plata City. In particular, there are no available data on crime rates, something that is usually correlated with housing prices.Footnote 30 Nevertheless, we believe that the incidence of crime is partially captured by the inclusion of 16 neighborhood dummy variables. For additional neighborhood controls, we include in the last two specifications the medium wage, the unemployment rate and the percentage of home owners by Census tract. These variables have the expected effect on housing values: affluent zones and those with higher rates of homeowners tend to have more expensive houses. In contrast, house values are lower the higher the unemployment rates.
Location seems to matter, especially with respect to the city's center. Distance to the CBD is negatively associated with housing values, as demonstrated by our estimates, which imply that the price of a house is reduced by 4.5 per cent with each additional kilometer.Footnote 31 Finally, results support SARAR models. In particular, both estimates of ρ and λ are highly significant, implying the presence of both spatial dependence and an SAR process in the disturbances. Moreover, both parameters are positive, implying that a higher price in one housing unit positively affects prices in neighboring units (positive externalities), and that shocks are transmitted across space.
5.2. Undeveloped plots
In table 3 we report regression results for the sample of undeveloped parcels of land. These types of real estate properties have the advantage, for the purpose of this study, that they are more homogeneous than houses since there is no structure that affects their value. In particular, the only relevant plot attributes are their dimensions, access to services, total allowed construction area (FOT) and location.
As was the case with houses, location on the floodplain negatively affects plot prices. OLS estimates (column 1) show a statistical price discount of about 10 per cent for otherwise identical parcels. ML estimates suggest a very similar price discount (see total marginal effects in the first row in panel B of table 4). When disaggregating risks within the floodplain, those plots in riskier areas suffer a significant and larger discount, between 13.6 and 15.4 per cent; however, the market does not seem to discriminate moderate risks from risk-free situations (see columns 2, 4 and 5 of table 3, and corresponding marginal effects in table 4).Footnote 32
The rest of the coefficients on property characteristics have the expected effect on plot prices. Bigger parcels that have access to service infrastructure, especially sewerage, are more valuable. Plots further away from the CBD are worth less. Finally, socio-economic characteristics, such as household income and the unemployment rate, potentially correlated with neighborhood attributes, have the expected effect on property prices.
The case that undeveloped land in flood-prone areas receives different discounts from developed parcels deserves an explanation. However, it is not possible to compare coefficients across panels A and B of table 4 (or appendix table A1) because they come from different models. In fact, when estimating houses and vacant plots separately, we are treating them as if they come from separate markets.Footnote 33
In order to compare the impact of flooding hazards on both types of real estate, we have proceeded as follows. First, we pooled houses and undeveloped land in a unique sample assigning a value of zero for every structural characteristic to every vacant plot. In other words, we treat a vacant plot as if it were a house without bedrooms, bathrooms or any indoor space. As mentioned before, in doing this exercise we have to drop some relevant variables (see footnote 33). Secondly, we estimated both the full model and the reduced models, i.e., one with only houses or vacant parcels. Then, these nested models allow us to test differences between coefficients for flood risk variables across the full and restricted models.Footnote 34 The results (unreported) suggest that the market perceives vacant plots to be riskier than houses. In fact, the estimated impacts of flood risk variables in the full model lie in the middle of those reported in tables 2 and 3, and are statistically different from those in the reduced models. On the one hand, it could be that vacant plots are located in riskier areas within the floodplain, and therefore perceived risks are aligned with objective risks differentials. The fact that the city is expanding over flood-prone areas provides some evidence in that direction. On the other hand, a higher discount could be entirely due to subjective reasons. In any case, the fact that both houses and vacant parcels are discounted relative to similar properties in less risky areas implies that people are willing to pay to reduce the exposure to such hazards.
6. Conclusions
The mitigation of flood risks has been gaining the attention of policy makers as extreme weather events are predicted to intensify in the near future. There exists a vast empirical literature on how people's willingness to pay to avoid urban flood hazards is measured, but it is almost entirely focused on developed countries. Evidence from developing countries is sparse, particularly for Latin America.
In this paper we have estimated the effect of flood risks on real estate prices using spatial hedonic models for the city of La Plata, Argentina. The results indicate that when real estate properties are located on flood-prone areas, their price is discounted. Moreover, our findings suggest that the negative impacts on property values increase with risk exposure. Specifically, our estimates show that those houses on the floodplain are worth about 3.5 per cent less than otherwise similar houses. In fact, the discount on prices doubles for houses located in higher risk areas.
Evidence from undeveloped parcels of land points in the same direction. However, estimated shadow prices are heavily discounted compared to those of houses. In particular, undeveloped lots are worth 10.3 per cent less relative to lots facing smaller risks. Price differentials could increase up to 15.4 per cent for properties located in areas with higher flood risks.
The difference between the estimated impacts for houses and undeveloped parcels is in itself interesting. On the one hand, it is possible that undeveloped parcels could be located in higher exposure zones within a given risk area. The fact that they remain undeveloped reinforces this idea. On the other hand, even if there was no objective risk difference between houses and plots, it could be the case that people perceived the opposite to be true. In any case, a policy aimed at providing information to potential buyers about true risk exposure would certainly increase overall welfare.
It would be interesting to analyze how the discount on prices changed after the 2013 flooding event. It is very likely that people have updated their perception of risks, therefore reducing property prices in the floodplain. We leave this, however, for future research.
Finally, we believe that this study has important implications when deciding on infrastructure investments. The estimated willingness to pay should be confronted with the expected costs of alternative flood control projects in order to prioritize investments.
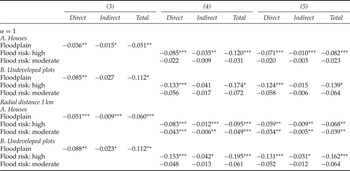
Sensitivity analysis of marginal effects to alternative weighting schemes