Pulmonary circulation is a high-volume, low-pressure system with the right ventricle as a flow generator. In patients with congenital acyanotic shunt lesions with increased pulmonary blood flow, this system is overburdened with either increased flow, increased pressure, or both.
The pulmonary circulation has been characterised under three components, viz. pulmonary vascular resistance index, pulmonary arterial compliance, and impedance. While the pulmonary vascular resistance index represents the static right ventricular afterload, impedance and compliance together constitute the dynamic component of the afterload. Reference Milnor, Jose and McGaff1
Our assessment of pulmonary vasculature in patients with acyanotic heart disease and increased pulmonary blood flow (Qp) is largely based on the calculation of pulmonary vascular resistance index. Reference van der Feen, Bartelds, de Boer and Berger2,Reference Lopes and Oleary3 While a few studies have calculated pulmonary arterial compliance values in humans, Reference Milnor, Jose and McGaff1,Reference Slife, Latham, Sipkema and Westerhof4–Reference Kirby7 pulmonary arterial compliance has not been adequately studied in patients with shunt lesions, nor its utility in clinical decision-making been explored. The product of pulmonary arterial compliance and pulmonary vascular resistance index, the RC time, has also not been well studied in patients with shunt lesions. We studied the pulmonary arterial compliance in large number of patients with acyanotic shunt lesions with increased pulmonary blood flow with a view to evaluate the range of pulmonary arterial compliance at all ages and also studied its relation to other parameters. We evaluated the pulmonary arterial compliance values in operable, borderline, and inoperable patients as decided by the clinicians previously. In addition, the RC time was calculated in all the patients and similarly analysed.
Materials and methods
We retrospectively evaluated records from consecutive patients with acyanotic shunt lesions with increased Qp who underwent right heart catheterisation during the study period, that is from 01 January to 31 December, 2019. Patients with a concomitant lung disease, surgical interventions in the pulmonary vasculature, or anatomic abnormality of the pulmonary artery, for example branch pulmonary artery stenosis, hypoplastic pulmonary arteries, patients not in sinus rhythm at the time of study, patients with severe right ventricular dysfunction, and patients with incomplete records, were excluded.
Ethical approval was taken from the institutional ethics committee, and all the patient-related data were collected anonymously.
Cardiac catheterisation was done under conscious sedation as per routine; the baseline haemodynamic data were collected in all patients. Oxygen consumption was assumed using the published charts; Reference LaFarge and Miettinen8 vasoreactivity testing was done with 100% oxygen given by the face mask for 10 mins, when indicated. We have not included haemodynamic data with oxygen in this study.
Detailed clinical information was available for all the patients, and the haemodynamic data were analysed to calculate the following additional parameters retrospectively.
 $${\kern 1pt} \rm{PCa} = {{QPi} \over {Heart\,Rate \times Pulmonary\,artery\,pulse\,pressure}}$$
 $${\rm{RC \,Time{\kern 1pt} (S) = PCa (ml mmH{g^{ - 1}}) \times PVRi (mmHg{L^{ - 1}} \min ) \times 0.06}}$$
 $${\rm{Equation 1: Formulae \, for \, calculation \, of \, various \, parameters}}$$
 \begin{align}&
{\rm{(Qpi = indexed \, pulmonary \, blood \, flow, \, HR = heartrate,}}\\
&{\rm{PCa = Pulmonary \, arterial \, compliance)}}\end{align}
Qpi measurement in our laboratory is based on the assumed values of oxygen consumption routinely. For patients where pulmonary artery wedge pressure was not measured, left ventricular end-diastolic pressure was taken as equal to mean wedge pressure for calculation of pulmonary vascular resistance index. Patients were classified into clearly operable, clearly inoperable, and with borderline operability, based on the final decision of the treating team. The decision regarding operability was based on a comprehensive clinical evaluation which included age of the patient, clinical details, and haemodynamic parameters. Operability decisions were guided by the conventionally used criteria. Reference Lopes, Barst and Haworth9 Patients with raised pulmonary vascular resistance index > 6 unit but persistent significant left to right shunts were considered borderline operability. Although vasodilatory testing with oxygen was done whenever the resting pulmonary vascular resistance index was high, but the operability decisions relied heavily on the basal haemodynamic data and a comprehensive clinical evaluation. All the contentious cases were discussed in the haemodynamic conference, and patients were labelled as operable, inoperable, or having borderline operability by the consensus of experienced cardiologists.
There are various methods of measurement of pulmonary arterial compliance. Reference Yin, Liu and Brin10–Reference Lankhaar, Westerhof and Faes12 We calculated pulmonary arterial compliance using the pulse pressure method Reference Stergiopulos, Meister and Westerhof13,Reference Saouti, Westerhof, Postmus and Vonk-Noordegraaf14 using formulae as above (equation 1), as this is a simple and accurate method of measurement of pulmonary arterial compliance. Reference Stergiopulos, Meister and Westerhof13,Reference Ghio, Schirinzi and Pica15,Reference Stergiopulos, Meister and Westerhof16
Statistical analysis
Data were analysed by Stata 11.2 (Stata Corp. 4905 College Station, Texas 47845, USA) and presented as mean ± SD, median (range), median (interquartile range), or frequency (percentage). Parameters of the individuals between operable and non-operable groups were compared using chi-square test or Fisher’s exact test for categorical variables, independent t-test for variables following normal distribution, and Wilcoxon rank sum test for parameters following non-normal distribution. Spearman’s correlation was used to correlate the continuous variables. Receiver operating characteristic curves were generated to identify the cut-offs for various parameters for association with operability. Univariate and stepwise multivariate logistic regression was used to calculate unadjusted and adjusted OR after assessing multicollinearity and mediators among the variables.
Results
Baseline characteristics
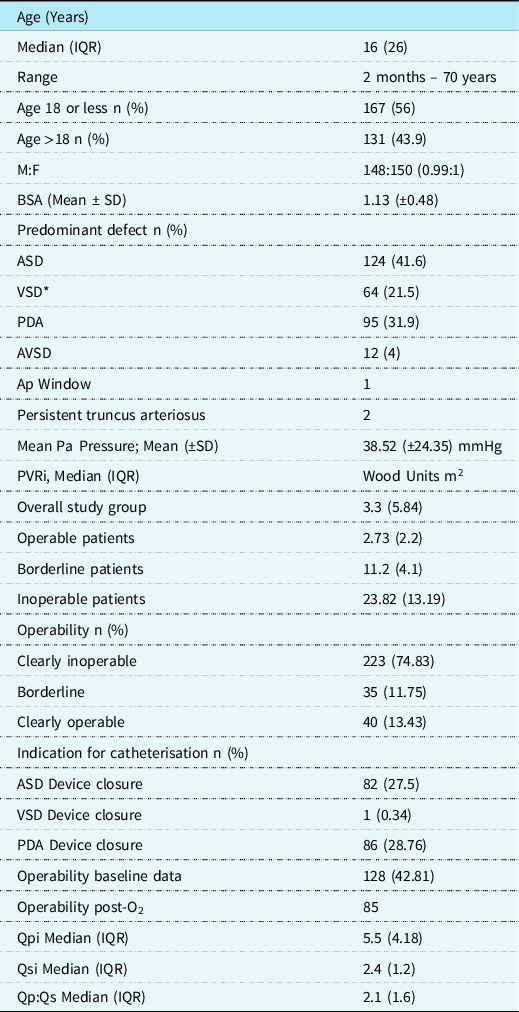
A total of 324 right heart catheterisation records were evaluated for inclusion. Of these, 26 were excluded (11 pulmonary artery stenosis, surgery or hypoplasia, 08 incomplete data, 04 non-sinus rhythm, 03 right ventricular dysfunction). Remaining 298 patients (148 males, M:F 0.99:1) were included. The median age of study patients was 16 years (range 2 months to 70 years, 167 patients (56%) less than 18 years). Atrial septal defect was the most common defect (n = 124, 41.6%), followed by patent ductus arteriosus (n = 95, 31.9%) and ventricular septal defect (n = 64, 21.5%). The patients were catheterised for diagnostic or therapeutic purposes (n = 168 for device closure, 130 diagnostic catheterisation). The baseline characteristics of study population are shown in Table 1. Overall, the median Qpi was 5.5 L/min/m2 (IQR 4.18), the mean (±SD) of pulmonary artery mean pressure was 38.52(±24.35) mmHg, and median pulmonary vascular resistance index was 3.3 (IQR 5.84) Wood units m2 (Table 1). Lesion-wise haemodynamic details of the patients are given in Supplementary Table 1.
Baseline characteristics of the study population.

* Including 05 patients with Down Syndrome.
Subgroups of congenital heart lesions (Supplementary Table 1)
The clinical characteristics including age, pulmonary artery pressures, and the magnitude of the shunts are shown in Supplementary Table 1. Amongst the subgroups, mean pulmonary artery pressure for the atrial septal defect patient subgroup was 30.03 mmHg and median pulmonary vascular resistance index was 2.57 Wood units m2. Patients with patent ductus arteriosus had a mean pulmonary artery pressure of 31.68 mmHg and median pulmonary vascular resistance index of 3.0 Wood units m2. The mean pulmonary artery pressure for ventricular septal defect subgroup was 61.6 mmHg and median pulmonary vascular resistance index 10.18 wood units m2.
Pulmonary arterial compliance
Mean pulmonary arterial compliance for the overall study group was 2.88 ml/mmHg (±3.2) per m2 (Median 2.13, IQR 2.1) (Table 2). The mean pulmonary arterial compliance for patients with a normal pulmonary artery pressures (Mean pulmonary artery pressure less than 20 mmHg ) was 5.37 mm Hg (±5.05), median 4.1, IQR 3.2. Pulmonary arterial compliance was significantly lower in the inoperable group (mean 0.61 ± 0.36, Median 0.52 ml/mmHg, IQR 0.34), when compared to both, borderline (mean PCa 0.87 ± 0.3 ml/mmHg, median 0.80 IQR 0.36) (p < 0.001) as well as clearly operable patients (mean pulmonary arterial compliance 3.61 ± 3.42 ml/mmHg, median 2.67 ml/mmHg IQR 2.2) (p < 0.001).
Statistical analysis of PCa values.

Relationship of pulmonary arterial compliance to pulmonary blood flow and pulmonary artery pressure
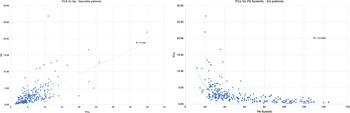
Pulmonary arterial compliance showed a linear relation with Qpi, with a loose fitting curve (R2 0.37) (Fig 1). Pulmonary arterial compliance showed an inverse parabolic relationship with pulmonary artery systolic, diastolic, and mean pressures. The best correlation was seen between pulmonary arterial compliance and pulmonary artery systolic (power, r2 0.44) (Fig 1). The correlation with mean and diastolic pulmonary artery pressures was a loose fit (r2 0.29 and 0.15, respectively).
Relationship of PCa to Qpi (Operable patients) and PA systolic (all patients), all lesions.

On multivariate analysis, nature of the defect and higher pulmonary artery mean significantly contributed to the lower pulmonary arterial compliance.
Relationship of pulmonary arterial compliance with other factors
Pulmonary arterial compliance did not correlate with the age, neither for the overall study group, nor for individual lesions atrial septal defect, ventricular septal defect, patent ductus arteriosus, or AVSD.
Pulmonary arterial compliance did not correlate with the transpulmonary pressure gradient (calculated as the difference between pulmonary artery diastolic and mean pulmonary artery wedge pressure) in the overall study group, or in any of the subgroups of operable, inoperable, and borderline patients.
Pulmonary arterial compliance - pulmonary vascular resistance index relationship
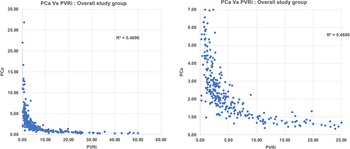
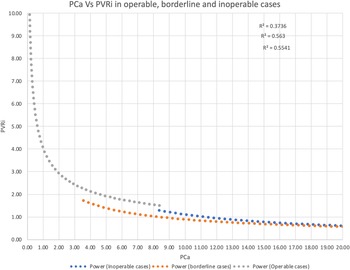
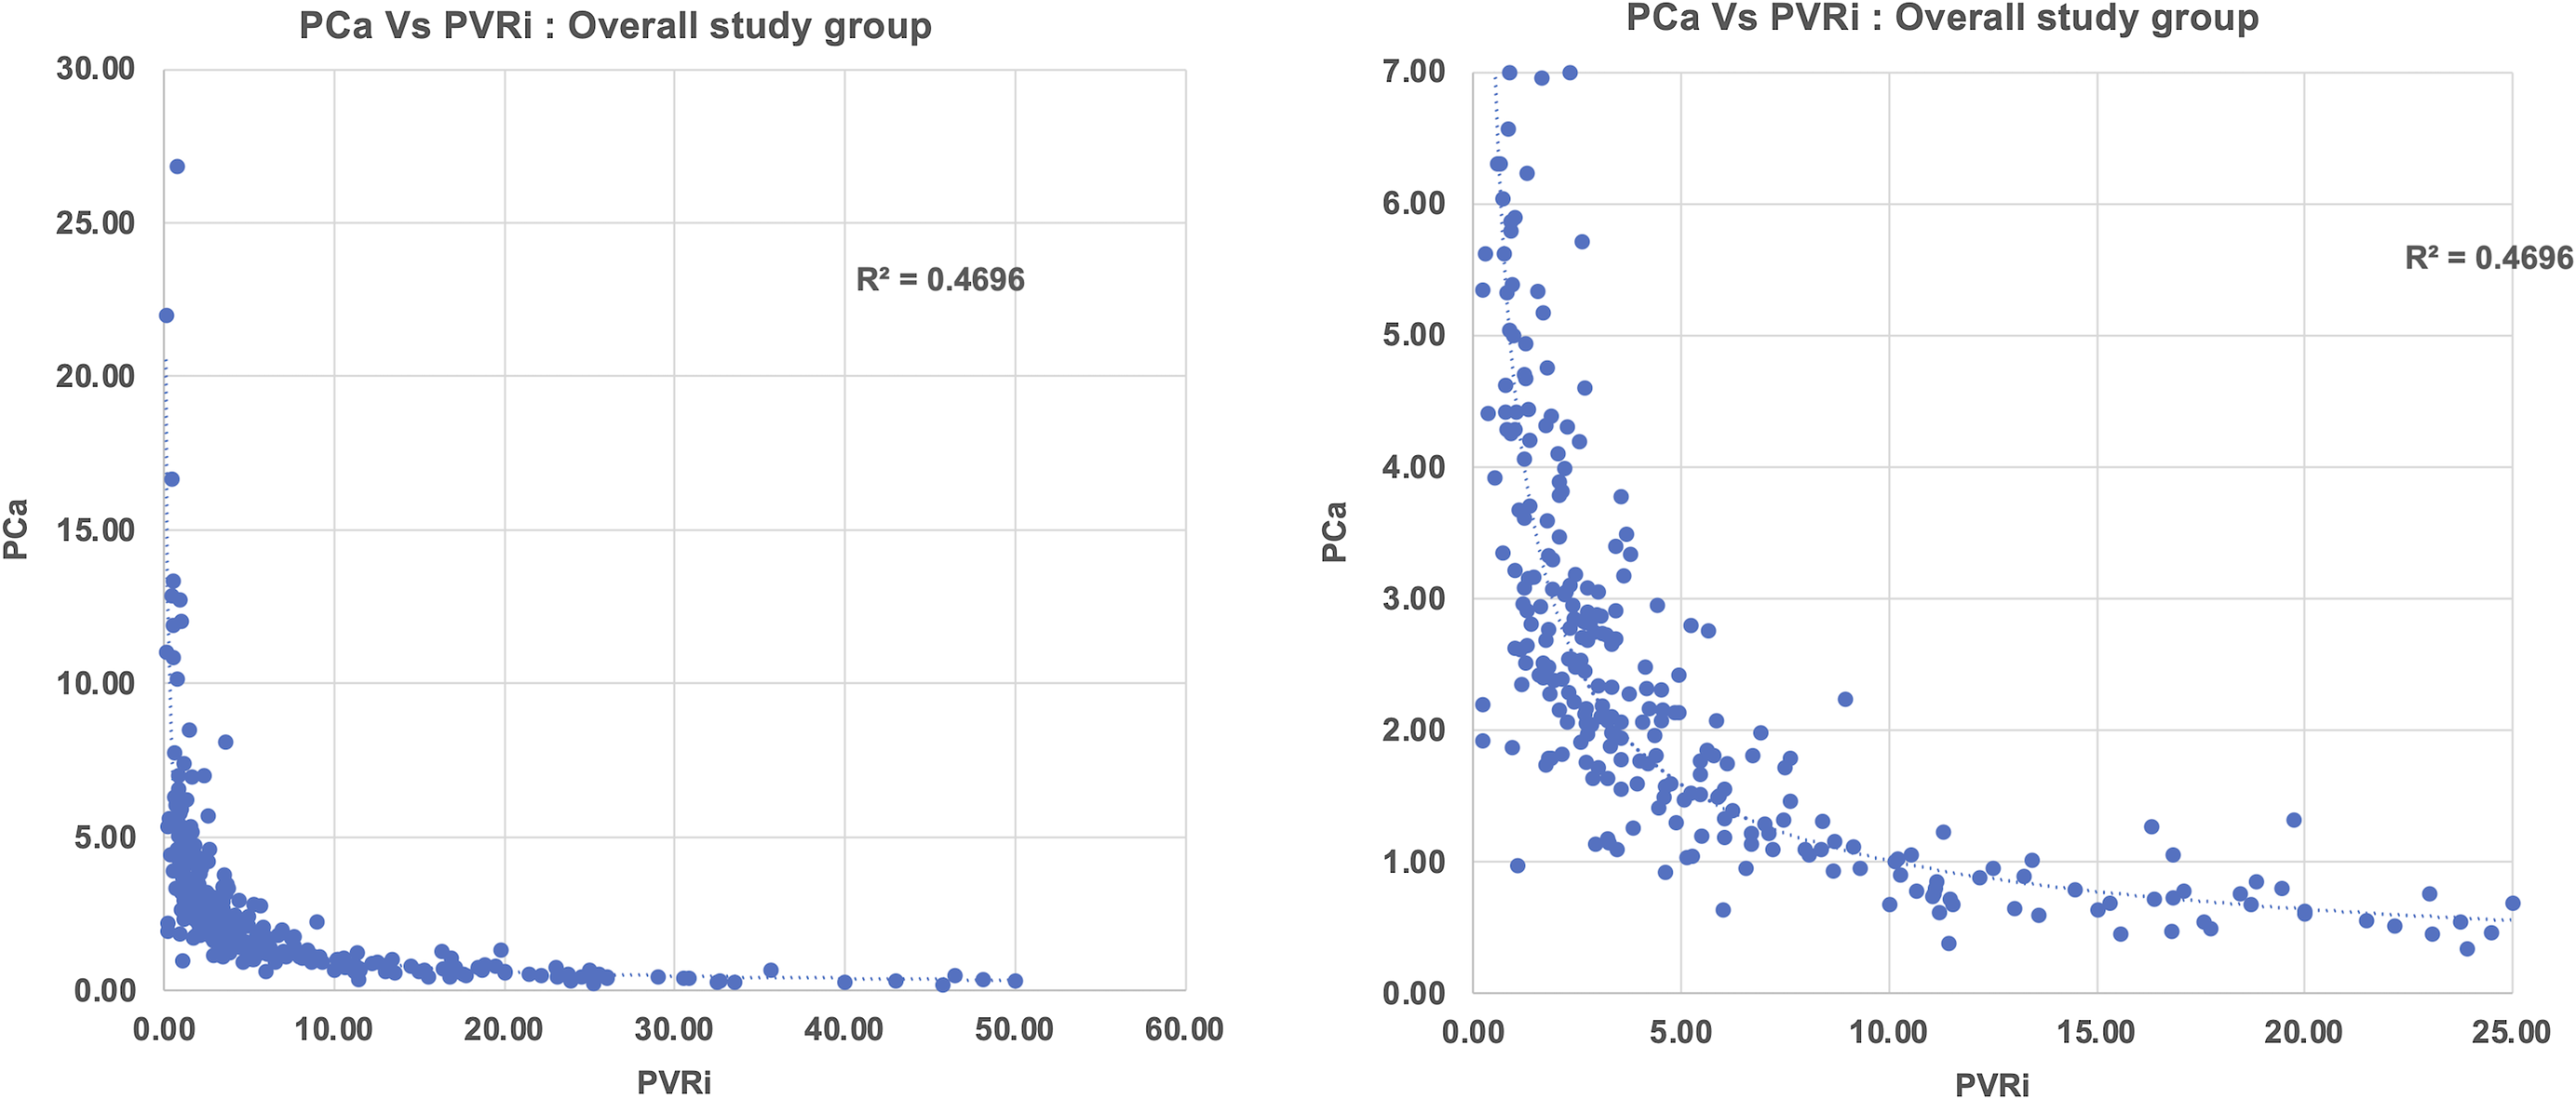
Pulmonary arterial compliance values in the entire study population showed inverse parabolic relation with the pulmonary vascular resistance index values (Power, r2 = 0.66) (Fig 2). For the entire study group, the pulmonary arterial compliance and pulmonary vascular resistance index relationship was maintained across the operability spectrum (Fig 3) (power r2 0.7, 0.8,0.9 for operable, borderline, and inoperable cases).
PCa versus PVRi correlation: all patients.
Relation between PCa and PVRi in operable, borderline, and inoperable cases.
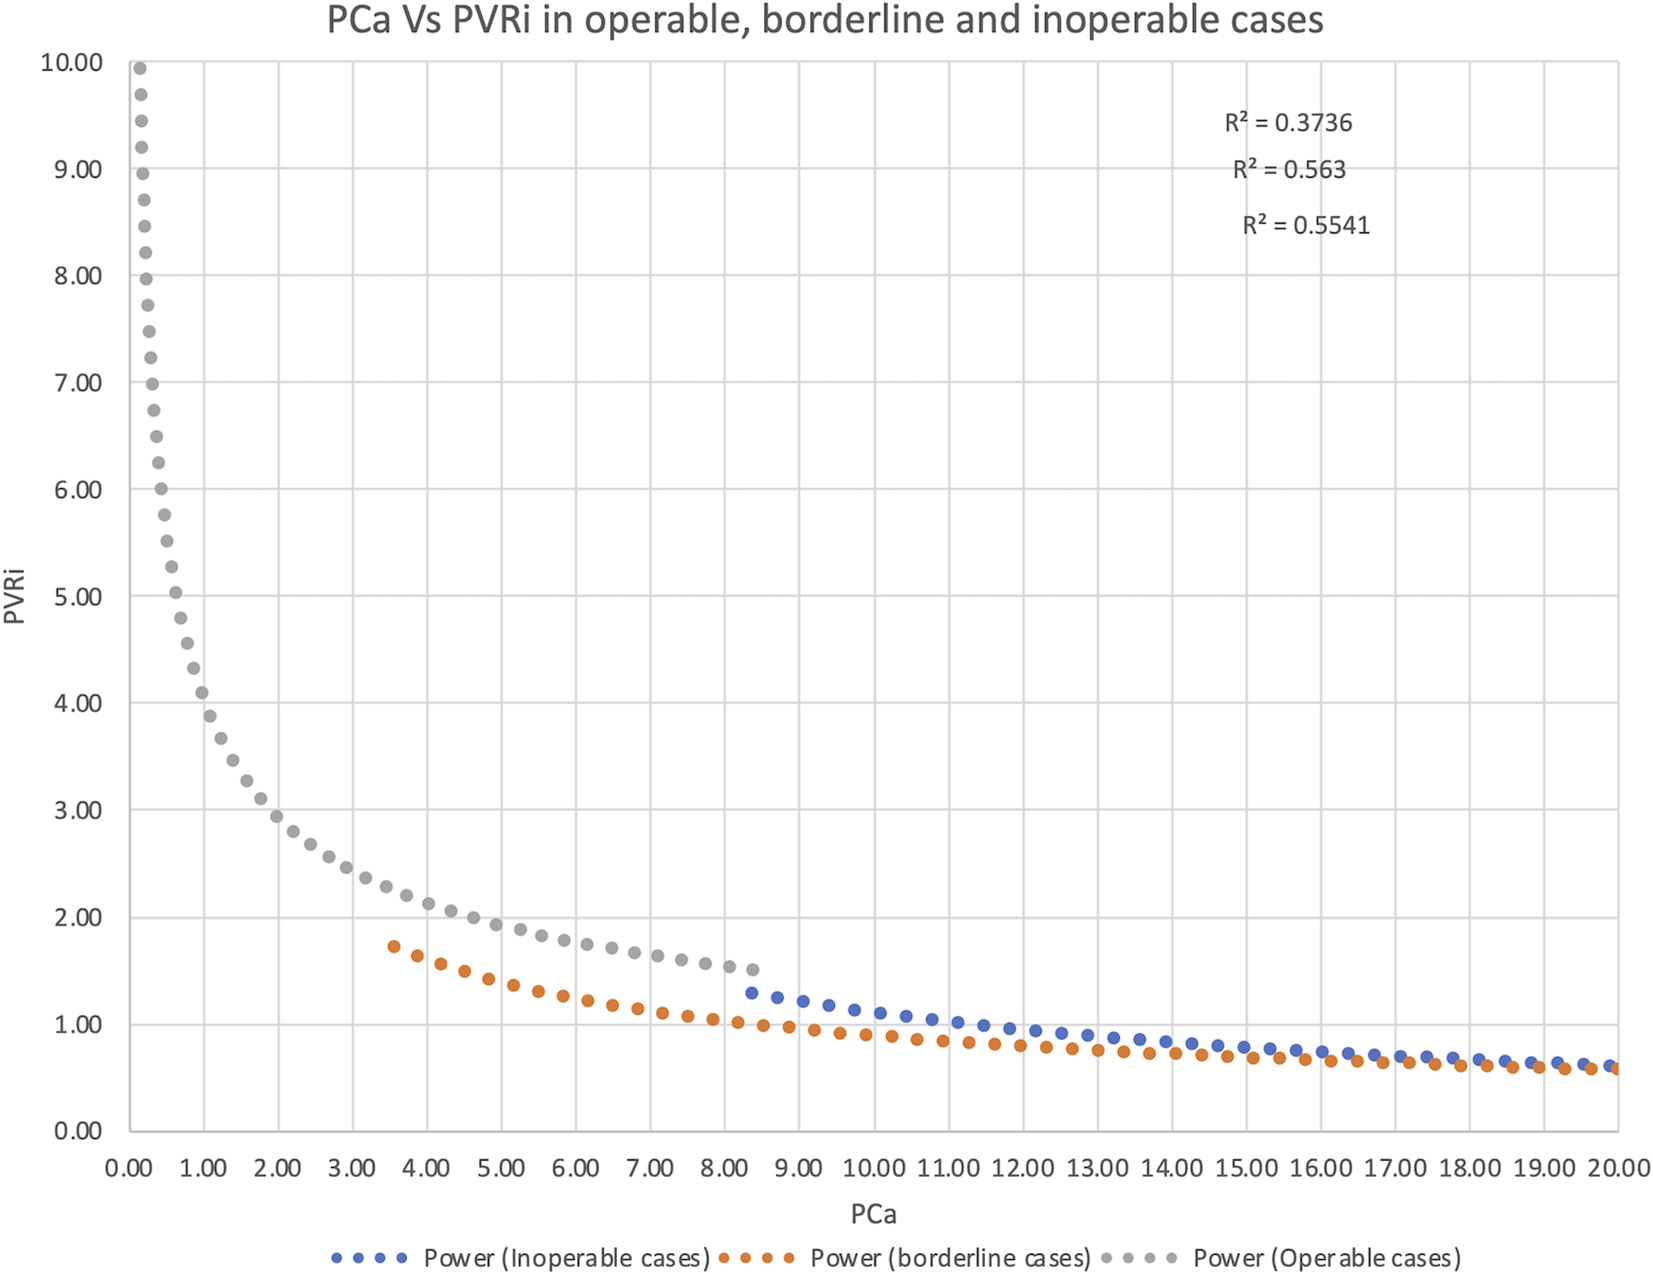
The relationship was also maintained across lesion subtypes, across the operability spectrum (Supplementary Figures 1–3). When plotted against age, the pulmonary arterial compliance pulmonary vascular resistance index relationship curve showed a shift to left at younger age (Supplementary Fig 4).
The pulmonary arterial compliance value started to show a decline in the overall group as well as in individual lesions, with minimal increase in pulmonary vascular resistance index (Fig 2).
Pulmonary arterial compliance and operability
As the median pulmonary arterial compliance value for inoperable patients was significantly lower than the operable patients, both in the overall study population as well as among individual lesions, an receiver operating characteristic analysis was done. A value of pulmonary arterial compliance less than 1.18 ml/mmHg correctly identified inoperable patients with a sensitivity and specificity of 95% (area under the receiver operating characteristic curve 0.99).
Review of borderline patients
Records from the patients classified as patients with borderline operability were reviewed by a team of experienced cardiologists, who classified these patients into “Likely operable” and “Likely inoperable” groups, based on the overall clinical picture and right heart catheterisation. These patients were then classified based on pulmonary arterial compliance alone as operable and inoperable. The calculated coefficient of agreement (kappa) was near zero, signifying no agreement.
RC time
The median RC time for the entire study population was 0.47 S (IQR 0.30). RC time in operable patients was significantly lower than the inoperable patients (Median 0.40 IQR 0.23 in operable, 0.73 0.25 in inoperable patients, p < 0.01).
Discussion
The pulmonary circulation, despite being the focus of investigations for CHD-associated pulmonary hypertension for a long time, remains an enigma. Pulmonary arterial compliance, a marker of elastic properties of pulmonary circulation and an indicator of the pulsatile load of the pulmonary circulation, Reference Saouti, Westerhof, Postmus and Vonk-Noordegraaf17 represents an important part of the right ventricular afterload. Reference Tedford18 There is a surprising scarcity of data on pulmonary arterial compliance in patients with congenital left to right shunt lesions despite it is obvious physiological importance. While ideal measurement of pulmonary arterial compliance may be difficult, Reference Vanden Eynden, Bové, Chirade, Van Nooten and Segers19 the method used in this study is easily available to the clinicians. Earlier studies have documented pulmonary arterial compliance to be a function of pulmonary flow. The values of pulmonary arterial compliance for children with shunt lesions but no pulmonary hypertension, as obtained in our study are higher than that reported in normal children, Reference Basnet, Awa, Hishi and Yanagisawa5 probably owing to the higher pulmonary to systemic blood flow ratio in our study patients. Very recently, a study of pulmonary artery compliance in children with shunt lesions and normal pulmonary vascular resistance index reported pulmonary arterial compliance values ranging from 2.44–3.88 mmHg/ml/m2, similar to the values found in children with normal pulmonary artery pressures in our study. Reference Iwaya, Muneuchi, Sugitani and Watanabe20
Our study found significantly lower pulmonary arterial compliance in inoperable patients across lesion subtypes. With a more advanced pulmonary vascular disease, right ventricular afterload increases. While a part of it is obviously due to an increase in pulmonary vascular resistance index, stiffer pulmonary arteries also increase the right ventricular afterload, just as stiffening of aorta with ageing increase the left ventricular afterload. Reference Randall, van den Bos and Westerhof21 Assessment of pulmonary arterial compliance along with pulmonary vascular resistance index thus may yield a better overall picture of the right ventricular afterload.
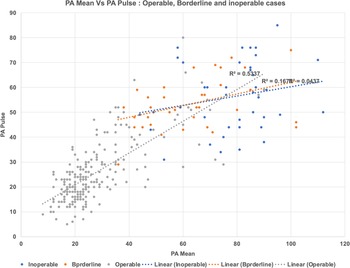
Pulmonary arterial compliance has been linked to a more advanced disease state and prognosis Reference Galiè, Channick and Frantz22 earlier, but the relation to operability has not been studied. Among haemodynamic parameters, operability assessment is generally based on the pulmonary vascular resistance index measurements only, and since the formulae used to calculate pulmonary arterial compliance and pulmonary vascular resistance index share many parameters, it might seem that the pulmonary arterial compliance and pulmonary vascular resistance index are mathematically measuring the same thing. However, two variables that are different between the formulae are the heart rate (instead of Qpi) and the pulse pressure instead of mean pulmonary artery pressure. As can be seen from Figure 4, the relationship between pulse pressure and mean pressure does not always remain constant, and therefore, pulmonary arterial compliance and pulmonary vascular resistance index might potentially yield different dimensions. That such is indeed the case has been documented in patients with thromboembolic pulmonary hypertension, Reference Palecek, Jansa and Ambroz23 and also in patients with raised Left atrial pressures. Reference Kussmaul, Altschuler, Matthai and Laskey24,Reference Dragu, Rispler and Habib25 Further, heart rate variation may alter the relationship between pulmonary vascular resistance index and pulmonary arterial compliance. Heart rate has been shown to be of prognostic importance in patients with idiopathic pulmonary arterial hypertension. Reference Mahapatra, Nishimura, Sorajja, Cha and McGoon26 Obviously, heart rate might vary due to multiple reasons, but the importance of heart rate measurement in clinical approach to pulmonary arterial hypertension in shunt lesions has not been considered. Thus, pulmonary arterial compliance and pulmonary vascular resistance index are complementary and not necessarily identical measures.
Relation between PA mean and PA pulse pressure in study patients.

Whether the change in compliance can occur in the early stages of rising pulmonary vascular resistance index is not clear, but the idea is provocative. On the pulmonary arterial compliance-pulmonary vascular resistance index correlation curve (Fig 2), Pulmonary arterial compliance shows an earlier decline. Pulmonary arterial compliance values fall significantly when the pulmonary vascular resistance index is higher than normal, but still in “operable range.” Though we did not study patients temporally, but if an initial rise of pulmonary vascular resistance index is taken as an early event, we can infer from the correlation curve that significant pulmonary arterial compliance fall in patients with a left to right shunt may allow early diagnosis of pulmonary vascular disease. Other studies on patients with pulmonary arterial hypertension have documented a similar inference. Reference Saouti, Westerhof, Postmus and Vonk-Noordegraaf17 Systematically conducted prospective studies may provide a better insight into this hypothesis.
The product of pulmonary vascular resistance index and pulmonary arterial compliance (RC time) has been argued both as constant, Reference Reuben6 and not constant, Reference Tedford18,Reference Naeije and Delcroix27 in the literature based on theoretic assumptions. We found varying RC time in operable and inoperable patients. This also supports our contention that the study of pulmonary arterial compliance in patients with shunt lesion may provide additional information, in addition to the conventional measures of pulmonary vascular resistance index.
Unfortunately, the study of pulmonary arterial compliance did not improve our decision-making in borderline cases. There is too much empiricism involved in decision-making in shunt lesions in borderline cases at older ages: and in the absence of long-term data, we can only draw limited inference from this. However, it seems that study of pulmonary arterial compliance in shunt lesions may add to our understanding of pulmonary circulation. Further prospective studies seem warranted.
Limitations
The major limitations of our study are that it is a retrospective analysis of records of a number of patients who have undergone catheterisation with a shunt lesion for diagnostic and/or therapeutic purpose. The quality of data may not be as good as that of a prospective study. Oxygen consumption was assumed in all these patients, and in patients where pulmonary artery wedge pressure was not measured, left ventricular end-diastolic pressure was presumed to be equal to mean pulmonary artery wedge pressure. However, the significant number of patients of varying ages, and different levels of pulmonary vascular resistance index make the analysis relevant to patients with shunt lesions. Our analysis of operability in borderline cases and its relation to pulmonary arterial compliance is empirical. To the best of our knowledge, our study is the first one addressing the role of pulmonary arterial compliance in operability assessment of patients with shunt lesions and increased pulmonary blood flow.
Conclusions
This study shows that median pulmonary arterial compliance in patients with shunt lesions and normal pulmonary artery pressures is 4.1 ml/mmHg (IQR 3.2). Pulmonary arterial compliance of 1.18 mmHg or less, etc., indicated inoperability. In this patient population, the RC time was not constant. This study has raised the possibility that an analysis of pulmonary arterial compliance in patients with shunt lesions might provide additional clinically meaningful data. Further studies seem warranted.
Supplementary material
To view supplementary material for this article, please visit https://doi.org/10.1017/S1047951122003341
Acknowledgements
None.
Financial support
This research received no specific grant from any funding agency, commercial or not-for-profit sectors.
Conflicts of Interest
None.