Despite the recent rise of inflation in the United States and other western developed countries, it appears that persistently low real interest rates are likely to characterize the global economy for some time to come. For instance, governments in many European nations can now borrow at negative real rates for as far out as 50 years (Lewin, Reference Lewin2016; Zeng, Reference Zeng2017). The current paper asks how a long-term low return environment will alter household economic behaviors including work and saving patterns, social security benefit claiming ages, and retirement decumulation.
Our analysis is informed by previous research examining how rational decision makers are influenced by shocks or unanticipated surprises in the environments they confront. For instance, the influential work of Gomes and Michaelides (Reference Gomes and Michaelides2005) and Cocco et al. (Reference Cocco, Gomes and Maenhout2015) was extended by Love (Reference Love2010) and Hubener et al. (Reference Hubener, Maurer and Mitchell2016), who showed how marriage, divorce, and widowhood as well as the arrival of children can influence optimal consumption, insurance, asset allocation, and retirement patterns. Love (Reference Love2007) and Gomes et al. (Reference Gomes, Michaelides and Polkovnichenko2009) developed a lifecycle model which includes tax-deferred 401(k) retirement accounts. Horneff et al. (Reference Horneff, Maurer, Mitchell and Rogalla2015) reported how capital market surprises alter saving and investment choices. Chai et al. (Reference Chai, Horneff, Maurer and Mitchell2011) and Gomes et al. (Reference Gomes, Kotlikoff and Viceira2008) explained how labor market adjustments and endogenous claiming of social security benefits can help workers manage earnings and capital market risk in a life cycle setting. Horneff et al. (Reference Horneff, Maurer, Mitchell, Clark, Maurer and Mitchell2018) illustrated how the overall population would change behavior in response to low expected returns.
In what follows, we build and calibrate a life cycle model incorporating population heterogeneity that embeds stock market and labor market uncertainty, stochastic mortality, US tax rules and minimum distribution requirements for 401(k) plans, and real-world social security benefit formulas. This calibrated lifecycle dynamic model produces realistic baseline results that agree with observed saving, work, and claiming age patterns of US households. Next, we simulate anticipated changes in behavior given low real expected returns and compare outcomes with the baseline results. Our particular interest is to show how persistently low returns will alter behavior across a heterogeneous population. For instance, both men and women work longer and claim social security benefits about a year later, and the response is most pronounced for the college-educated.
Additionally, wealthier persons are more sensitive to changes in real returns so they reduce saving in their tax-qualified retirement accounts the most. Accordingly, wealth inequality will be attenuated in a low expected return world. We also explore how results vary given a ‘Japanese’ style economy with low expected returns and low equity risk premia, and we separately examine how results differ if an age-based investment glide path similar to Target Date funds were to be imposed. Our findings are robust to these alternative formulations.
1. The lifecycle model
To illustrate how persistent low returns are likely to influence household behavior in a life cycle setting, we build and calibrate a rational dynamic consumption and portfolio choice model for utility maximizing individuals over the life cycle. Using this, we simulate optimal outcomes in a positive real return environment, which we term the ‘baseline’ setting. Finally, we compare those outcomes with results in a zero return world.
1.1 Preferences
Working in discrete time, we posit that the individual's decision period starts at t = 1 (age of 25) and ends at T = 76 (age 100); accordingly, each period corresponds to 1 year. People have uncertain lifetimes, where the probability of surviving from year t to t + 1 is denoted by p t. We represent preferences in each period by the Cobb Douglas utility function  $u_t\lpar {C_t,l_t} \rpar = \; ((C_tl_t^\alpha )^{1-\rho} )/(1-\rho )$ which is a function of current consumption C t and leisure time l t (where the latter is normalized as a fraction of total available time). The parameter α measures leisure preferences, ρ denotes relative risk aversion, and β is the individual's time preference factor. The value function is derived recursively as:
 $$J_t = \displaystyle{{{(C_tl_t^\alpha )}^{1-\rho}} \over {1-\rho}} + \beta E_t(\,p_tJ_{t + 1}{\rm \;} ){\rm \;}, $$
with terminal utility  $J_T = ((C_Tl_T^\alpha )^{1-\rho} )/(1-\rho )$ and l t = 1 after retirement. Survival rates p t in the value function are taken from US Population Life Tables (Arias, Reference Arias2010). As discussed later, we calibrate the preference parameters in such a way that our results match empirical claiming rates reported by the US Social Security Administration (2015) as well as actual wealth profiles invested in retirement plans.
1.2. Labor income, work patterns, and social security retirement benefits
Our model quite realistically allows individuals to select flexible work effort patterns and a retirement age: specifically, a worker can allocate up to (1 − l t) = 0.6 of his available time budget to paid work (assuming 100 waking hours per week and 52 weeks per year). Depending on his work effort, his uncertain yearly pre-tax labor income is:
 $$Y_{t + 1} = (1-l_t)\cdot w_t\cdot P_{t + 1}\cdot U_{t + 1}.$$
Here, w t is a deterministic wage rate component that depends on age, education, and sex, and whether the individual works overtime, full-time, or part-time. The variable P t+1 = P t · N t+1 represents the permanent component of the wage rate with independent log-normally distributed shocks  $N_t \sim {\rm LN}(-0.5\sigma _{\rm P}^2, \sigma_{\rm P}^2)$ having a mean of one and volatility of
 $\sigma _{\rm P}^2 $. In addition,
 $U_t \sim {\rm LN}(-0.5\sigma _{\rm U}^2, \sigma _{\rm U}^2 )$ is a transitory shock assumed to be uncorrelated with N t and with volatility
 $\sigma _{\rm U}^2 $. This wage rate calibration follows Horneff et al. (Reference Horneff, Maurer and Mitchell2016) who estimated the deterministic component of the wage rate process
 $w_t^i $ and the variances of the permanent and transitory wage shocks
 $N_t^i $ and
 $U_t^i $ using the 1975–2013 waves of the Panel Study of Income Dynamics (PSID).Footnote 1 These are estimated separately by sex and educational level, where the latter is identified as less than High School, High School graduate, or at least some college (<HS, HS, Coll+).Footnote 2
In the US, a worker may decide to claim social security benefits between the ages of 62 and 70, where the benefit paid depends on his average lifetime 35 best years of indexed earnings. If the individual claims benefits prior to (after) the system-defined Normal Retirement Age, his lifelong social security benefits are reduced (increased) according to a pre-specified set of factors. If he delays claiming beyond age 62, the model requires that he devote at least 1 hour per week on work; also, overtime work is excluded (i.e., 0.01⩽(1 − l t)⩽0.4).
1.3. Constraints during the work life
During his work life, an individual may use his cash on hand for consumption or for investments. Some portion A t of the worker's pre-tax salary Y t can be invested in a tax-qualified 401(k)-retirement plan (up to a limit of $18,000, and from age 50 onward, an additional $6,000 catch up contributions is allowed).Footnote 3 Specifically, the plan is of the of the deferred taxation type such that contributions to the account and investment earnings are tax-exempt, while withdrawals are taxed. In addition, the worker may invest outside his retirement plan in risky stocks S t and riskless bonds B t. As such, his cash on hand X t in each year is given by:
 $$X_t = C_t + S_t + B_t + A_t,$$
where the usual constraints apply (i.e., C t, A t, S t, B t⩾0). One year later, his cash on hand is given by the value of stocks (bonds) having earned an uncertain (riskless) gross return of R t+1 (R f), plus income from work (after housing expenses h t), plus withdrawals (W t) from the 401(k) plan, minus any federal/state/city taxes and social security contributions (Taxt+1):
 $$X_{t + 1} = S_tR_{t + 1} + B_tR_f + Y_{t + 1}(1-h_t) + W_t-Tax_{t + 1}. $$
During his work life, the individual pays taxes (Taxt+1) which reduce his cash on hand available for consumption and investments. Our model builds these in using a realistic payroll tax rate of 11.65% (1.45% for Medicare, 4% city and state taxes, and 6.2% for social security taxes). Additionally, under the US tax system, individuals must also pay progressive taxes on labor income and on withdrawals from tax-qualified retirement plans (including a 10% penalty tax for withdrawals before age 60), and on returns on stocks and bonds held outside tax-qualified retirement accounts.Footnote 4 If an individual's cash on hand falls below  $X_{t + 1}{\rm \les} \$ 5,\!879$ p.a. (an amount also exempt from income taxes), we posit that he will receive subsistence support from the government at a minimum level of
 $\$ 5,\!879$ for the next year.
Prior to the endogenous retirement age t = K, assets in the worker's tax-qualified retirement plan are invested in bonds earning a risk-free gross (pre-tax) return of R f, and risky stocks paying an uncertain gross return of R t. Each year, the individual decides on the relative exposure of his retirement assets in stocks  $\omega _t^s $ and
 $(1-\omega _t^s )$ in bonds. The total value
 $(F_{t + 1}^{401\lpar {\rm k} \rpar } )$ of his 401(k) assets at time t + 1 is determined by the previous period's value minus withdrawals
 $(W_t{\rm \les} F_t^{401({\rm k})} )$, plus additional employee contributions (A t), plus matching contributions (if any) from the employer (M t), and nontaxed returns from stocks and bonds:
 $$\eqalign{ & F_{t + 1}^{401\lpar {\rm k} \rpar } = \omega _t^s (F_t^{401\lpar {\rm k} \rpar } -W_t + \; A_t + M_t)R_{t + 1} + (1-\omega _t^s )(F_t^{401\lpar {\rm k} \rpar } -W_t + \; A_t + M_t)R_f,\; \cr & \qquad {\rm \;\ for}\,\; t \lt \; K.{\rm \;}}$$
Subject to complex matching limits imposed by the Internal Revenue Code, employer matches are often feasible in the retirement accounts. Here we assume that the employer matches 100% of employee contributions up to 5% of the employee's yearly salary (but, as per US law, not exceeding $265,000 in compensation or a maximum of $13,250 per year).Footnote 5 Accordingly, the employer matching contribution is given by:
 $$M_t = \min \,(A_t,{\rm min}\,{\rm (}0.05A_t,13,250{\rm )}).$$
1.4. Wealth dynamics after claiming
As per US social security rules, the worker may claim social security benefits between age 62 and 70. The social security benefit formula uses the 35 best years of income converted into an annual Primary Insurance Amount (PIA) (or the unreduced social security benefit) using a redistributive formula.Footnote 6 Also by law, a retiree's Required Minimum Distribution (RMD) amounts from his tax-qualified 401(k) account are set in accordance with the IRS Uniform Lifetime Table measures (IRS 2012a, 2012b). Federal income taxes are calculated based on the individual's taxable income, the six (progressive) income tax brackets and the corresponding marginal tax rates for each tax bracket (Horneff et al., Reference Horneff, Maurer, Mitchell and Rogalla2015).
After retirement at the endogenous age K, the individual has the opportunity to save outside the tax-qualified retirement plan in stocks and bonds:
 $$X_t = C_t + S_t + B_t.$$
We model housing costs h t as in Love (Reference Love2010). Accordingly, cash on hand for the next period evolves as follows:
 $$X_{t + 1} = S_tR_{t + 1} + B_tR_f + Y_{t + 1}(1-h_t) + W_t-{\rm Ta}{\rm x}_{t + 1}.\; \; $$
Social security old age retirement benefits are determined by the individual's PIA, which is determined by his 35 best years of earnings and his claiming age.Footnote 7 Social security payments (Y t+1) in retirement (t ≥ K) are given by:
 $$Y_{t + 1} = {\rm PIA}_K \cdot \lambda_K\cdot \varepsilon_{t + 1}.$$
Here, λ K is the adjustment factor for claiming prior to or after the government-set Normal Retirement Age, which in this exercise is set at age 66.Footnote 8 The variable εt is a transitory shock  $\varepsilon_t \sim {\rm LN}(-\!0.5\sigma _\varepsilon ^2, \sigma _\varepsilon ^2)$ reflecting out-of-pocket medical and other expenditure shocks during retirement (as in Love, Reference Love2010). Benefit payments from social security are partially subject to tax at the individual's federal income tax rate, as well as a 1.45% Medicare and 4% city and state tax.Footnote 9
We model the retiree's 401(k) plan payouts as follows:
 $$F_{t + 1}^{401({\rm k})} = \omega _t^s (F_t^{401({\rm k})} -W_t)R_{t + 1} + (1-\omega _t^s )(F_t^{401({\rm k})} -W_t)R_f,\quad {\rm \;\ for\;} \,t \lt K.{\rm \;} $$
Under US law, plan participants must take retirement account payouts from age 70.5 onward according to the RMD rules (m) specified by the Internal Revenue Service (IRS, 2012b). Accordingly, to avoid substantial penalty taxes (equal to 50% of the shortfall distribution amount) withdrawals from the retirement account, the retiree must take into account the following constraint:  $F_t^{401({\rm k})} m \le W_t \lt \; F_t^{401({\rm k})}. $ All of these rich institutional factors are taken into account in generating our model outcomes.
2. Optimal behavior under the baseline
We first simulate our model under what had been considered to be ‘normal’ interest rate conditions, to illustrate baseline optimal patterns of consumption, saving, work, social security claiming, portfolio allocations outside inside and outside the tax-qualified accounts, and withdrawals from the tax-qualified 401(k) plans. This baseline calibration assumes a risk-free interest rate of 1%, and an expected risk premium on stocks (over the risk-free rate) of 5% with a volatility of 18%. When simulating other return environments, we vary these assumptions and then assess how behavioral outcomes compare.
We posit that households maximize the value function (1) under the budget restrictions given above. Since this optimization problem cannot be solved analytically, we apply a numerical procedure using dynamic stochastic programing. To generate optimal policy functions, in each period t we discretize the space in four dimensions 30(X) × 20(F 401(k)) × 10(P) × 9(K), with X being cash on hand, F 401(k) assets held in the 401(k) retirement plan, P permanent income, and K the claiming age. Next, we simulate 100,000 independent life cycles based on optimal feedback controls for each of the six population subgroups of interest (male/female in three education groups of <HS/HS/Coll+). Using weights from the National Center on Education Statistics (2012), we aggregate the subgroups to obtain national mean values. The population is comprised of 50.7% females (of whom 62% have Coll+, 30% have HS, and 8% have <HS education), and 49.3% males (of whom 60% have Coll+, 30% have HS, and 10% <HS education).
2.1 Baseline results
For each of the six subgroups of interest, we select a unique set of values of the preference parameters so the model produces national 401(k) wealth profiles and social security claiming patterns compatible with historical evidence. After solving the model several times, we find that a coefficient of relative risk aversion ρ of 5, a time discount rate β of 0.96 and a leisure preference parameter of α = 0.9 are the parameters that closely match simulated model outcomes to empirical evidence.Footnote 10
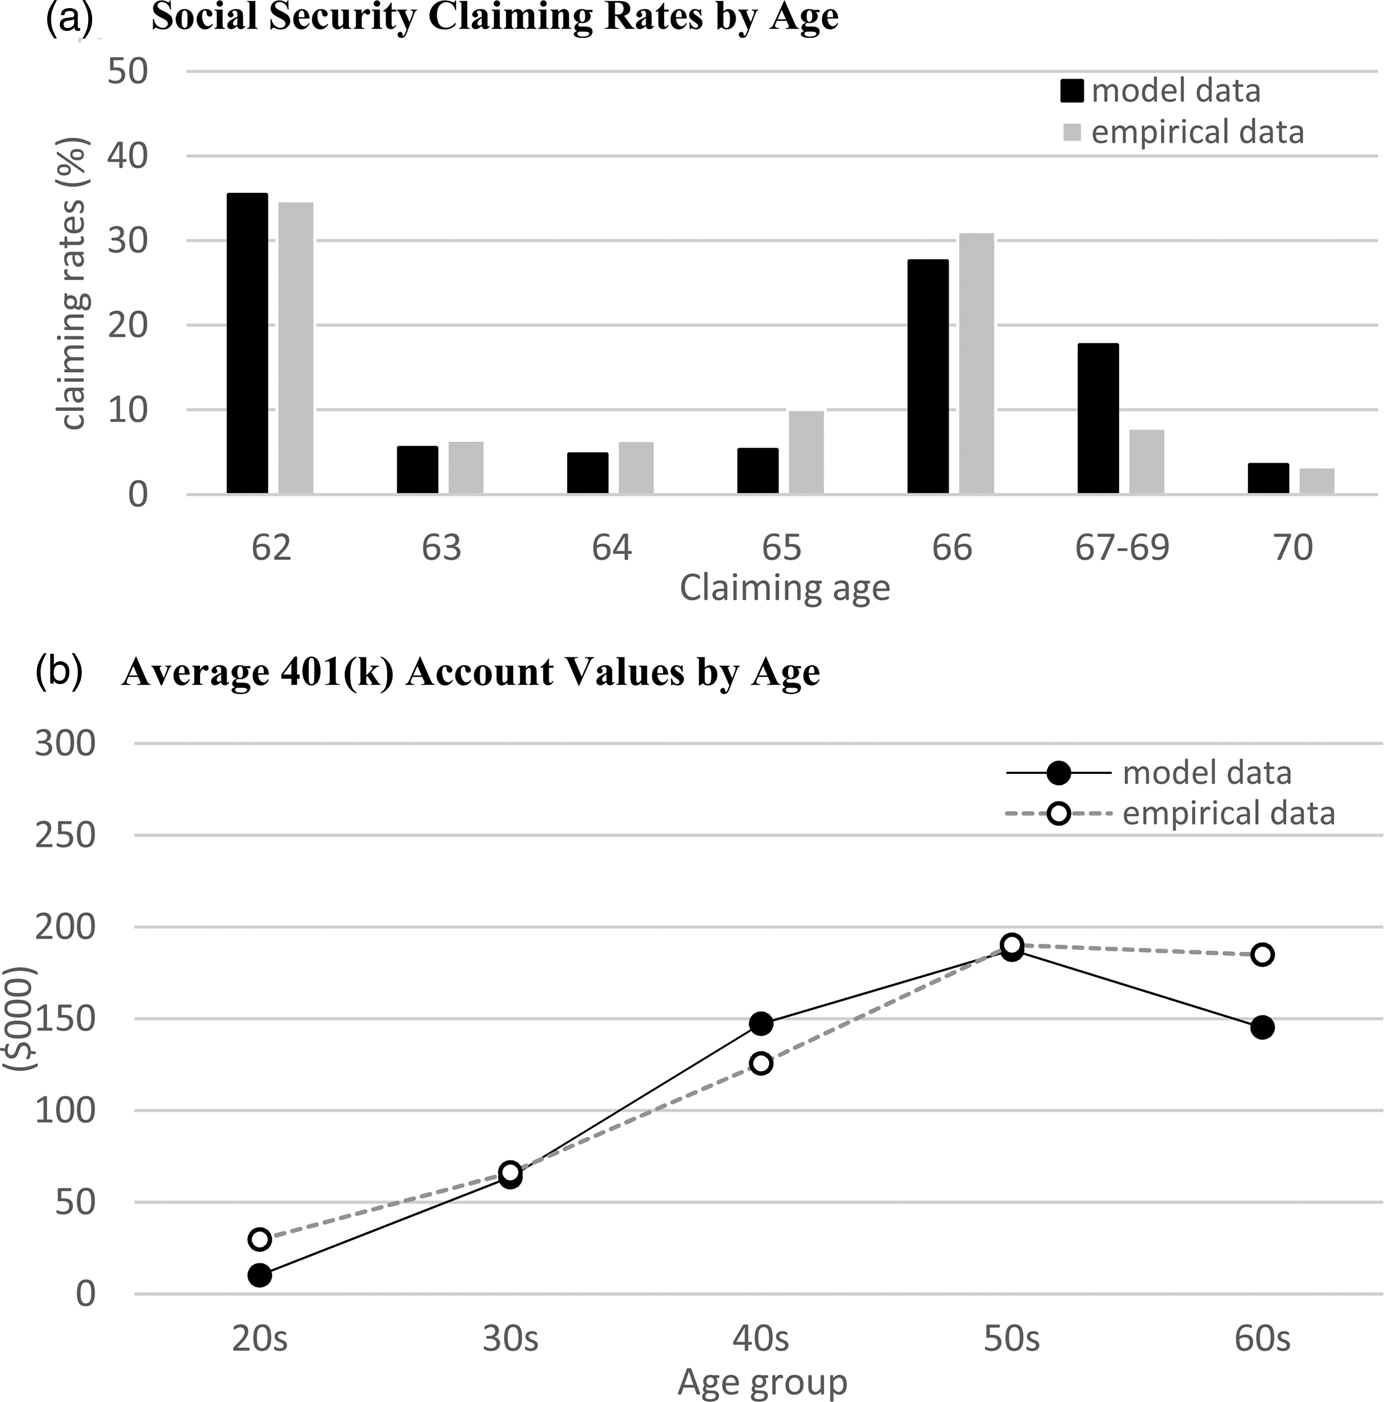
This is evident from panel A of Figure 1 which indicates that the social security claiming patterns generated by our baseline model align well with empirical claiming rates reported by the US Social Security Administration (2015).Footnote 11 In particular, the model produces a substantial peak at the earliest claiming age of 62, mirroring the data where around 45% of workers claim benefits at that early age. Also in line with the evidence, a smaller second peak can be seen at the (system-defined) Full Retirement Age of 66, where about 15% of workers claim benefits for the first time.
Social security claiming patterns and 401(k) account values in a ‘Normal’ return environment: model versus data. (A) Social security claiming rates by age. (B) Average 401(k) account values by age. Notes: Panel A compares endogenous social security claiming rates at ages 62–70 generated by our life cycle model versus retirement (and disability) empirical claiming rates by age from Social Security Administration (2015). Expected values are calculated from 100,000 simulated lifecycles based on optimal feedback controls for each of the six subgroups of interest. Results for the female (male) population use income by education levels for men (62% Coll+; 30% HS; 8% <HS) and women (60% Coll+; 30% HS; 10% <HS). Baseline calibration parameters are: risk aversion ρ = 5; time preference β = 0.96; and leisure preference α = 0.9. Social security benefits are based on average permanent incomes and the 2013 value of bendpoints; minimum required withdrawals from 401(k) plans are based on life expectancy using the IRS-Uniform Lifetime Table in 2013; tax rules for 401(k) plans are as in Horneff et al. (Reference Horneff, Maurer, Mitchell and Rogalla2015). The risk premium for stock returns is 5% and return volatility 18%; the risk-free rate in the baseline is 1%. Panel B compares simulated 401(k) account balances by age (averages for ages 20–29, 30–39, 40–49, 50–59, and 60–69) with empirical data from EBRI (2017). Source: Authors’ calculations.

In addition, our model closely tracks EBRI (2017) data on average 401(k) account balances (in year 2015) for 7.5 million plan participants in five age groups (20–29, 30–39, 40–49, 50–59, and 60–69). Panel B of Figure 1 compares our simulated and the empirical data for the five age groups, and it reveals that our simulated outcomes are remarkably close to the empirically observed 401(k) account values.Footnote 12
Overall, then, our model generates results that agree closely with observed saving and social security claiming behavior of US households during what we call the ‘baseline’ economic environment, before the advent of persistent low expected returns.
3. How persistent low returns will drive behavioral change
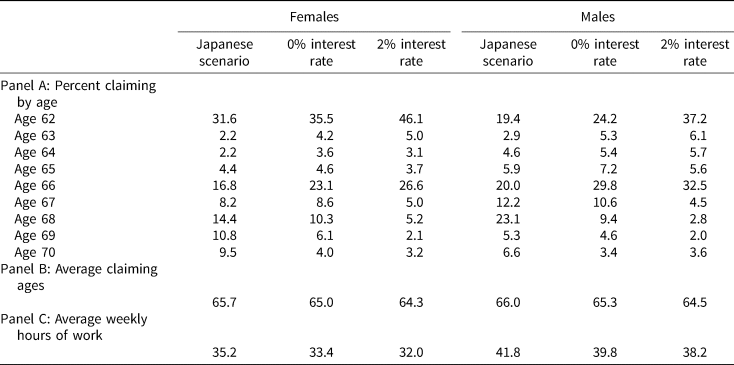
To determine how optimal economic behavior would differ in alternative interest rate environments, we compare outcomes for real risk-free interest rates of 0% and 2%, with a particular focus on the lowest and the highest expected return: in this case, the equity risk premium remains at 5% as in the baseline scenario. In addition, we analyze a situation a real risk-free 0% interest rate and an equity risk premium of only 2%. The latter scenario is comparable with the capital market situation characterizing Japan over the past 30 years. Table 1 shows how social security claiming patterns would respond by gender and age, average claiming ages, and average hours of work.
Optimal social security claiming ages and work hours by gender for different capital market scenarios

Notes: This Table reports claiming ages and weekly hours of work by age and gender, under three interest rate scenarios. Expected values are derived from 100,000 simulated lifecycles using optimal feedback controls in our life cycle model. The risk premium for stock returns is 5% and return volatility 18% in the 0% and 2% interest rate scenario. In the Japanese scenario, the interest rate is 0% and the risk premium for stocks is 2%. Other parameters are as in Figure 1. Source: Authors’ calculations.
A first finding is that optimal social security claiming ages and hours of work increase when the risk-free rate is lower. This is not surprising, inasmuch as individuals earn less on their savings in a 0% environment and hence would need to withdraw more of their assets if they claimed early. Specifically, when the long term interest rate is 0% instead of 2%, average claiming ages rise by about 1 year later and average work hours are 5% higher, for both men and women. Moreover, substantially fewer women and men claim at age 62 in the low-return world: only 35.5% (24.2) of the females (males) do so when the real return is 0%, versus 46.1% (37.2%) at a 2% real return. This supports Shoven and Slavov's (Reference Shoven and Slavov2012) and Cahill, Giandrea, and Quinn's (Reference Cahill, Giandrea, Quinn, George and Ferraro2015) surmise that delayed claiming is more appealing in a low versus a high return environment. In the capital market scenario with a real interest rate of 0% and an equity premium of only 2%, behavior changes even more in the same direction. Men and women claim 1.5 years later on average, compared with the high return case. In addition, during the work life, individuals devote per week more than 3 hours more on the job, compared with the high return case.
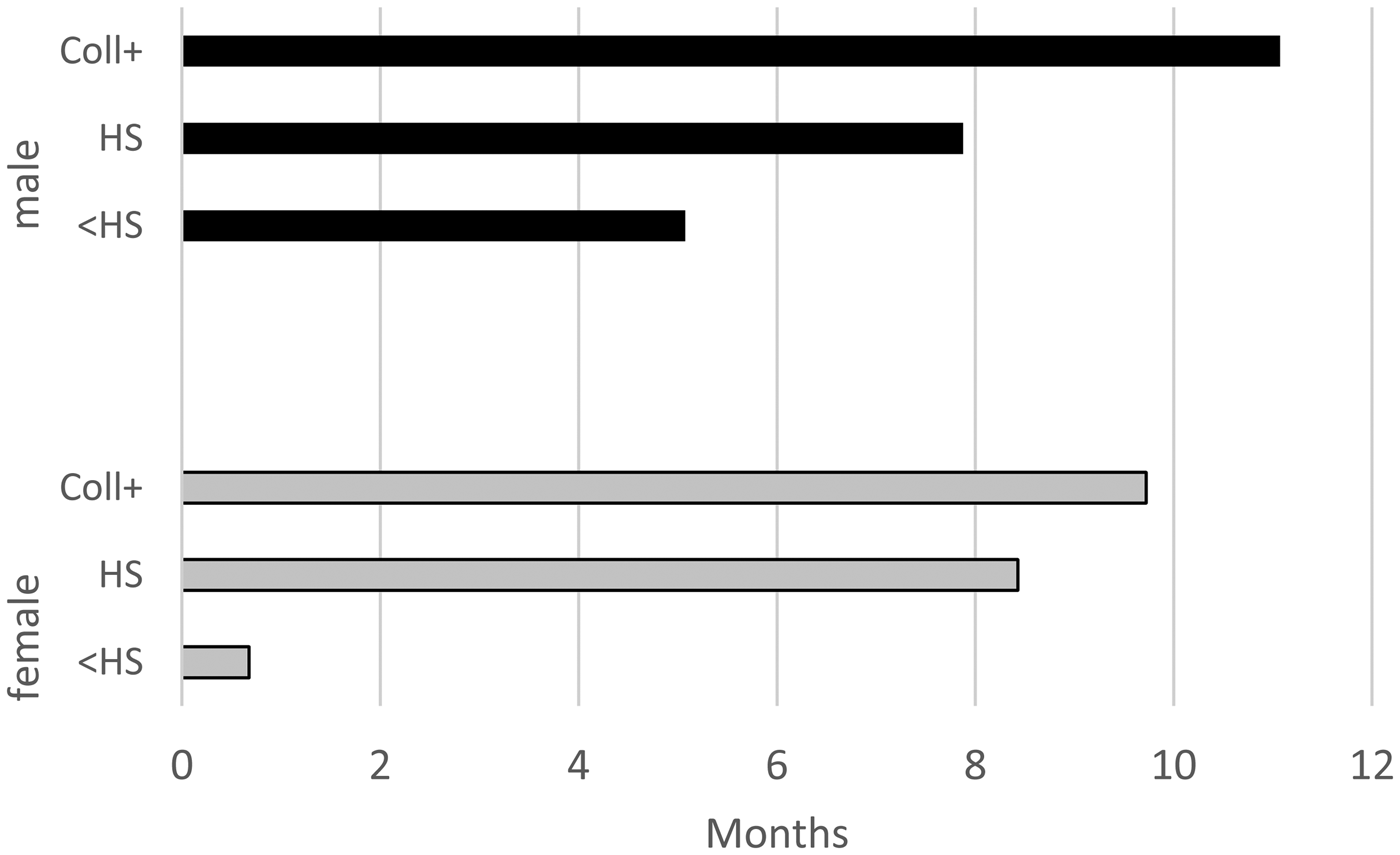
Figure 2 provides additional insight into the heterogeneous impact of low versus high returns. Specifically, the most-educated defer claiming more when returns are 0% versus 2%, and this conclusion applies to both men and women. By contrast, the least-educated (particularly women) change claiming behavior very little.
Average increase in social security claiming ages (in months) by gender and education for expected real interest rates of 0% instead of 2%. Notes: This figure reports the average claiming age difference for an interest rate level of 0% instead of 2%, by sex and three education groups (<HS, HS, Coll+), derived from 100,000 simulated lifecycles using optimal feedback controls in our life cycle model. The assumed risk premium for stock returns is 5% and return volatility 18%. Other parameters are in Figure 1. Source: Authors’ calculations.

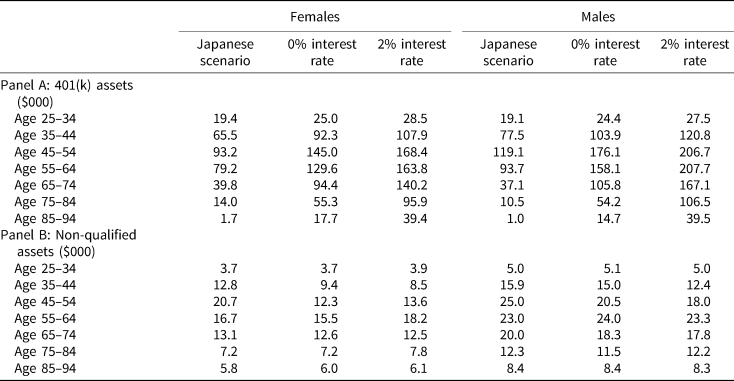
Next, we report how optimal wealth accumulation patterns vary with the interest rate regime, both inside and outside 401(k) plans. Table 2 shows that workers build up far less wealth in their retirement plans in a low versus a higher expected return environment. For instance, if the safe yield is only 0%, middle-aged women (age 45–54) optimally accumulate an average of about $145,000 in their 401(k) plans. By contrast, in the 2% yield scenario, they average 20% more, or $168,400 at the same point in their life cycle. Middle-aged men accumulate $176,100 in the zero-rate environment, and 20% more ($206,700) in the 2% interest rate scenario. In other words, the gain from saving in pretax plans is lower in a low return environment, depressing the tax advantage of saving in 401(k) plans. The table also shows that the impact of a lower interest rate on assets in non-qualified accounts is relatively small. The reason is that such accounts tend to be held for precautionary reasons, to smooth consumption in case of income shocks or capital market shocks.
Optimal lifecycle asset accumulation patterns by gender for different capital market scenarios

Notes: This Table reports expected assets in tax-qualified 401(k) plans and non-qualified assets by age and gender, under three interest rate scenarios. Expected values are derived from 100,000 simulated lifecycles using optimal feedback controls in our life cycle model. The risk premium for stock returns is 5% and return volatility 18%. In the ‘Japanese’ scenario, the interest rate is 0% and the risk premium for stocks is 2%. Other parameters are as in Figure 1. Source: Authors’ calculations.
In the worst-case ‘Japanese’ capital market scenario, middle-aged (age 45–54) men as well as women accumulate 40% less in their tax-qualified retirement accounts compared with the more favorable baseline situation where the interest rate was 2% and the equity risk premium 5%. The ‘Japanese’ economic environment has a larger percentage impact boosting assets held outside retirement accounts, by 53% for middle-aged women and 39% for similar-aged men. Nevertheless, these non-pension accounts remain small compared with the 401(k) asset holdings.
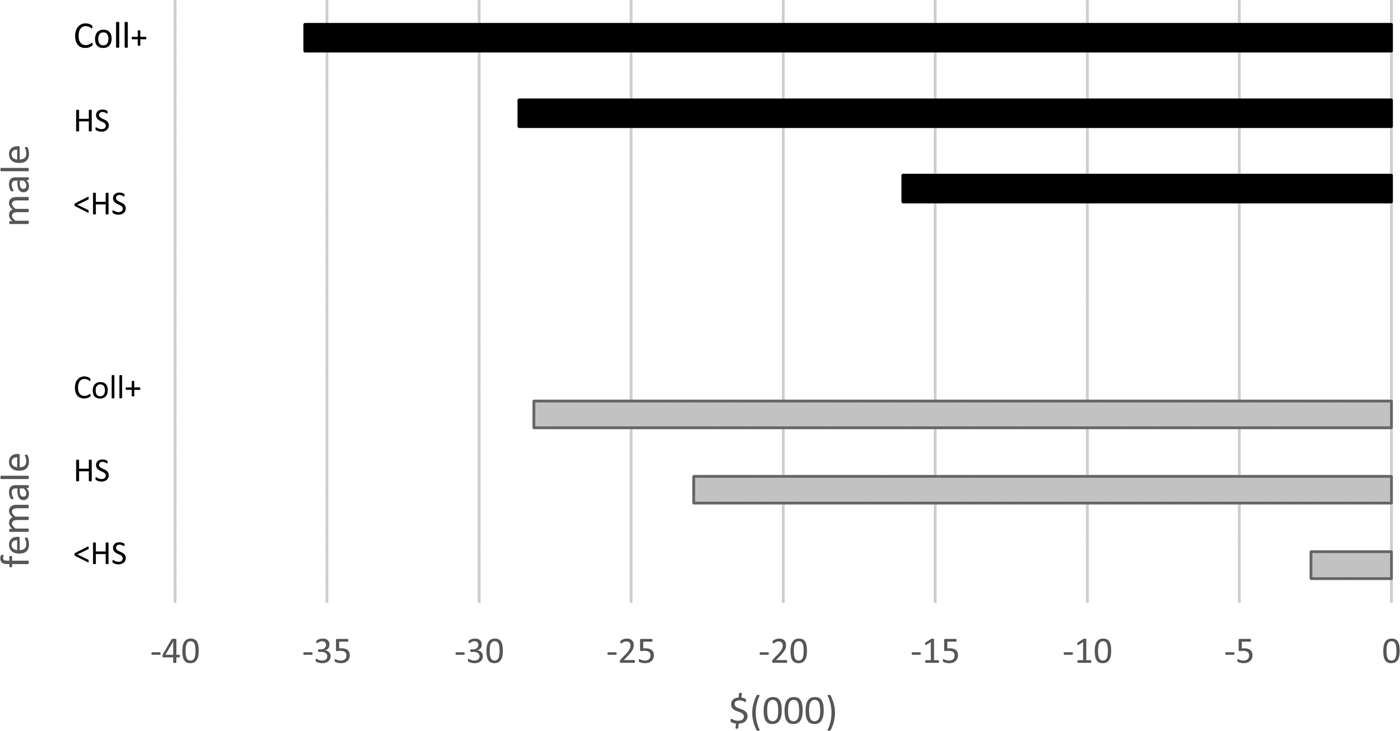
Figure 3 shows how 401(k) asset values diverge by gender and education under the low- versus high-expected return scenarios. When returns are low, the optimal value of tax-qualified retirement savings proves to be substantially smaller for both men and women, and for all three age and education groups. Additionally, saving reductions are most notable for the best-educated individuals. Conversely, in a higher return world, the college-educated save 30–40% more, with 15% less for high-school dropouts. Accordingly, the distribution of wealth is more uniform in times of low real expected returns.
Average decline in 401(k) assets by gender and education for expected real interest rates of 0% instead of 2%. Notes: This figure reports the average difference in 401(k) assets (over the lifecycle) for an interest rate level of 0% instead of 2%, by sex and three education groups (<HS, HS, Coll+), derived from 100,000 simulated lifecycles using optimal feedback controls in our life cycle model. The assumed risk premium for stock returns is 5% and return volatility 18%. Other parameters are as in Figure 1. Source: Authors’ calculations.

Thus far, our analysis has assumed that households optimize their asset allocation inside their 401(k) plans (i.e., the portfolio weights in stocks and bonds are endogenous). Yet a large majority of 401(k) retirement plans today automatically default workers’ contributions into target-date investment strategies that follow an age-based allocation rule, entailing higher equity shares early in life and lower ones nearing and into retirement (Vanguard, 2017). Moreover, the regulatory environment has encouraged this practice, in that the 2006 Pension Protection Act permitted plan sponsors to include Target Date Funds (TDFs) as qualified default investment alternatives in participant-directed plans. Accordingly, we investigate how sensitive our results are to a default 401(k) allocation that follows an age-related portfolio rule; while there are many variants in the market, generally speaking the percentage of 401(k) assets invested in equities follows a (120 − age)/100 rule. This we implement in Table 3.Footnote 13
Impact of endogenous versus target date investments of 401(k) assets on claiming and wealth accumulation: expected real interest rates of 0% instead of 2%

Notes: This Table reports the average difference in 401(k) assets and average difference in social security claiming ages over the lifecycle for an interest rate level of 0% instead of 2% used in the base case. For the row labeled life Target Date, the equity weights of 401(k) assets are determined according to an age-based (120-age)/100 rule. For the row labeled Endogenous, the equity weights in 401(k) assets are derived from optimal feedback controls in the life cycle model. The assumed risk premium for stock returns is 5% and return volatility 18%. Other parameters are as in Figure 1. Source: Authors’ calculations.
To illustrate the key differences in outcomes when the real interest rates drops from 2% to 0%, we report average differences in social security claiming ages (in years) and average percentage differences in 401(k) assets for the two investment strategies. Both females and males claim slightly later if the 401(k) plan were to be invested according to a Target Date (age-based) rule versus using optimal endogenous equity weights. This is accompanied by a larger drop in 401(k) assets for the Target Date portfolio, compared with the endogenous asset allocation case. This is due to the fact that the worker's exposure to bonds is higher under the Target Date approach versus optimal, particularly for older workers and for retirees. This highlights the fact that single factor age-based TDF models that ignore variations in human capital, wealth, and individual preferences like risk aversion, are not fully attuned to individual workers’ needs. Nevertheless these differences are small in magnitude, so we conclude the two investment approaches do not materially change economic behaviors in the context of persistently low interest rates.
4. Conclusions
Over $8 trillion of bonds currently trade at negative rates around the world, compared with none in 2014 (Slok, Reference Slok2018). Despite this new global reality, relatively little research has focused on the profound impacts of persistent low returns on life cycle work, saving, investment, and social security claiming behavior.
Our contribution in this paper is therefore to develop and calibrate a richly detailed life cycle model that enables us to explore the potential impacts of this new economic environment across heterogeneous population subgroups. To this end, we model realistic tax, social security, and minimum distribution rules, as well as uncertain income, stock returns, medical spending, and mortality. We then use this model to assess how key outcomes change. The baseline simulation which assumes a 1% expected real return generates wealth and claiming patterns quite consistent with the evidence, including a peak claiming rate at the earliest feasible age of 62, and asset accumulation patterns comparable with actual data.
By contrast, a zero expected return induces workers to claim social security benefits later and increase work effort. Moreover, people save less, particularly in their tax-qualified accounts, and they draw down their 401(k) assets sooner. Results prove to be similar for men and women, yet the best-educated subgroup optimally changes behavior more, compared with the least-educated. Overall, the changes reduce observed wealth inequality. Sensitivity analyses allowing for age-based investment profiles akin to Target Date funds shows that results are robust. We also compare our results with those generated by a ‘Japanese’ style economy with low expected returns and low equity premia, and again findings are comparable.
We leave for future work a discussion of the potential macroeconomic consequences of reduced saving and earlier claiming patterns. Nevertheless, our life cycle model which embodies richly detailed tax and social security claiming rules is clearly an invaluable tool to help assess how households will react to the ‘new normal’ financial market conditions.
Acknowledgements
The authors are grateful for research support from the German Investment and Asset Management Association (BVI), the SAFE Research Center funded by the State of Hessen and the Pension Research Council/Boettner Center at The Wharton School of the University of Pennsylvania. We also thank the initiative High Performance Computing in Hessen for grating us computing time at the LOEWE-CSC and Lichtenberg Cluster. David Richardson and other participants at the 2018 NBER workshop in Jackson Hole, Wyoming provided helpful comments. Opinions and any errors are solely those of the authors and not of the institutions with which the authors are affiliated, or any individual cited. © 2018 Horneff, Maurer, and Mitchell.
Author ORCIDs
Olivia S. Mitchell 0000-0002-6419-8314