Introduction
In one of the founding works of psychiatric epidemiology, Faris & Dunham (Reference Faris and Dunham1939) observed that individuals admitted to hospitals for drug abuse (DA) in Chicago resided disproportionally in deprived parts of the city. They write that, for DA:
almost 50 per cent of the cases are in the hobo and rooming-house areas at the center of the city … drug addicts come mainly from the zone of transition where it is easier to obtain an in-group solidarity and maintain contacts with other addicts and ‘dope’ peddlers (Faris & Dunham, Reference Faris and Dunham1939, p. 122)
Since this seminal observation, subsequent research has generally verified the association between individual low social class and risk for DA (Warner et al. Reference Warner, Kessler, Hughes, Anthony and Nelson1995; Muntaner et al. Reference Muntaner, Eaton, Diala, Kessler and Sorlie1998; Compton et al. Reference Compton, Thomas, Stinson and Grant2007). We recently showed, in a nationwide Swedish cohort, a robust association in adolescents between a neighborhood-level measure of social deprivation (SD) and subsequent risk for DA (Kendler et al. Reference Kendler, Sundquist, Ohlsson, Palmer, Maes, Winkleby and Sundquist2012).
However, the degree to which this association results from causation (or ‘stress’) versus selection (or ‘drift’) is less clear. In their well-known study of Israelis of European and North African background, Dohrenwend et al. (Reference Dohrenwend, Levav, Shrout, Schwartz, Naveh, Link, Skodol and Stueve1992) concluded that the association of low socio-economic status (SES) and substance use disorders, especially in men, arose largely as a result of ‘social causation’. In the National Epidemiologic Survey on Alcohol and Related Conditions (NESARC), Sareen et al. (Reference Sareen, Afifi, McMillan and Asmundson2011) used a prospective design to show that incident cases of substance use disorders increased following a decline in income.
The attribution of causal relationships between putative risk factors and outcomes that cannot be experimentally manipulated is among the most challenging problems facing epidemiological research. There are two broad approaches to this problem: statistical methods and natural experiments (Rutter Reference Rutter2007a ,Reference Rutter b ). In the current study we used an extension of a natural experiment: the co-twin control design. Traditionally, in this approach, the association between an exposure and an outcome is compared in the general population and in monozygotic (MZ) and dizygotic (DZ) twin pairs discordant for the exposure (Kendler et al. Reference Kendler, Neale, MacLean, Heath, Eaves and Kessler1993). From the pattern of the associations in these three groups, it is possible to assess the degree to which the association observed in the population may be causal versus due to confounding from genetic and/or familial–environmental factors. Co-relative designs have been used to distinguish stress versus drift models for the association between SES and schizophrenia (Goldberg & Morrison, Reference Goldberg and Morrison1963; Turner & Wagenfeld, Reference Turner and Wagenfeld1967).
If the association between low SES and DA is truly causal, the expectation would be that the SES–DA association would be of similar strength in the general population as in relative pairs discordant for their level of SES. However, if the SES–DA association results partly or entirely from familial confounding factors (e.g. poor rearing environment, genetically influenced personality traits), then the association should be weaker or disappear entirely when assessed in discordant twins. This design should be especially robust for DA because of the strength of familial/genetic factors in its etiology (Rounsaville et al. Reference Rounsaville, Kosten, Weissman, Prusoff, Pauls, Anton and Merikangas1991; Tsuang et al. Reference Tsuang, Lyons, Eisen, Goldberg, True, Lin, Meyer, Toomey, Faraone and Eaves1996; Bierut et al. Reference Bierut, Dinwiddie, Begleiter, Crowe, Hesselbrock, Nurnberger, Porjesz, Schuckit and Reich1998; Kendler & Prescott, Reference Kendler and Prescott1998; Merikangas et al. Reference Merikangas, Stolar, Stevens, Goulet, Preisig, Fenton, Zhang, O'Malley and Rounsaville1998; van den Bree et al. Reference van den Bree, Johnson, Neale and Pickens1998).
In this study, we explored the association between neighborhood-level measures of SD and subsequent risk for DA as assessed from medical, legal and pharmacy records in three consecutive nationwide Swedish cohorts. We examined the association in the entire population and then in an expanded set of relatives pairs: first-cousins, paternal and maternal half-siblings, full siblings and MZ twins discordant for their level of SD. Our aim was to gain insights into the nature of the SD–DA relationship and the degree to which it might be causal (i.e. SD→DA) versus a result of familial confounding factors.
Method
Our study used linked data from multiple Swedish nationwide registries. Linkage was achieved through the unique individual Swedish 10-digit personal identification (ID) number assigned to all Swedish residents at birth or immigration. This ID number was replaced by a serial number to preserve confidentiality.
The following sources were used to create our database: the Total Population Register, containing annual data on family and geographical status; the Multi-Generation Register, providing information on family relationships; the Swedish Hospital Discharge Register, containing all hospitalizations for all Swedish inhabitants between 1964 and 2009; the Swedish Prescribed Drug Register, containing all prescriptions in Sweden picked up by patients from July 2005 to 2009; the Out-patient Care Register, containing information from all out-patient clinics between 2001 and 2009; the Swedish Crime Register, containing complete national data on all convictions from 1973 to 2011; the Swedish Suspicion Register, containing complete national data on all individuals strongly suspected of crime from 1998 to 2011; the Swedish Mortality Register, containing causes of death; and the Longitudinal Integration Database for Health Insurance and Labor Market Studies (LISA), containing annual information on socio-economic factors on all individuals from 16 years of age. We secured ethical approval for this study from the Regional Ethical Review Board of Lund University (no. 2008/409).
Sample
We created three cohorts for these analyses: 2006, 2001 and 1996. For the 2006 cohort, from the Swedish population residing in the country on 31 December 2006, we identified all individuals aged 15–44 years, excluding those previously registered for DA. Incident DA registration was then assessed in these individuals from January 2007 to December 2011. In a second step, using the Swedish Multi-Generation Register, we identified all MZ twin pairs, full sibling pairs, maternal and paternal half-sibling pairs, and first cousin pairs. We separated paternal and maternal half-siblings because, although they shared the same degree of genetic resemblance, maternal half-siblings were much more likely to live together while growing up than paternal half-siblings.
Cohorts 2001 and 1996 were replications of cohort 2006 but with different time windows; that is, instead of using 2006 as baseline, we used 31 December 2001 and 31 December 1996 respectively. Cohort 2001 had a follow-up period from January 2002 to December 2006 and cohort 1996 had a follow-up period from January 1997 to December 2001. Thus, to serve as replications of observed trends, these three cohorts were constructed to be as similar to one another as possible.
We used the broad age range of 15–44 years in our three cohorts because this reflected the age distribution [mean and standard deviation (s.d.)] of first registrations although it is noteworthy that this was declining substantially over the historical period included in our study: 34.2 (9.7) years in 1996, 30.2 (9.2) years in 2001 and 25.9 (8.0) years in 2006.
Outcome variable
DA was identified in the Swedish medical registries by ICD codes [ICD-8: Drug dependence (304); ICD-9: Drug psychoses (292) and Drug dependence (304); ICD-10: Mental and behavioral disorders due to psychoactive substance use (F10–F19), except those due to alcohol (F10) or tobacco (F17)]; in the Suspicion register by codes 3070, 5010, 5011 and 5012, reflecting crimes related to DA; and in the Crime register by references to laws covering narcotics (law 1968:64, paragraph 1, point 6) and drug-related driving offences (law 1951:649, paragraph 4, subsection 2 and paragraph 4A, subsection 2). Crimes involved only in selling or distributing drugs were not included. DA was identified in individuals (excluding those suffering from cancer) in the Prescribed Drug Register who had retrieved (on average) more than four defined daily doses for 12 months of either Hypnotics and Sedatives [Anatomical Therapeutic Chemical (ATC) Classification System: N05C and N05BA] or Opioids (ATC: N02A). Individuals were considered to have their first recorded event of DA in our analyses if they fulfilled any of the above criteria. The distributions of incident cases of DA among Small Areas for Market Statistics (SAMS) for our three cohorts were – 1996: mean 0.8% (s.d.: 0.9); percentiles: 10th, 0%; 25th, 0%; 50th, 0.6%; 75th, 1.1%; 90th, 1.8%; 2001: mean 1.1% (s.d.: 1.0); percentiles: 10th, 0%; 25th, 0.4%; 50th, 1.0%; 75th, 1.6%; 90th, 2.5%; and 2006: mean 1.3% (s.d.: 1.2); percentiles: 10th, 0%; 25th, 0.6%; 50th, 1.2%; 75th, 1.9%; 90th, 3.3%. We have previously shown that these sources of ascertainment for DA are highly intercorrelated, supporting their validity (Kendler et al. Reference Kendler, Ohlsson, Sundquist and Sundquist2013).
Neighborhood- and individual-level information
Neighborhoods, as defined by Statistics Sweden, the Swedish government-owned statistics bureau, are known as SAMS. There are approximately 9200 SAMS throughout Sweden, with an average population of 1000. These SAMS units were initially created by the Swedish authorities for administrative and marketing purposes. They are often characterized by homogeneous types of buildings and are limited by ‘natural’ boundaries, such as highways, rivers or hills. In addition, they are relatively small, containing around 1000 residents on average, which is advantageous in neighborhood studies. Many previous neighborhood studies were based on larger geographic units, such as census tracts or even counties, which may not be a good measure of neighborhoods. Qualitative research has shown that small neighborhoods are consistent with how residents themselves define their neighborhoods (Huie, Reference Huie2001).
We created a neighborhood SD index for each of the SAMS based on registry data for all residents in the neighborhood aged 25–64 years (i.e. the working-age population) that are thought to have a stronger impact on the neighborhood than others. The SD composite contained the following derived at baseline: the proportion of residents with low education (⩽ 9 years), the proportion of residents with low household income (less than half the median income), the proportion of unemployed residents, and the proportion of individuals on financial assistance (Winkleby et al. Reference Winkleby, Sundquist and Cubbin2007). This measure has been validated in prior studies predicting risk and mortality for coronary heart disease (Winkleby et al. Reference Winkleby, Sundquist and Cubbin2007; Chaikiat et al. Reference Chaikiat, Li, Bennet and Sundquist2012) and access to health-care resources (Kawakami et al. Reference Kawakami, Winkleby, Skog, Szulkin and Sundquist2011). In the model the composite was kept as a continuous variable, with the SD score ranging between –3 and 11, with higher values indicating greater levels of neighborhood deprivation. The distributions of SD among SAMS for our three cohorts were respectively: 1996: mean 0.00 (s.d. = 1.42), percentiles: 10th, −1.57; 25th, −0.95; 50th, −0.17; 75th, 0.66; 90th, 1.59; 2001: mean 0.00 (s.d. = 1.41), percentiles: 10th, −1.44; 25th, −0.91; 50th, −0.22; 75th, 0.58; 90th, 2.33; and 2006: mean −0.03 (s.d. = 1.40), percentiles: 10th, −1.38; 25th, −0.91; 50th, −0.29; 75th, 0.44; 90th, 1.47.
Our individual-level information was defined at baseline for each cohort and included age (a continuous variable); gender (male and female); annual household income (size-weighted, divided into quartiles: highest, mid-high, low-mid, and lowest); financial assistance (dichotomized into yes/no); employment status (dichotomized into yes (sometime during the baseline year)/no and country of birth [categorized into four groups: Sweden, other Nordic countries, other Western countries (Western Europe, the USA, Canada, Oceania) and others]. In Sweden, financial assistance is intended to act as a last-resort safety net for people who have temporary financial problems. The Municipality Social Services assess each application individually and individuals must totally lack financial resources to be entitled. Before receiving such support, individuals must first apply for general benefits and compensation for which they may be eligible such as sickness benefit, parental allowance, housing benefit and maintenance support.
Using a multilevel logistic regression model, adjusted for individual covariates, showed that the proportions of variance in incident DA in our cohorts accounted for by SAMS were 3.4, 3.9 and 3.6% for our 1996, 2001 and 2006 cohorts respectively.
Statistical methods
We investigated the association between SD and individual DA risk. First, we used a generalized estimating equation (GEE) approach with individuals nested within their neighborhoods at baseline. This technique accounts for the hierarchical structure of the information with individuals nested within neighborhoods and estimates regression coefficients with a population average interpretation (Hu et al. Reference Hu, Goldberg, Hedeker, Flay and Pentz1998). Second, we sought to compare the results from the GEE method with the results from our co-relative design. Using conditional logistic regression (CLR), we performed five analyses on all MZ twin pairs, full sibling pairs, maternal half-sibling pairs, paternal half-sibling pairs and first cousin pairs that were discordant for DA and levels of SD. Discordance for DA was defined as one member of a relative pair having at least one lifetime DA registration and the co-relative never having a registration. SD discordance was defined as not residing in the same SAMS or in different SAMS with the same SD level.
In all models, we also controlled for individual income, age and gender. The co-relative design allowed us to contrast the rates of DA in relatives living in different neighborhoods with dissimilar levels of SD. The CLR provides a subject-specific regression coefficient for SD that is adjusted for the familial cluster, and therefore accounts for an array of unknown shared genetic and environmental factors. All analyses were repeated for each gender. The statistical analyses were performed using SAS version 9.2 (SAS Institute, 2008).
Results
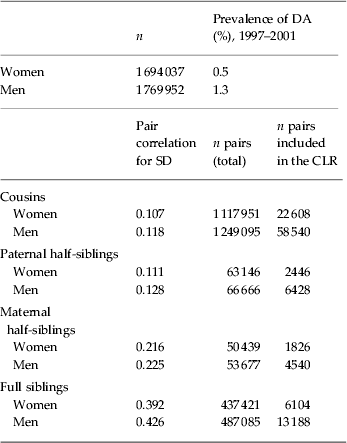
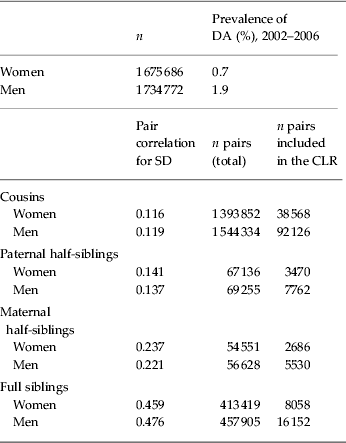
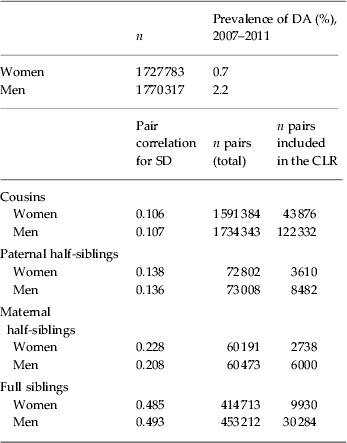
Tables 1–3 provide the descriptive statistics for our 1996, 2001 and 2005 cohorts respectively. The total numbers of individuals contained in these samples were similar, at ∼3.5 million each. Over the 5-year follow-up periods, increasing proportions of incident DA cases were seen, with rates ranging from 1.3% to 2.2% in males and from 0.5% to 0.7% in females. These tables also provide the total number of relative pairs contained in each cohort, their correlation for SD and the number of pairs who met criteria for inclusion in our analyses, being discordant for both DA and level of SD experienced. In all cohorts, cousin pairs were most common, followed by full siblings, paternal half-siblings and maternal half-siblings. As expected, for all classes of relatives, we had far fewer female–female than male–male pairs for analysis.
Sample size by gender, prevalence of drug abuse (DA), sample size by relative pairs and their correlation for social deprivation (SD) in all individuals included in the analysis of the 1996 cohort

CLR, Conditional logistic regression.
Sample size by gender, prevalence of drug abuse (DA), sample size by relative pairs and their correlation for social deprivation (SD) in all individuals included in the analysis of the 2001 cohort

CLR, Conditional logistic regression.
Sample size by gender, prevalence of drug abuse (DA), sample size by relative pairs and their correlation for social deprivation (SD) in all individuals included in the analysis of the 2006 cohort

CLR, Conditional logistic regression.
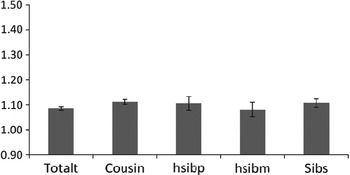
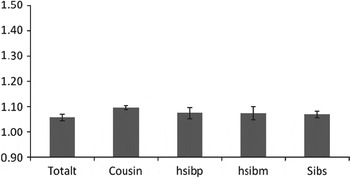
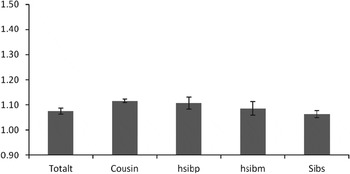
Table 4 depicts for each cohort both the raw odds ratios (ORs) and the ORs adjusted for individual SES with multiple indices (and 95% confidence intervals, CIs) between SD assessed at baseline and subsequent risk for first registration for DA in the entire population and in relative pairs ordered by their degree of genetic relationship. These adjusted ORs are consistently substantially smaller than the raw ORs, suggesting that a substantial proportion of the raw SD–DA association results from factors related to individual SES. Nonetheless, after controlling for individual-level factors, a highly significant SD–DA relationship remains. Furthermore, the raw ORs for close relative pairs are substantially lower than those seen within the entire population in all three cohorts, suggesting considerable familial confounding for the raw SD–DA association. However, as shown in Figs 1–3, where the adjusted ORs are depicted graphically, this effect disappears almost entirely when controlling for individual-level SES.
Odds ratios (ORs) and 95% confidence intervals (CIs) for the association between neighborhood social deprivation (SD) and risk for subsequent drug abuse (DA) registration in both sexes from our 1996 cohort. A population-wide sample of individuals aged 15–44 years without prior for DA was selected as of December 1996 and the follow-up period defined as January 1997 to December 2001. The ORs are presented for the entire population (totalt) and then within relative pairs of first cousins (Cousin), paternal half-siblings (hsibp), maternal half-siblings (hsibm) and full-siblings (Sibs). For relative pairs, we only examined those that were doubly discordant (for both level of SD and DA outcome) as these were the only pairs that were statistically informative.

Odds ratios (ORs) and 95% confidence intervals (CIs) for the association between neighborhood social deprivation (SD) and risk for subsequent drug abuse (DA) registration in both sexes from our 2001 cohort. A population-wide sample of individuals aged 15–44 years without prior for DA was selected as of December 2001 and the follow-up period defined as January 2002 to December 2006. The ORs are presented for the entire population (totalt) and then within relative pairs of first cousins (Cousin), paternal half-siblings (hsibp), maternal half-siblings (hsibm) and full-siblings (Sibs). For relative pairs, we only examined those that were doubly discordant (for both level of SD and DA outcome) as these were the only pairs that were statistically informative.

Odds ratios (ORs) and 95% confidence intervals (CIs) for the association between neighborhood social deprivation (SD) and risk for subsequent drug abuse (DA) registration in both sexes from our 2006 cohort. A population-wide sample of individuals aged 15–44 years without prior for DA was selected as of December 2001 and the follow-up period defined as from January 2007 to December 2011. The ORs are presented for the entire population (totalt) and then within relative pairs of first cousins (Cousin), paternal half-siblings (hsibp), maternal half-siblings (hsibm) and full-siblings (Sibs). For relative pairs, we only examined those that were doubly discordant (for both level of SD and DA outcome) as these were the only pairs that were statistically informative.

Raw odds ratios (ORs) and ORs adjusted for individual socio-economic status (SES) for the association between neighborhood social deprivation (SD) and risk for subsequent registration for drug abuse (DA) in three nationwide Swedish cohorts

CI, Confidence interval; MZ, monozygotic; aOR, adjusted odds ratio; models adjusted for individual income, financial assistance, employment status, country of birth, age and gender.
In each cohort, the OR within cousin, half-sibling and full sibling pairs was very similar to that seen in the entire population. Only in full siblings in the 2006 cohort do we observe an OR marginally smaller than that seen in the general population. The number of MZ pairs discordant for both SD and DA was small so these ORs were known imprecisely. In the 1996 cohort, the OR in these pairs was implausibly high but with very wide CIs: OR 3.42, 95% CI 1.23–9.55. In the 2001 and 2006 cohorts, the ORs in the MZ twins were also higher than those observed in the entire population (OR 1.28, 95% CI 0.91–1.81 and OR 1.23, 95% CI 0.95–1.59 respectively) but the population estimates were well within the wide CIs.
We examined whether the SD–DA association was moderated by age. As shown in Figs A1–A6 (see online Supplementary material) for the 2006 cohort (similar results were obtained with the other cohorts), the association between SD and DA was stronger in the older age groups. In age groups 25–29, 30–34, 35–39 and 40–49 years, the ORs were similar in the general population and in the cousin, half-sibling and sibling pairs. In the two younger age groups (15–19 and especially 20–24 years), a decline was seen in ORs in the more closely related relative pairs.
We were concerned about reverse causation in which early symptoms of DA that preceded official detection might cause downward social drift that could mimic a causal effect of SD on DA. We attempted to evaluate this empirical hypothesis in three ways. First, we repeated all of our analyses in all three cohorts restricting them to individuals who had resided in the same location for a minimum of a 5-year period prior to baseline (see online Supplementary Figs A7–A9). We found no evidence that the overall SD–DA association declined in the population screened for geographical stability. Second, we reanalyzed our data including a 2-year lag in DA registration so that anyone with a DA registration within 2 years of baseline was censored from each cohort. The aim of these analyses was to attempt to remove cases who had undetected DA at baseline. For the 2006 cohort, 47.7% (n = 24 846) of all DAs were registered within 2 years after baseline. Excluding them from the analysis gave an OR in the total population for SD of 1.07 (95% CI 1.06–1.08) compared to 1.08 (95% CI 1.06–1.09) when all DA cases were included. Excluding them from the sibling comparison (full siblings) gave an OR for SD of 1.06 (95% CI 1.04–1.08), identical to that seen when all DA cases were included. Similar results were obtained for the 1996 and 2001 cohorts. Third, we examined only individuals who did not move during the follow-up period. For the 2006 cohort, 56% of the individuals lived in the same area at the end of the follow-up. The ORs for the total population adjusted for all individual covariates and for full siblings pairs were both increased compared with those seen in the entire cohort (OR 1.10, 95% CI 1.10–1.11 and OR 1.18, 95% CI 1.13–1.23 respectively). Similar results were obtained for the 1996 and 2001 cohorts.
Discussion
In accordance with prior results (Faris & Dunham Reference Faris and Dunham1939; Warner et al. Reference Warner, Kessler, Hughes, Anthony and Nelson1995; Muntaner et al. Reference Muntaner, Eaton, Diala, Kessler and Sorlie1998; Compton et al. Reference Compton, Thomas, Stinson and Grant2007), we found, in Swedish national data after controlling for individual income, financial assistance, employment status and country of birth, a substantial relationship between the experience of neighborhood-level SD and risk for DA. However, this relationship is open to two major causal interpretations. First, the traits that increase risk for DA could also predispose individuals to poor occupational functioning, which would in turn increase the probability of residence in low SES areas with high SD. In this selection model, living in a neighborhood with high SD does not directly impact on risk for DA. Instead, the association arises because of a set of personal attributes that both increase risk for DA and increase selection into high SD environments.
The second possible interpretation of the SD–DA relationship is a causal one. The social environment itself could impact directly on risk for DA through a range of mechanisms including greater drug and crime exposure, an increased sense of helplessness, poorer social support with reduced ties to employed individuals, reduced economic opportunities and more deviant behavior in available peers (Crum et al. Reference Crum, Lillie-Blanton and Anthony1996; Williams & Latkin, Reference Williams and Latkin2007). The potential importance of this SD–DA pathway is supported by meta-analytic results documenting the clustering of DA outcomes in geographical areas (Karriker-Jaffe, Reference Karriker-Jaffe2011).
Discriminating between a selection and a causal model for the association between SD and risk for DA is both difficult and important. In this report, we used a combined prospective and familial design to address this issue. As the risk for DA is strongly familial, with contributions from both genetic and shared environmental factors (Cadoret et al. Reference Cadoret, Troughton, O'Gorman and Heywood1986, Reference Cadoret, Yates, Troughton, Woodworth and Stewart1996; Tsuang et al. Reference Tsuang, Lyons, Eisen, Goldberg, True, Lin, Meyer, Toomey, Faraone and Eaves1996; Merikangas et al. Reference Merikangas, Stolar, Stevens, Goulet, Preisig, Fenton, Zhang, O'Malley and Rounsaville1998; van den Bree et al. Reference van den Bree, Johnson, Neale and Pickens1998; Kendler et al. Reference Kendler, Karkowski, Neale and Prescott2000, Reference Kendler, Sundquist, Ohlsson, Palmer, Maes, Winkleby and Sundquist2012; Lynskey et al. Reference Lynskey, Heath, Nelson, Bucholz, Madden, Slutske, Statham and Martin2002), relatives of affected individuals will share a substantial range of risk factors for DA. The magnitude of sharing will be greater the closer the familial relationship. If the SD–DA correlation arises from selection, then the association between SD and DA should be lower in pairs of relatives discordant for SD exposure than in the general population because the unexposed relative (the one living in the low SD environment) will share some of the familial risk factors for DA and therefore will have an increased risk for DA. Because of this sharing, these relative pairs should differ less in risk for DA than unrelated individuals who vary to a similar degree in their exposure to SD.
Consistent with prior studies of this topic (Dohrenwend et al. Reference Dohrenwend, Levav, Shrout, Schwartz, Naveh, Link, Skodol and Stueve1992; Sareen et al. Reference Sareen, Afifi, McMillan and Asmundson2011), five of our findings provided evidence favoring the causal explanation for the SD–DA association. First, in our three cohorts, when we examined the prospective association between SD and DA in the entire population and in large samples of first cousins, half-siblings and full siblings, we found no evidence for a decline in the association with increasing familial relationships in the 1996 and 2001 cohorts and a very modest decline restricted to full sibling pairs in the 2006 cohort. In each cohort, controlling for a range of measures of individual SES, the member of the sibling pair living in the area with the higher levels of SD had an appreciably greater risk for subsequent DA than the co-sibling who experienced lower levels of neighborhood deprivation.
Second, among the small number of informative MZ twin pairs in each cohort, we consistently observed a higher prospective risk for DA in the MZ twins exposed to higher levels of SD. The CIs on these observations were wide but the trend was consistent across all three cohorts. Third, selecting a sample screened for geographical stability for a minimum of 5 years produced a pattern of SD–DA associations very similar to that for unscreened cohorts. Fourth, censoring all subjects who were registered for DA in the first 2 years of ascertainment, and so might have had an earlier onset of DA that could have led to downward social drift, produced almost no change in SD–DA association in the entire population and in full sibling pairs. Fifth, if we eliminated from our cohorts all subjects who moved during the follow-up, the magnitude of the SD–DA association increased slightly in the general population and even more so in the sibling pairs discordant for SD exposure.
All of these findings suggest that the SD–DA association we have observed in the Swedish population results, to a large extent, from the direct effect of experienced deprivation on risk for DA. However, two of our findings indicate caution in this conclusion. First, in the 2006 cohort we observe a small decline in the magnitude of the SD–DA association in full sibling pairs. Second, when we examine the SD–DA associations by age, we consistently see, across all three cohorts, a reduced association in closer relatives (full siblings and sometimes maternal half-siblings) in the youngest age groups. These results are open to two discrepant interpretations. Favoring the stress hypothesis, it might be that younger sibling pairs have had fewer years of living outside of their home of origin and thus more limited exposure to divergent levels of deprivation. Favoring the drift hypothesis, they may have had more limited opportunity than older pairs for downward drift to impact on the DA-prone member of the pair.
These two results suggest that selection may play some role in the association between SD and DA. However, it is noteworthy that, in all of our analyses, we controlled for a wide range of measures of personal SES. As shown in Table 4, on aggregate, these measures substantially attenuated the raw SD–DA association seen in the general population and in all relative pairs. Furthermore, the raw SD–DA association was considerably stronger in the general population than in close relative pairs, a pattern consistent with substantial familial confounding. However, controlling carefully for individual SES eliminated this pattern as the ORs in relative pairs closely resembled those seen in the population. Taken together, these results argue against the hypothesis that increased exposure to SD due to drug problems prior to official DA registration explains a large proportion of the observed SD–DA findings.
One important limitation of causal inference from the co-relative design is the role of non-familial confounders. Our results, with their apparent evidence for an SD→DA causal relationship, could arise entirely from risk factors that predispose to both living in high SD environments and having DA as long as all those risk factors were uncorrelated in relatives. Although we cannot rule out this possibility, we suggest that it is implausible given the strong evidence for familial aggregation of the vast majority of human behavioral traits (Turkheimer, Reference Turkheimer2001).
We are not the first to use co-relative designs to clarify the causal origin of the association between psychiatric illness and social class. For example, Silverton & Mednick (Reference Silverton and Mednick1984) examined whether social class of the home of origin or downward drift best explained the SES–schizophrenia association. They found that the SES was lower in the schizophrenic subjects than in their unaffected siblings, and they interpreted this as evidence for drift.
The problem of causal inference is problematic and some epidemiologists argue that, in the absence of experimental data, causal attribution is impossible. Our conclusion is more sanguine. Our analyses, which combined prospective and family-based elements, provide reasonable support for the hypothesis that neighborhood factors contribute meaningfully to the etiology of DA. Although not definitive, these findings have sufficient empirical merit to warrant consideration when developing etiologic models for DA and when planning for primary prevention.
Strengths and limitations
These results should be interpreted in the context of both methodological strengths and limitations of our study. The strengths include the application of a longitudinal co-relative design to nationwide and nearly complete samples, ascertainment of DA from multiple sources, the control in all of our analyses for personal income, and the use of a large number of small and precise geographical units.
Five potential methodological limitations are noteworthy. First, these results are limited to Sweden and may not apply to other countries, where the nature and distribution of SD might differ. Second, our findings do not provide any insight into the mechanisms whereby deprivation increases risk for DA. This is an important research topic that we hope to address in the future using the data available to us. Third, the co-relative design is based on the comparison of population-average models, which use standard logistic regression, and those from discordant relative pairs, which use conditional regression methods (Hu et al. Reference Hu, Goldberg, Hedeker, Flay and Pentz1998). Discrepancies in the estimates between these two approaches can occur and are largely dependent on the correlation between relatives. Hence, an estimate from a conditional regression can be approximated to a population-averaged coefficient based on the variance of the random effects (Hu et al. Reference Hu, Goldberg, Hedeker, Flay and Pentz1998). To explore this issue, we estimated the variance of the random effects among full siblings to be 0.56. This means that, for example, in our 2006 cohort, the population average OR for full siblings would decrease from 1.09 to 1.08. For the other relative pairs in this and other cohorts, the correlation is even smaller and is very unlikely to significantly bias our findings. Third, Frisell et al. (Reference Frisell, Oberg, Kuja-Halkola and Sjolander2012) have noted that a potential problem with the interpretation of within-relative-pair coefficients is that only pairs that differ in the exposure variable (in our case SD) will contribute to the estimation of the OR and these pairs may be unrepresentative of the entire population with respect to confounders. However, this critique is of limited relevance to us because our analytic methods differ from those critiqued by Frisell et al. (Reference Frisell, Oberg, Kuja-Halkola and Sjolander2012). Furthermore, omitted confounders produce biased estimates in any regression model. However, the bias in conditional logistic regression (which provides us with the key finding that, in matched relative pairs, the one experiencing higher SD goes on to have higher rates of incident DA) is likely to be small and is usually much smaller than in standard logistic regression when, as in this study, large amounts of matched data are available (Greenland et al. Reference Greenland, Schwartzbaum and Finkle2000). Finally, it is plausible that the ascertainment of DA from health and criminal records varies across communities in Sweden. It is possible that this variation has introduced noise or bias in our findings.
Supplementary material
For supplementary material accompanying this paper visit http://dx.doi.org/10.1017/S0033291713003048.
Acknowledgments
This study was funded by grant RO1 DA030005 from the National Institute of Drug Abuse, the Swedish Research Council (2012–2378), the ALF project grant, Lund, Sweden, the Swedish Council for Information on Alcohol and Other Drugs (CAN) and The Swedish Research Council for Health, Working Life and Welfare (reg. no: 2013-1836). C. Gardner provided helpful statistical advice.
Declaration of Interest
None.